TON : SELL LIMIT
Hello friends
considering the downtrend we are in, the power of sellers is quite clear and it is logical that we also move to the strong side, and in this downtrend, any price increase can be a selling opportunity.
So now, considering the buyers' support of the support area identified with Fibonacci, we need to see whether the sellers will enter again in the identified resistance area or not?
If the buyers weaken again in the resistance area, the price can fall to the specified targets.
This analysis is purely technically reviewed and is not a buy or sell recommendation, so do not act emotionally and observe risk and capital management.
*Trade safely with us*
Market insights

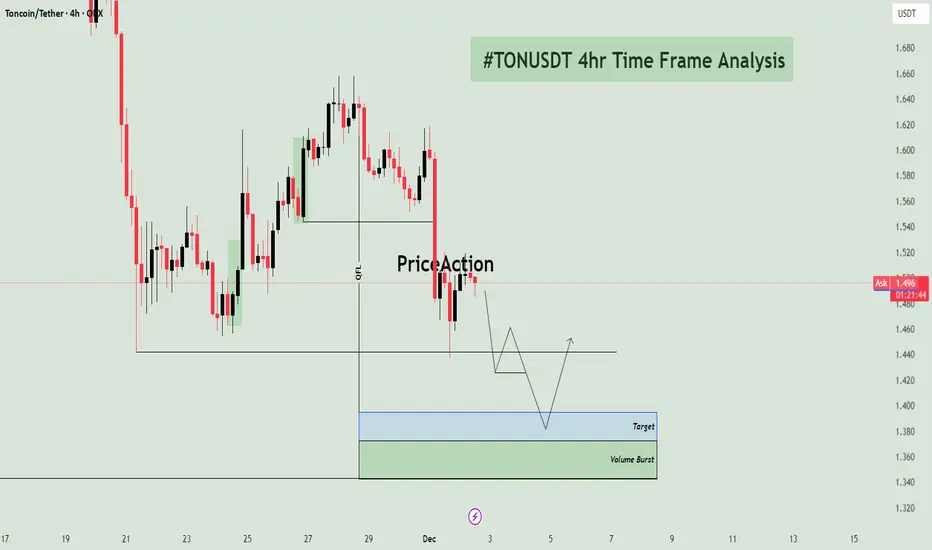
TONUSDT - Short Setup - Targeting Unmitigated Demand 📉 TON/USDT 4H: Anticipating Continuation Short Towards Unmitigated Demand
📝 Market Overview and Structural Context
The TON/USDT pair on the 4-hour chart is exhibiting a clear bearish structural shift. After a period of an attempt at a reversal (the recent small rally), the price has decisively broken below the most recent swing low, confirming that sellers are firmly in control.
The price is currently consolidating just below a key structural point and is expected to continue its descent toward a significant Demand Zone that was the origin of a previous move higher. The overall hypothesis is a short continuation trade, targeting this fresh demand zone.
🔑 Key Technical Zones and Order Flow
The analysis highlights the key structural break and the ultimate target zone:
1. Structural Break and Retest
Level: The swing low around 1.550 was recently breached.
Current Action: Price is now consolidating around the 1.480 - 1.500 area. The arrows on the chart suggest the expectation of a brief retest of the broken support level (around 1.460) before the bearish momentum continues.
2. Target and Volume Burst Zone (Demand) 🟢/🔵
Zone Location: This is the combined target area, spanning approximately 1.360 to 1.400.
Significance: This area is a high-quality Demand Zone, identified as the "Volume Burst" zone. This area was the origin of the last significant bullish momentum (likely a Drop-Base-Rally structure) that launched the previous swing high. It represents the first major unmitigated area where institutional buy orders are expected to be located.
The blue box, labeled "Target" (around 1.380 - 1.400), is the most immediate technical objective for the current short trade.
The lower green box, "Volume Burst" (around 1.360 - 1.380), marks the distal boundary of the demand zone, providing the ideal area for the final take-profit and potential reversal.
3. Order Flow Level (OFL)
Location: The price level around 1.560.
Significance: This marks the origin of the last structural high before the move down. The structural breakdown confirms the selling pressure from this point.
📊 Trading Hypothesis: Short Continuation
The trade plan anticipates a short continuation after a minor retest:
Trade Direction: Short (Sell)
Entry Strategy: The chart suggests waiting for a minor rally back toward the broken support level (around 1.460) to capture a more favorable entry price, minimizing risk. The short trade is initiated upon the rejection of this broken level.
Stop Loss (S/L): The Stop Loss should be placed safely above the recent swing high that failed to break the prior structure (e.g., above 1.560 or the most recent significant high).
Take Profit (T/P) 1: The Target (blue box) around 1.380 - 1.400.
Take Profit (T/P) 2: The distal boundary of the Volume Burst zone around 1.360, which represents the maximum expected extension of the current move before a significant bounce occurs.
⚠️ Risk Management and Invalidation
The risk lies in price reversing prematurely before reaching the target or failing to reject the retest level.
Invalidation: A decisive move and close above the OFL level (1.560) would indicate renewed bullish momentum and invalidate the bearish structural thesis.
FireHoseReel | TON’s Last Support of Defense🔥 Welcome to FireHoseReel !
Let’s dive into the analysis of Telegram Coin (TON).
👀 TONUSDT 4H Overview
TON has reached a very critical support zone. A clean break below this level could activate our next short trigger and lead to a deeper drop than many expect.
📊 Volume Analysis
Selling pressure during the formation of this support has been significant. With heavy market FOMO, many traders have already exited their TON positions. If this downside momentum continues, TON could enter a deeper corrective phase.
🔁 TONBTC Prespective
Meanwhile, the TON/BTC pair is also in a bearish structure, indicating that TON’s relative strength against Bitcoin is weakening.
📌 Trading Scenario
At the moment, TON presents one primary scenario, focused on the short side, which you can use alongside your own trading setup.
🔴 Short Scenario
A breakdown below the current support at $1.465, confirmed by a strong increase in sell volume, could trigger a sharp decline in TON.
❤️ Risk Management & Emotional Discipline
Crypto trading is highly risky. Without proper risk management and emotional control, trading is no different from gambling.
Logic must always come before emotions. Learn to manage your trades—and enjoy the process of trading with control and discipline.

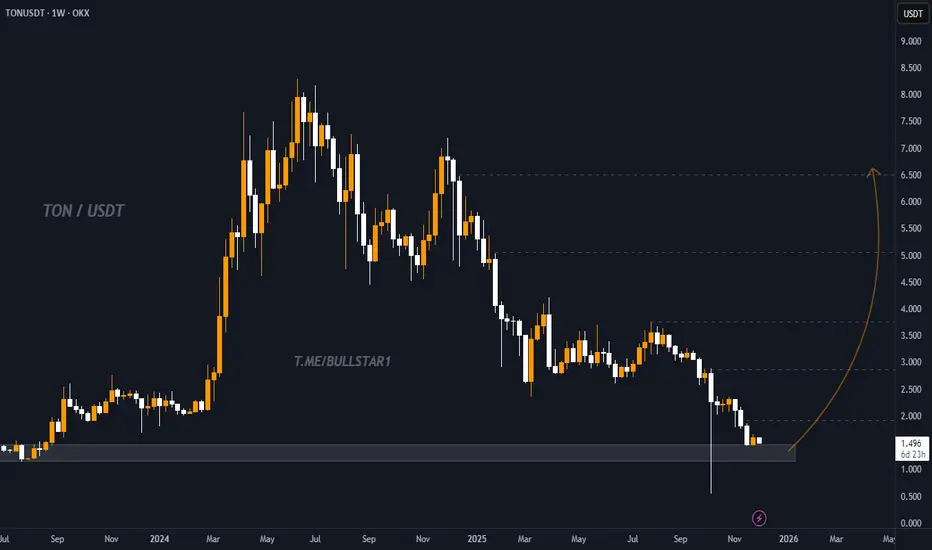
TON, Strong Weekly Support and Potential Recovery SetupTON is currently sitting on a strong multi month support zone around 1.40, a level where price has reacted several times in the past.
From this zone, TON has potential to start a steady recovery toward the next key levels, first near 2.50 then 3.00 and possibly 3.50.
This is a spot setup based on the weekly structure, showing a possible mid term reversal if the support continues to hold.
#TON #TONUSDT #CryptoTA #MarketStructure #SupportZone #PriceAction #CryptoTrading #ReversalZone
Long trade 🟩 1. Trade Details
Pair: TONUSDT
Type: Buyside Trade (Trade 2)
Date: Tue 25th Nov 2025
Time: 2:00 PM
Session: London → NY AM
Entry Timeframe: 15-min
Chart Timeframe: 1H
Entry: 1.5948
Stop Loss: 1.5533 (-3.81%)
Take Profit: 1.7833 (+11.84%)
Risk-to-Reward: RR = 14.49R
🟦 2. Higher-Timeframe Context (Blue Tab — HTF Narrative)
HTF Trend:
• The 4H & 1H structure shows the larger downtrend has completed its corrective leg.
• Price forms a multi-tap accumulation range with repeated liquidity sweeps under 1.5520 – 1.5600.
• A clear BOS on the 1H shifts narrative from bearish → bullish.
Key HTF Confluences:
Breaker block reclaimed (originated from the last sell-side displacement).
Discount pricing beneath the 0.618 retracement of the previous leg.
Daily Open reclaimed → bullish orderflow.
FVG cluster left behind during displacement, acting as fuel for a pro-trend continuation.
Directional bias: HTF buy-side targeting 1.70 → 1.74 liquidity.
1Hr TF
🟧 3. Liquidity Story
Liquidity events leading to the entry:
1️⃣ Sell-side liquidity swept
• Deep wick into 1.5520 level (multi-session equal lows).
• New York session provided the liquidity injection needed for expansion.
2️⃣ Inducement / engineered liquidity
• Double-bottom fakes & equal-low structures were purposefully created during Asia/London.
3️⃣ Displacement
• Strong impulsive displacement from 1.5580 → 1.6200
• Break of Structure confirms bullish orderflow.
4️⃣ Pullback into discount
• Price retraced into:
0.618 retracement
15-min FVG
1H FVG stack
Order block 1.5630–1.5690
This created the optimal trade entry.
5️⃣ Final Liquidity Target
• Buyside resting above 1.7300 → 1.7500
• TP aligns with prior swing-high inefficiency and breaker block.
🟪 5. Market Sentiment & Narrative
Session Flow:
• Asia created the range → engineered liquidity
• London manipulated → swept sell-side
• NY AM gave the displacement → bullish confirmation
Market Psychology:
Retail assumed trend continuation downwards due to prior bearish leg.
Smart money accumulated aggressively in discount during multi-session compression.
🟫 6. Outcome
Trade Status: ACTIVE (Price mid-leg expansion)
Current Position: in +6.3% unrealised PnL at time
Market Structure: intact bullish MS
Invalidation: Break & close below 1.5600

Toncoin (TON/USDT): Trendline Break & Double BottomHi!
TON has formed a double-bottom reversal pattern after a sharp decline, signaling early bullish momentum. Price has also broken the minor descending trendline, confirming a short-term shift in structure.
Key Levels
Immediate Resistance: $1.63–$1.68 (first supply zone)
Major Resistance: $1.78–$1.82 (trendline + supply confluence)
Bullish Scenario
A sustained move above $1.63–$1.68 opens the path toward $1.78–$1.82, where the main descending trendline is located. A breakout there would confirm a stronger trend reversal.
Bearish Scenario
Failure to hold above the breakout zone may lead to a retest of $1.50–$1.52, the neckline of the double bottom.

Ton coin on a BULL movetake this set up as the downtrend strated converting , the created higher high and the continuation of the bullish trend is a strong buy call

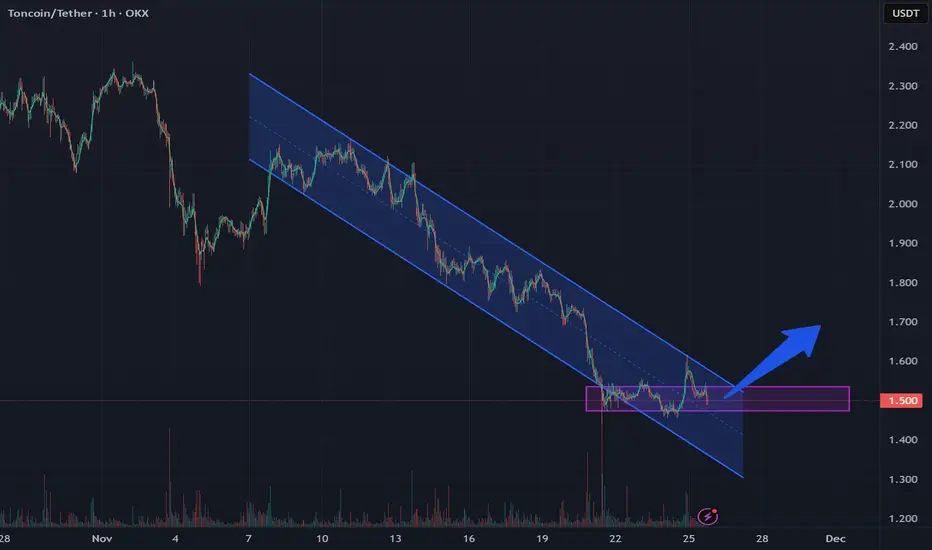
Lingrid | TONUSDT Retracement Short OpportunityOKX:TONUSDT is climbing into the 1.700 resistance zone, where the downward trendline and the previous-week low (PWL) converge — a classic confluence that often produces bearish reactions. Price is recovering from the lower-low at 1.450, but the structure remains decisively bearish as the pair continues to trade inside a well-defined downward channel. The current pullback shows slowing momentum, suggesting buyers may be running out of steam as the market nears supply.
If price rejects the 1.700 zone, downside pressure is likely to resume with the target at 1.500, where the buying area aligns with the channel floor. Bears maintain structural advantage as long as price stays beneath the trendline and fails to close above 1.700.
➡️ Primary scenario: rejection from 1.700 → drop toward 1.500.
⚠️ Risk scenario: breakout above channel would signal a bullish shift and open room for a corrective rally.
If this idea resonates with you or you have your own opinion, traders, hit the comments. I’m excited to read your thoughts!

#TON/USDT (TON/USDT): Trendline Break & Double Bottom#TON
The price is moving within an ascending channel on the 1-hour timeframe and is adhering to it well. It is poised to break out strongly and retest the channel.
We have a downtrend line on the RSI indicator that is about to break and retest, which supports the upward move.
There is a key support zone in green at the price of 1.47, representing a strong support point.
We have a trend of consolidation above the 100-period moving average.
Entry price: 1.50
First target: 1.53
Second target: 1.58
Third target: 1.63
Don't forget a simple money management rule:
Place your stop-loss order below the support zone in green.
Once you reach the first target, save some money and then change your stop-loss order to an entry order.
For any questions, please leave a comment.
Thank you.

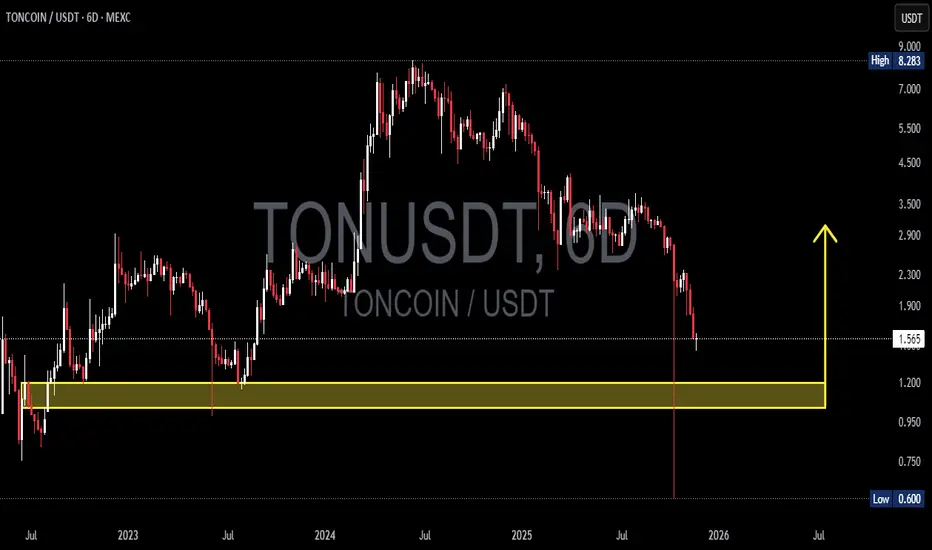
TON/USDT — Reversal Setup or Deeper Breakdown Ahead?On the 6D timeframe, TON has reached its most critical level since 2023. After forming a macro top near 8.28, the market shifted into a clean sequence of lower highs and lower lows, signaling sustained bearish control.
And now… price has landed directly inside the historical accumulation zone at 1.20 – 1.03 — a golden area that has repeatedly dictated long-term trend direction.
This isn’t just another support zone.
This is a psychological battleground, where major buyers stepped in previously and triggered multi-month rallies.
---
🔥 Why the 1.20 – 1.03 Zone Matters So Much
It has served as a macro pivot zone in previous cycles.
Every major uptrend in TON began with accumulation inside this area.
Holding this zone = potential multi-month bullish reversal.
Losing this zone = full transition into a macro bearish cycle.
TON is standing on the edge:
Either it rebounds explosively, or it breaks down toward levels not visited in years.
---
📈 Bullish Scenario — “Rebound from the Sacred Zone”
This scenario gains strength if:
1. Price prints a strong reversal inside 1.03–1.20 (pin bar / bullish engulfing).
2. A 6D candle closes back above 1.20 → confirms demand.
3. Breakout above 1.90–2.30 → confirms a macro trend shift.
If confirmed, upside targets are:
First target: 2.30
Expansion target: 3.50
Mid-cycle target: 5.00+
This could mark the beginning of TON’s next bullish cycle — but only with proper confirmation.
---
📉 Bearish Scenario — “Freefall Toward Extreme Lows”
Bearish continuation becomes likely if:
1. Price fails to hold the 1.03–1.20 support zone.
2. A 6D candle closes below 1.00 → macro support officially broken.
If breakdown confirms, downside targets become:
0.80
And potentially a retest of 0.60 (the previous flash-low wick).
A clean break below the yellow zone signals the end of TON’s multi-year bullish structure and opens the door for deeper corrective moves.
---
TON has entered the most decisive zone of the past two years.
The 1.03–1.20 range will determine whether TON launches a new bullish expansion…
or whether the market continues the strong downtrend toward 0.80–0.60.
The reaction inside this zone will dictate TON’s direction into 2026.
#TON #TONUSDT #CryptoTA #MarketStructure #SupportZone #PriceAction #CryptoTrading #ReversalZone
Long trade 📘 TONUSDT – Trade Journal Entry (2-Min Chart)
Tue 25th Nov 25 — 12:30 pm — London Session AM
Buyside Trade
🟦 TRADE SUMMARY
Pair: TONUSDT
Direction: Buyside
Date: Tue 25 Nov 25
Time: 12:30 pm
Session: LND Session AM
Timeframe: 2m
🟩 TRADE PARAMETERS
Entry: 1.5161
Take Profit: 1.5487 (+2.15%)
Stop Loss: 1.5089 (–0.47%)
Risk-to-Reward: 4.53 R
🟨 MARKET CONTEXT & STRUCTURE (Tab 3 — Yellow Transparent)
1. Higher-Timeframe Context
TONUSDT completed a macro retracement after a major rally to:
0.382 retracement @ 1.5530
0.618 retracement @ 1.5949 (pivot correction)
After the macro correction, price moved into accumulation inside a tight range along the 1.50–1.52 region.
2. Intraday Structure
The London AM session shows:
A sweep of internal sell-side liquidity at 1.5089
A BOS through 1.5205
A return to a discount FVG
A clean Order Block interaction at your entry zone
The structure turned decisively bullish, setting up continuation.
15min TF
🟪 LIQUIDITY
Sell-Side Liquidity Taken
Multiple low hunts at:
1.5097
1.5089
These acted as inducements prior to bullish displacement.
Buyside Liquidity Targets
Internal buyside pockets:
1.5348
1.5487
HTF buyside targets beyond TP:
1.5600
1.5740 (FVG unmitigated)
1.5949 (macro 0.618 retrace)
🟧 ICT MODEL BREAKDOWN
Model Used: SLL Sweep → BOS → FVG → OB Retest → Expansion
1. Inducement
Price swept the range low at 1.5089, completing the liquidity cycle.
2. Displacement
BOS occurred as price broke above 1.5205 with strong bullish displacement.
3. Entry Confluence
Entry at 1.5161 aligns with:
✔ Discount-side FVG
✔ Micro OB retest
✔ Unbalanced price inefficiency
✔ EMA supports (50 EMA crossing above 13 EMA on 2-min)
✔ Strong volume at displacement candle
🟫 WYCKOFF ALIGNMENT
Wyckoff Phase TONUSDT Price Behaviour
Phase A Preliminary Support at 1.5100
Phase B Multi-hour accumulation zone
Phase C Spring at 1.5089
Phase D SOS → LPS (entry)
Phase E Mark-up to 1.5487
We assume we are in Phase D
🟩 VOLUME & CONFIRMATION
Heavy sell volume absorbed at the lows (confirming spring)
Volume increased during BOS candle → institutional footprint
Declining retracement volume → bullish absorption
Strong breakout volume into premium → validates continuation
🟥 OUTLOOK / CONTINUATION
As long as price holds above 1.5160–1.5180 (post-break structure):
→ Expect continuation flow toward premium levels.
Upside Continuation Levels
1.5540 (2m FVG)
1.5600
1.5740 (HTF breaker)
1.5949 (macro pivot)
Invalidation
Break below 1.5089 negates bullish model.

TON forms a bullish flag pattern with a local liquidity zoneTON has formed a bullish flag pattern, and we've also reached the local liquidity zone we've collected
According to the pattern, an upward rebound is expected
Current price: $1.492
If the price falls below the zone of interest and consolidates below, the movement will continue in a downward corridor within the pattern
TONUSDT broken Ropening short after confirmation forms on 1H TF, important resistance has been broken, after confirming that it's not fake, we can enter.

Long trade
15min TF overview
🟩 Pair: TONUSDT.P
Direction: Buyside Trade
Date: Sat 22nd Nov 25
Time: 3.00 pm
Session: NY Session PM
Timeframe: 15 minutes
Model: Accumulation → Manipulation Sweep → Expansion
🔹 Trade Details
Entry: 1.5217
Profit Level: 1.7829 (+13.57%)
Stop Level: 1.5139 (–0.51%)
Risk-Reward Ratio: RR 26.47
Optimal Trade Entry (OTE)
NY PM session liquidity window
FVG boundary
Breaker block origin
Discount within the swing range
TP zones
1. Internal Liquidity: 1.563 – 1.585 (NY session high cluster)
2. External Liquidity: 1.7005 price level (major inefficiency fill)
3. Premium Imbalance Completion: 1.7829 (Your target)
🔹 Sentiment & Narrative Analysis
Market Cycle Phase:
Micro accumulation inside macro distribution.
Psychological Narrative:
We anticipated that retail traders would be selling the breakdown at the wedge lows, providing liquidity for smart money. With the NY PM session acting as the catalyst for expansion, with price drawn towards the premium side, inefficiencies positioned above.
Sentiment:
Turning from fear → disbelief → rally.

TON USDT LONG TRADE SETUPNew Trade Setup: TON-USDT
LONG
Entry: 1.520 or CMP
Target: TP1: 1.6105, TP2: 1.7010, TP3: 1.7915, TP4: 1.882
Stoploss: 1.397
Leverage: 1X
Technical Analysis: TON was facing strong selling pressure, but now it is taking support. Its RSI is also below 20, which indicates extremely oversold conditions. So there is a high chance of a bounce-back.

Toncoin (TON): Last Chance | Now or NeverTON is dropping into a key support area, and this is the zone where we finally want to see buyers step in. No confirmation yet, but the reaction around this zone will decide the next move.
If buyers manage to hold this level and give us a clean BOS, then the buy area becomes valid and we look for continuation back toward the upper targets. Until then, patience — let the structure confirm first.
Swallow Academy

Lingrid | TONUSDT Bearish Momentum Stall - Potential ReversalOKX:TONUSDT is slowing its decline as price decelerates directly on the 1.65 support zone, where the lower boundary of the downward channel has repeatedly produced rebounds. The structure remains bearish overall, but the price action inside this buying area shows early stabilization after a sharp move from the mid-range resistance. If buyers defend 1.64–1.65, a corrective rally toward 1.87 becomes the primary scenario as liquidity gathers near trendline resistance. The broader pattern favors a short-term bullish reaction before the larger downtrend potentially resumes at higher levels.
⚠️ Risks:
A clean breakdown below 1.64 may open a deeper slide toward 1.55–1.50.
Market-wide volatility from BTC could disrupt the developing accumulation structure.
Failure to reclaim the descending trendline could limit upside potential and keep TONUSDT trapped in consolidation.
If this idea resonates with you or you have your own opinion, traders, hit the comments. I’m excited to read your thoughts!

TON Update!OKX:TONUSDT is still moving inside the falling channel.
Price is now very close to the major support zone (1.14–1.34) — a region where a bounce has high probability.
If OKX:TONUSDT reacts from this zone, the next target would be the mid-channel level and then 2.37.
But if it rejects there again, we continue the downtrend until a proper breakout.

TONCRYPTOCAP:TON is trading inside a clean descending channel, a classic bullish reversal structure. Once it breaks out, the move can accelerate fast. From current levels there is a potential 460 percent gain, and a run to $10 is very realistic based on the pattern strength.

Ton still does not work well enoughaccording to last analysis
ton lost last support
we expect downtrend if price goes down last higher low
do your own research
dont forget that we lost last support

TONUSDT — 1M Probability Map | 40% Bearish vs 10% BullishThis chart is a probability-based forecast for TONUSDT over the next 30 days — instead of predicting one final direction, I mapped out four possible outcome zones with weighted probabilities based on: Supply & Demand Zones Structural Trend Lines Volume Weakness Failed Breakout Behavior EMA Cluster Resistance Probability Map: 40% → Deep Bearish Continuation Zone 50% → Sideways / Accumulation Zone 3% → Mild Relief Rally 7% → Strong Bullish Breakout Zone This model will be updated if TON breaks structure or volume sentiment shifts. 💬 Share your scenario in comments — bullish or bearish?

$TON Trendline Probe – Support Hold or Further Fade?BINANCE:TONUSDT LSE:TON Trendline Probe – Support Hold or Further Fade?
Current trend: TON's grinding along the descending trendline from 2.50 peaks, now hugging 1.90 support amid alt bleed—sellers probing, but low-volume wicks signal potential buyer trap 🛡️.
Hold support? Yes probable; EMA stack and prior lows confluence could spark a clean rejection.
Breakout above resistance? Bullish if 2.30 clears on close—unleashing 5-7% rally to trendline top 🚀.
Dip risk? Moderate to 1.85 on breach, tied to BTC drag.
Target: Short-term 2.10 bounce; downside 1.80 buffer.
Indicators tracking: RSI (42, neutral zone), Trendline slope, and MACD histogram fade 📊.
#TONTrading #CryptoSupport #FiboTrendCrypto

Lingrid | TONUSDT Demand Area Long Entry OpportunityThe price perfectly fulfilled my previous idea . OKX:TONUSDT is dipping into the support zone after a sharp breakdown from the compression structure, retesting the lower boundary of the descending channel. 4H chart shows price interacting with both the long-term support line and the short-term descending trendline, creating a confluence area for a potential rebound. A sustained hold above 1.85 opens the path for a corrective rally toward the 2.00 psychological mark as buyers step in from the reaction zone. Overall, the structure favors a short-term bullish bounce as long as the support base remains intact.
⚠️ Risks:
A clean H1/H4 close below 1.86 would invalidate the rebound setup and expose 1.79.
Weak market sentiment across majors could limit the strength of the corrective move.
Failure to break above the descending trendline may trap price in extended consolidation.
If this idea resonates with you or you have your own opinion, traders, hit the comments. I’m excited to read your thoughts!
