TOTAL2 It is completing the 5 wave of 1orA . The specified Fibo range is reasonable for a buy position.
TOTAL2 trade ideas

ALT M.CAP IS FORMING A BULL FLAG!!Hello everyone, if you like the idea, do not forget to support it with a like and follow.
Welcome to this TOTAL2 aka Altcoin M.cap update.
Total2 is forming a bullish flag like structure in 4hr time frame. Currently, it is trying to break the flag here. If it succesfully breaks the flag then we might see some more 15-20% bullish rally in Altcoins. In case of a rejection, we have an important support at around $550B which must held.
Keep an eye on this.
If you like this idea then do support it with like and follow.
Also, share your views in the comment section.
Thank You!

[UPDATE TOTAL2] 3 scenarios: A? B? C? It depends on CPI!I'm comfortable with all the 3 scenarios:)
A) Super rally, lower inflation, and then a new inflationary bear cycle
B) Rally, stage 3 and stage 4 of a bear market. New all-time highs in 2026 and 2027.
C) Rally, we go down less than the previous bear markets. More consolidation.

#TOTAL 2it means coming more money to market
as we can see the trend is broke
and we have a triangle bullish pattern.

Total 2 be careful with the volatility that could come This zone is specially delicated for how long was the time that the price was lateralizing there , and many indicators are showing bearish divergence so at the end is obviously a strong movement would come in the next days but today and tomorrow the price has higher probabilities to be between the 590/560B .

ALT's updateI believe ALT's have more room to grow. But overall after that this might fall very hard. Be prepare for that. Trade safe. Better if you observe like me.
Not a financial advice

Total 2 the Crypto Market is doing very bad The Total 2 is in a resistance and we can notice the price doesn't have the enof volume and interest for continue going up

Ascending wedge: The big Altcoin flush out is coming in 2024This feels very plausible, if this happens it's probably the entire space getting regulated similar to what happened to the internet after the dotcom bubble finally reached a melt up point. Prepare for the madness. If this happens bitcoin will not become the new gold standard but instead CBDCs will enslave the world. SDR took over back on August 15, 1971, when President Richard Nixon announced that the United States would no longer convert dollars to gold at a fixed value, thus completely abandoning the gold standard.
Blockchain projects like Ripple Labs and Algorand would become a part of ISO20022 to digitize existing ISO 4217 (XDR) Special Drawing Rights.
"The XDR comes to prominence when the U.S. dollar is weak or otherwise unsuitable to be a foreign exchange reserve asset. This usually manifests itself as an allocation of XDRs to IMF member countries. Distrust of the U.S. dollar is not the only stated reason allocations have been made, however. One of its first roles was to alleviate an expected shortfall of U.S. dollars c. 1970"
Under this scenario: Dogecoin (equivalent to Pets dotcom back in the days), Ethereum (equivalent to Netscape back in the days). Would literally die after 2024.
It's a complete Altcoin flushout and altcoin apocalypse for many.
The new digital Gold, or Bitcoin, would also tank until equivalent to 2003 and would eventually hit new all time high which could be anywhere between 90k to 130k (keep in mind that Gold has only hit 66k per kilogram, so maybe peak is already in for Bitcoin unless Gold hits a new all time historic high). Overtime, Bitcoin and Gold could move together. To think Bitcoin will hit a million dollars under this narrative is not and wouldn't be realistic at all, unless there is hyperinflation in the US amidst a total dollar collapse, something that isn't plausible either, it can maybe hit a 60% low in a few years as other countries in G7 are integrated as global reserves next to the dollar.
This is my honest opinion. The most unpredictable scenario is perhaps the most likely one, and I think this is it. Very concerned about the future of decentralization and what crypto meant. Satoshi would be very disappointed.

The bullish scenario of the market, of course, with the right puHello. In this uncertainty of the market, where nothing can be understood about its rise or fall, with total2 and usdt.d, several scenarios can be monitored.
total2 can be one of the two paths in the image that I drew in red and blue. Of course, I said that at the moment it is really impossible to comment with complete certainty, but with two or three scenarios, the final path can be followed.
I will present my new analysis to my friends soon. Goodbye

Altmarketcap usd 1 weekAltmarketcap usd 1 week
dollar mollar
hadi
to the moon
hedef 2024
dayısı ajan

ALT M.CAP UPDATE! WHEN TO GO LONG IN ALTS??Hello everyone, if you like the idea, do not forget to support it with a like and follow.
Welcome to this TOTAL2 aka Altcoin market cap update.
TOTAL2 is forming a falling wedge like structure in 4hr time frame and currently looks like it is going for a 3rd tap of lower trendline of the wedge. Once it is reached near the lower trendline ($495-$500B) we can open some long positions with a tight stop loss. Longing here is more risky and less rewardable.
Hope this chart helps you to take better trade decisions.
If you like this idea then do support it with like and follow.
Also, share your views in the comment section.
Thank You!

TOTAL2 - Whipsaw possible, but I doubt it.It's possible that TOTAL2 touches the weekly 400MA, however indicators are oversold and likely a deviation for liquidity is a higher probability.

TOTAL2 UPDATE! ALTCOINS IS IN DANGER!!Hello everyone, if you like the idea, do not forget to support it with a like and follow.
Welcome to this TOTAL2 aka Altcoin market cap update.
Total2 is not looking good here. It breaks down from the bear flag-like structure and the recent pump in Altcoins was just a retest. After this retest, we might see more drop in Alts.
If you are holding any Alts then keep your stop loss tight.
If you like this idea then do support it with like and follow.
Also, share your views in the comment section.
Thank You!

alt coin rally coming?alts are currently dumping, we can see the 200 wma lines up with some support for alt coin market cap, given the the next few months are historically bullish and we are still before midterms i don't expect this to break yet. could see a double bottom or bullish divergence over next few weeks/ months. but if money starts flowing into just bitcoin as it should this could break fairly quick.

TOTAL2 Alternate Bull Trap ScenarioPrice right now is pretty stagnant this could be indication of a bottom or a bull trap similar to one seen in prior bear market
This is a max pain scenario
Linking my other analysis which suggests this price action is the bottom. Its gotta be one of them right?

there's someone thinking this is a good zone for long?? we are in a range and we need to respect that in the high zone is short not long or believe we going to the moon

ALT COIN MACRO REPEAT - update OCT 2022An update on the ALT macro repeat idea i posted before.
I wanted a map for the continued downside option here.

TOTAL2 - Mid Term Recovery I expect the crypto market (particularly) the altcoin market here (TOTAL2) to undergo a partial recovery from this extreme bear market we have all experienced.
A market cap rise from where we are now to the middle line of the up channel drawn (dotted white line)
This bullish expectation should be reached by early 2023.
A W formation can be seen on chart with bars pattern.

Altcoins' last bull rally before a tumble?In this graph we have the dominance of altcoins disregarding stable coins.
The calculation is done as follows:
TOTAL = Crypto Total Market Cap
TOTAL2 = Crypto Total Market Cap excludes BTC
USDT = Market Cap of stable coin USDT
USDC = Market Cap of stable coin USDC
DAI = Market Cap of stable coin DAI
So:
Altcoins Dominance % = (CRYPTOCAP:TOTAL2-CRYPTOCAP:USDT-CRYPTOCAP:USDC-CRYPTOCAP:DAI)/CRYPTOCAP:TOTAL*100
Looking at the chart the index is in a bearish channel.
It will apparently test the top of the channel at wave 4 resistance.
If this channel breaks, we will have an extremely bullish scenario, surpassing all expectations, due to the horrible macro scenario.
Otherwise the downtrend continues, heading towards the end of wave 5.

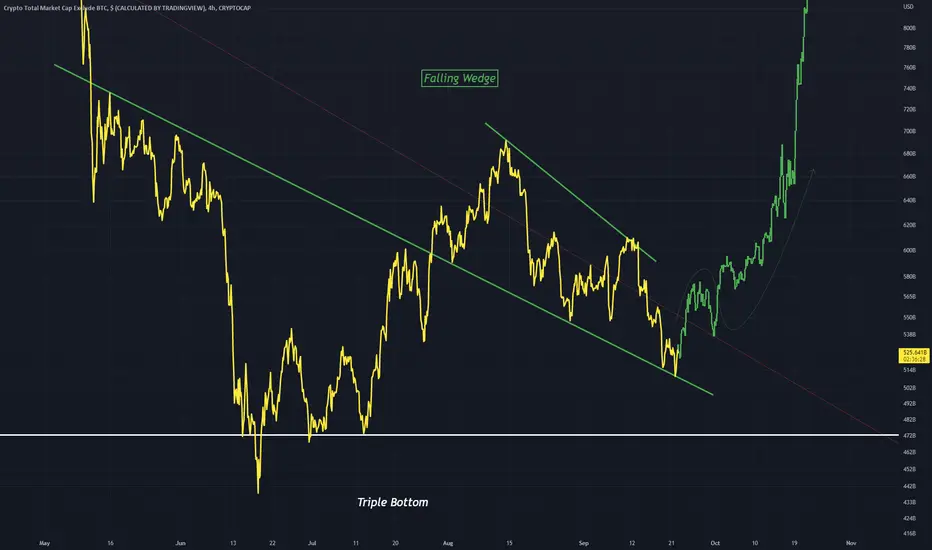
TOTAL2 Falling Wedge and Triple BottomThis is the 4Hr timeframe chart for TOTAL2
It shows a nice falling wedge forming right along the dominant downtrend line in red
This is all above a strong triple bottom which is a great candidate for a reversal point in the market
I expect a strong breakout out of this falling wedge
Cryptocurrency marketcap excluding Bitcoin (TOTAL2)If we exclude Bitcoin from the total cryptocurrency market cap we get the TOTAL2 parameter. The capitulation can easily be seen in this graph and I can tell you that it is even worse than the Total market cap because the market dumped even further on June 13th week. (482.5 Billion USD) Yesterday's dump brought us close to this low point and we are now at the 518 Billion USD level.

Best Yet To Come...It's looking like we could be at the start of a multi year Bull run and accumulating alts here is likely to pay off long term - The wave count is a visual representation of what I think is going to happen (based off fibs) - Most people now are very bearish and sitting in cash scared to buy - so the bottom is probably in.

Alts Market Current StatusThis is just an idea. Nothing special or advise. This is what i think about Alts market right now, i think it should be better to wait for next moves before entering or exiting the alts market atm.
