When the next altseason might happen?One usually refers to altcoins and mems flying high when talking about big profits and pumps. So, when the next alt season could happen? To answer this question, analysts usually examine ETH and the Crypto Total Market Cap (excluding BTC and ETH) charts to make a prediction. Moreover, I think it is worth analyzing the Dominance of altcoins (excluding BTC and ETH) as well. I already analyzed the ETH before and updating it periodically, so let's look at the Crypto Total Market Cap.
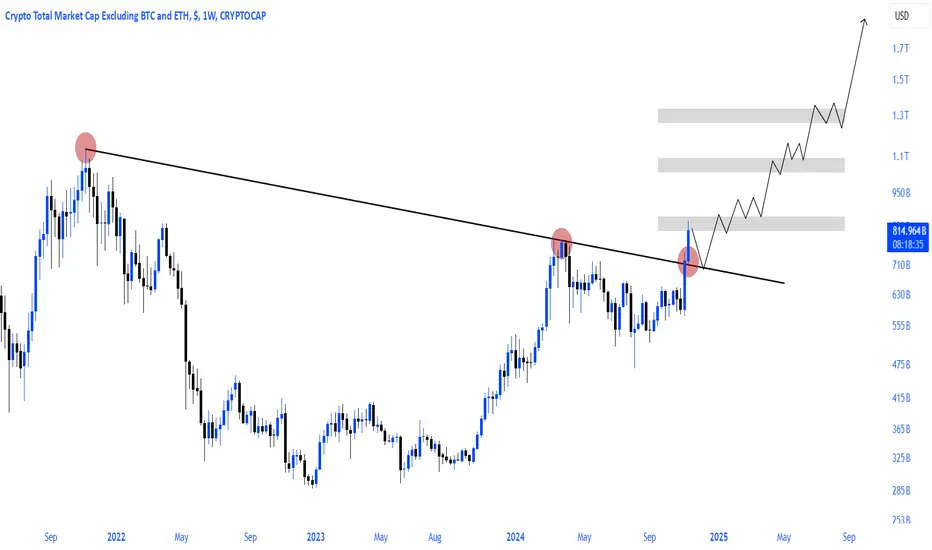
When looking at the Total Market Cap chart, it is evident that there was a downtrend in which lower lows were made one after another. Recently, in March 2023, a higher high and a higher low were made; a sign of a possible reversal. But, two higher highs and two higher lows are needed, at least, for the reversal confirmation. Furthermore, the value/price of the Total Market Cap must not breach the recent higher low. Based on the technical analysis, two possible scenarios can play out that are drawn on the chart.
TOTAL3 trade ideas

ALT/BTC reversalI said it before and I'll say it again. We are early for alts with an imminent ALT/BTC reversal coming up. Im expecting BTC to hit 100k and then more people to flock back in going higher up in the risk curve. Dont forget how much money remains sidelined

I bet you are not watching this chart of TOTAL3#ALTSEASON Update🚀
Let’s dive into some detailed alpha!
Take a look at this (Total3-USDT-USDC)/BTC chart. It clearly indicates that #Altcoins could bleed by a maximum of 20% further from current levels in CRYPTOCAP:BTC pairs. However, this doesn’t necessarily mean they’ll lose value in USD terms if #BTC continues to pump, which seems likely in the coming weeks.
Following this, altcoins are expected to start outperforming BTC and will likely peak when this chart reaches around 0.56, with another possible top at 0.91.
PS: The altcoin market is highly fragmented this cycle. Not every altcoin will pump equally or peak at the same time. However, overall, the altcoin market could potentially achieve a top near the 0.91 level, which represents a 3x increase from current levels.

Altcoin Market Price Prediction ChartThis innovative chart provides a comprehensive overview of price predictions for the entire altcoin market. Leveraging advanced analytics and state-of-the-art algorithmic models, it highlights key trends shaping the future of this ever-evolving market.
Whether you’re an experienced investor or simply curious about the potential of cryptocurrencies, this chart is a valuable tool to anticipate market movements and refine your strategies. Stay ahead of fluctuations and make informed decisions with a clear and concise vision of the altcoin market's future.

#Altseason parabolic run loading!Alts bullish season is loading with an upward break and retest of the bullish arm cup formation
#Alts market cap #total3 are looking ultra bullish!
#Altcoins are generally still in hibernation!

TOTAL 3 - Crypto Total Market Cap excluding BTC and ETHVery technical. A global trend, followed by a correction to the 0.618 Fibonacci level and the global order block, which is also the PoC (Point of Control) of the entire trend movement. We're clearly moving within a kind of wedge.
We haven't been fans of technical analysis for a while, but part of it will always stay with us. I think this is one of those moments when, after it plays out, people will look back and say: "How obvious it was."
There are two options here: either one more update of the lows on altcoins or a correction upwards. Two scenarios, but globally, it doesn't change anything.

TOTAL3 update - Nov 20 2024Total3 has reached a heavy resistance zone and give the fact that its recent ascending trendline is already broken, it is quite possible to see some dump in the market towards 690B - 727B zone.
If TOTAL3 continues to drop below 665B level, the drop becomes deeper and more time-consuming.

Possible Altcoin Season This SummerThe total market capitalization for altcoins (Total 3) appears to respect the support line, which suggests we might be near the bottom. This technical analysis indicates that we are at the low side of the 0.618 Fibonacci level. This level often acts as a strong support and could potentially lead to a significant push higher, similar to the 60% increase we saw from February to March. This upswing could happen as early as mid-August.
However, it's important to keep in mind the possibility of a slight drop to the 0.786 Fibonacci level, around a $545 billion market cap, before a significant upswing. This lower support level could provide a strong foundation for a robust rally.
Personally, I plan to wait until Bitcoin surpasses $64,500 before making larger investments to ensure lower risk management. This strategy aligns with a cautious approach, considering the potential volatility in the market.
Regardless of which scenario you believe in, there is a strong possibility of a substantial upswing this year, potentially exceeding the highs we witnessed in February. Stay tuned and manage your investments wisely.

very lil TA skills Altcoin 3 optimistic guess from here As of now I still have very little TA skills, and on this optimistic version of my guess/prediction from here, I just used the same few revelations I came across when I did my first ever btc chart (finding a parallel channel that fits previous price action, and then just duplicating the the parallel channel and stacking it, to get a basic blueprint of an overlay of potential resistance and support lines), combined with TA techniques from free Crypto Crew University youtube videos and an aggregate of other youtubers here and there, and I'm probably using some wrong but yea, this is my 'bullish' and optimistic guess/prediction as a first full cycle 'retail' hodler.
If i'm not going on what I want to happen, my bearish feeling and guess/prediction would be, a 25%-35% sell off before or after thanksgiving, and either going back up shortly after and keep running through 2025 or worst and what it feels like, toping out around the 10th-14th of December.
Feel free to tell me what will likely happen if you are an experienced TA chartist.

Parabolic #Altseason loading!#Altcoins matket cap #Total3 is on the verge of a big breakout!
#Alts are on the verge of a big breakout like before the 2021 mega bull season!

#Altcoins are starting to warm up ahead of the major run!The bullish wave we are witnessing is just a trailer The biggest one hasn't even begun yet for #Alts
The $Altcoins MarketcapThe $Altcoins Marketcap chart indicates a strong bullish breakout, with the market aiming for a significant increase. Based on the pattern, the target is $1.533T, supported by a "Cup and Handle" formation. This suggests a continuation of the upward trend as altcoins gain momentum. A breakout above the current resistance confirms a substantial rally in the #Altcoin sector.

#Altcoins parabolic run coded!As of q4 2024 #Alts run has generally started!
God candles that will turn into #altseason will be inevitable!

Tick... Tock... #Altseason #Alts mega run is inevitable!
Wyckoff method pattern signals a mega phase for #Altcoins

%100 Total3 Potential GAINS COMING!!BULLISH WEEKLY momentum incoming!
I see a 100% gain in the total 3 crypto market cap coming by mid 2025!! This is huge, I project this may be the bull market top, and given if other economical activities ease, we could see a PARABOLIC growth. Never mind 100%, we could see 200, 300 even 500% growth.
Ultimately, this is massive for the ALTS, growth like we have never seen before.
Happy Trading :) NFA

TOTAL3: alt seaon is coming soonIt looks like the MACD is about to cross on the 1W time frame, signaling the potential start of an altseason soon.
The chart speaks for itself.

Alts 2020 x 2024#Altcoins are literally in the process before a bull run like the one in 2020!
#Alts continue to provide opportunities at low levels overall!

My toughts on Total 3Alt Season could start after total 3 bottomed
Customized chart, Total 3 without USDT and USDC / BitCoin
So, The chart will be Alt Coin / Bitcoin Ratio

First below then aboveFirst alts will dip if btc.d comes down?
The last buy
How deep will we go
Btc 69k? Think so
Xrp buy at 0,444 Lets see
Goodluck.
Nvr
Gv
P
X

ALTCOINS TOTAL3 Altcoins have struggled in the last 5-6 months since BTCs slowdown.
Some alts are down 80% from their highs but are now displaying a promising pattern for the bulls. The chart shows the daily support that intersects 3 points that make a head and shoulders pattern. This H&S pattern is an important reversal structure that if gets completed would signify the bottom of the downtrend and the beginning of an uptrend.
Since this H&S reversal TOTAL3 has flipped the 1D 200EMA and is now at diagonal resistance. Should this resistance be broken and accepted above as well as the WEEKLY S/R then the next target is DAILY RESISTANCE. This would be great for smaller can alts especially the newer projects that have not experienced a Bullrun yet.
In terms of a trade setup. I would place an SL below the local low as this would be a trend break and could signify a further sell-off.
Take profits @ DAILY RESISTANCE, $720B & $780B.


TOTAL3: Alts Bleeding !! Capitulation ?!TOTAL3 is printing a big bearish candle -- a retest of the lower support level
Could this be the final stage of the bearish trend - a capitulation ?!

ALTS PUSH ? - After weekend this will decideAfter the weekend, a double break of the trendline and RSI will decide if we have the long awaited FINAL PUSH for the Altcoins.
This time, unlike 2018 and 2021 I think it will be selective. Not all alts are going to fly or even go up, so we will have to choose wisely.
Some of the ones I follow individually with the confirmation of this chart are #LINK, #ONDO, #XRP and #VELA.
They all depend on this chart and what happens with #BTC.
Let's follow it closely!
CRYPTOCAP:BTC CRYPTOCAP:XRP BIST:LINK LSE:ONDO LSE:VELA
