TOTAL3 BottomWill see this happening, as the bottom reached.
Disclaimer, this is pure only a prediction/speculation.
Trade safely.
TOTAL3 trade ideas
Are altcoins primed for a move higher?This is a chart of altcoins excluding BTC and ETH. Holding the support @ approximately 470 Billion is key to this move. As we see right now we have dipped below but we need a close to be confirmed. Let's keep an eye on this as a cheat sheet to the near future.
Not financial advice.

TOTAL3 - Alt Season Could Be Just Around The CornerIn a previous idea i've compared eth price with what btc did in may- aug 2017. TOTAL3 (crypto m. cap excluding btc and eth) looks even more similar than eth does. We see clear initial fall in the summer, then barely setting new highs, before turning down, heading into the lows, maybe go even lower a bit. We should expect HUGE reversal to the upside. This is because one vital element is missing here. We haven't altseason for nearly 80% of all the altcoins. Many of which haven't even rally 1/3 of what they did in a previous cycle, even though they are listed on all major exchanges, and have a use case. (XRP, DASH, EOS, XMR, ZEC, IOTA...)
I expect one final flush to come, then euphoria...
I am not a financial advisor so non of this should be taken as a financial advise. Be well.
CRYPTOCAP:TOTAL3
BITSTAMP:BTCUSD

TOTAL3 - BEARISH RETESTRelief rally.
Likely bounce back forming a bearish retest.
Support becomes resistance.

TOTAL3 - BEARISH RETESTSupport flips into resistance.
If it breaks we might see a triple top formation.

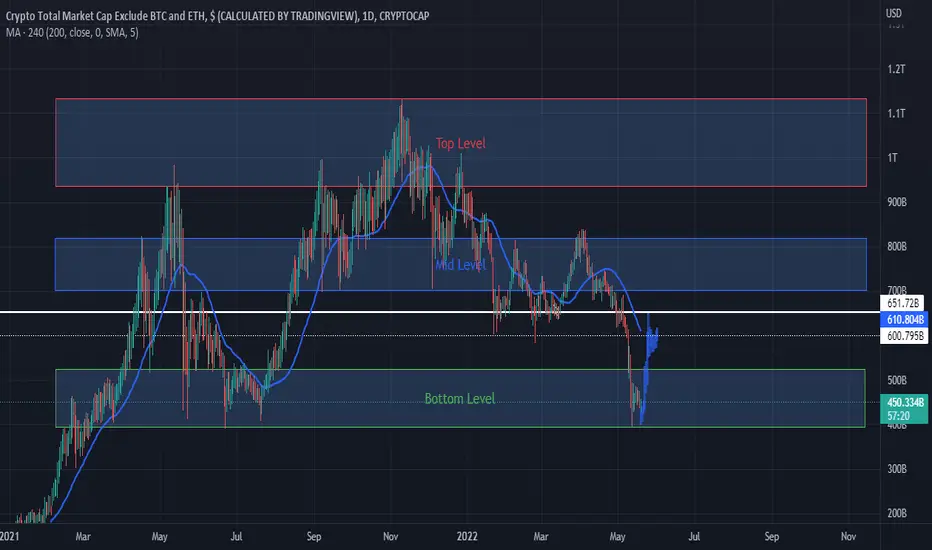
TOTAL 3 My Idea This is the TOTAL3 index which displays the Total Crypto Market Capitalization excluding Bitcoin and Ethereum

Hopefully we can hold this main trend.Looking at the TOTAL charts aren't too good for TA IMO but it helps put things in perspective, I'm hoping we can bounce and stay above the main trend however I'm pretty confident we don't, whether its a move fueled my liquidations or panic either way I don't think we have enough support. I know a'lot of us are hurting and further downside isn't what we need right now but we must be prepared. My portfolio is in absolute ruins but we must remain bullish long term. My buy area is just a general area of where I am going to look for to top off my alt bags. I didn't take profits as I should've but if you did this chart may help you find an area to buy back at. I know times are tough and if you guys need someone to talk to i'm here for yall.


TOTAL3: CRYPTO TOTAL MARKET CAP EXCLUDE BTC AND ETHTotal3 is falling to its targets
1: around 401B
2: 160B
NOTICE:
THIS IS NOT A FINANCIAL ADVICE


Total 3 Crypto Market CapOur opinion on the market cap of alt-coins:
Currently we are not seeing big volume in the crypto space, there are selective coins making higher highs but majority of the market is down in general.
On balance of probabilities, the total market should drop by 75% to regain the energy and interest required to start a new price discovery mode.
Our bias is short for the reasons given above, and we are working on trading plans to execute when time arrives.

Altcoins bottomed or expect another drop❓💎Today we will look at the TOTAL3 price action. TOTAL3 is a crypto market cap excluding the Bitcoin and Ethereum capitalization, which is providing the perspective for the Altcoin potential.
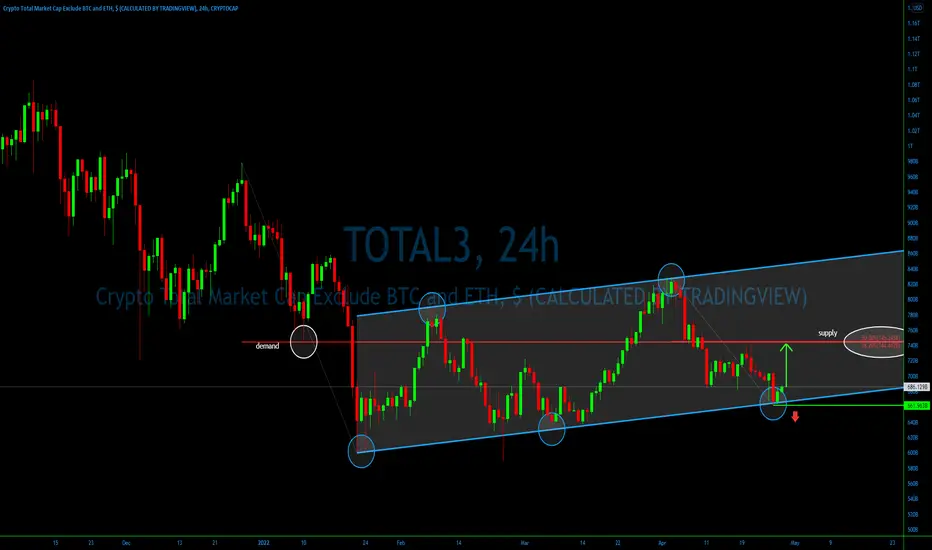
💎Back on February 24, TOTAL3 formed a double bottom at 600B, which is strong psychological support. Since then we can observe the price action within the ascending channel. Yesterday TOTAL3 tested and bounced off the bottom of the channel.
💎The low has been printed at 661B, and this might be critical .......
Alt Coin PartyMy idea is that we have a Altcoin party in front of us that has the potential to grow 100% for Altcoins !!! What do you think?!

PLain and SImple TOTAL 3 is the cryptomarket cap without BTC, ETH looks like a bullish divergence is forming and it looks like we will have one more retracement down as a liquidity pull before starting a new cycle

🔥 Altcoin Marketcap: Early Inverse Head & Shoulder PatternTOTAL3 is the total crypto marketcap minus BTC and ETH marketcaps, so we're looking at all altcoins here.
The alts are showing early signs of an inverse head & shoulders pattern, which is classically a bullish reversal pattern.
Overall, I think that BTC is still trading in a bear-flag formation until proven otherwise, so I'm not looking for an entry at this moment. See below for info:
However, if both BTC manage to break out on the bullish sides of their respective patterns we can deduce that they've confirmed their bullish reversal and that we might see more bullish price action in the coming months.
For now, keep an eye on the neck-line resistance. A bullish break out from there might signal further strength.
Happy trading!

TOTAL.3-4HAs you can see, there is a double bottom pattern is forming, 730B neckline must be broken and price must hang above it by closing 4H candles.
But I'm still not convinced that this is the rally that will take us to 50k, BTC is so weak and fragile. Still, I will trade it if neckline breaks.
NFA, DYOR.
