Why Altcoins Are Weak in This Bull Run?The crypto market is in a bull run, but something feels different this time. While Bitcoin and Ethereum are setting new highs, many altcoins are struggling to keep up. In previous cycles, altcoins often outperformed once Bitcoin found stability — but this round looks weaker. Here are a few reasons why altcoins are underperforming:
✅ Bitcoin Dominance Is Rising
Capital flows in crypto follow a cycle. Early bull phases usually start with Bitcoin, as institutions and large investors prefer its liquidity and reputation as a "safer" crypto asset. Bitcoin dominance has been climbing, signaling that capital is consolidating into BTC instead of spreading into smaller, riskier altcoins.
✅ Liquidity Is Thinner Across the Market
Unlike previous cycles, global liquidity conditions are tighter. With interest rates higher and risk appetite lower, speculative capital isn’t flooding into altcoins at the same pace. Most investors would rather deploy into BTC or ETH than gamble on small-cap tokens with uncertain narratives.
✅ Regulation & Exchange Listings Matter More
This cycle is also shaped by increased regulatory scrutiny. Many altcoins face delisting risks or uncertainty around whether they qualify as securities. This discourages both retail and institutional investors from rotating heavily into alts.
✅ Narratives Are Narrower
In past cycles, new sectors (DeFi in 2020, Metaverse in 2021) created explosive altcoin rallies. This time, the strongest narratives are Bitcoin ETFs and Ethereum staking. Without a fresh, sector-wide altcoin narrative, capital rotation is limited to a few selective themes like AI coins or Real-World Assets (RWA), rather than lifting the entire alt market.
✅ Market Maturity & Survivorship Bias
The crypto market has matured. Many speculative altcoins from past cycles have faded or collapsed. Survivors now trade more in line with fundamentals and adoption, meaning the era of every token pumping in unison is over.
Conclusion
Altcoins are weaker in this bull run because the cycle is more institutional, more selective, and more Bitcoin-focused. That doesn’t mean altcoins won’t have their moment, but traders should be more careful this time. Instead of chasing every low-cap token, focus on strong narratives, liquidity, and projects with real adoption.
Altseason may come, but it won’t look like the ones of the past.
Cheers
Hexa
BINANCE:BTCUSDT BINANCE:ETHUSDT CRYPTOCAP:BTC CRYPTOCAP:ETH CRYPTOCAP:XRP CRYPTOCAP:BNB
TOTAL3ES trade ideas
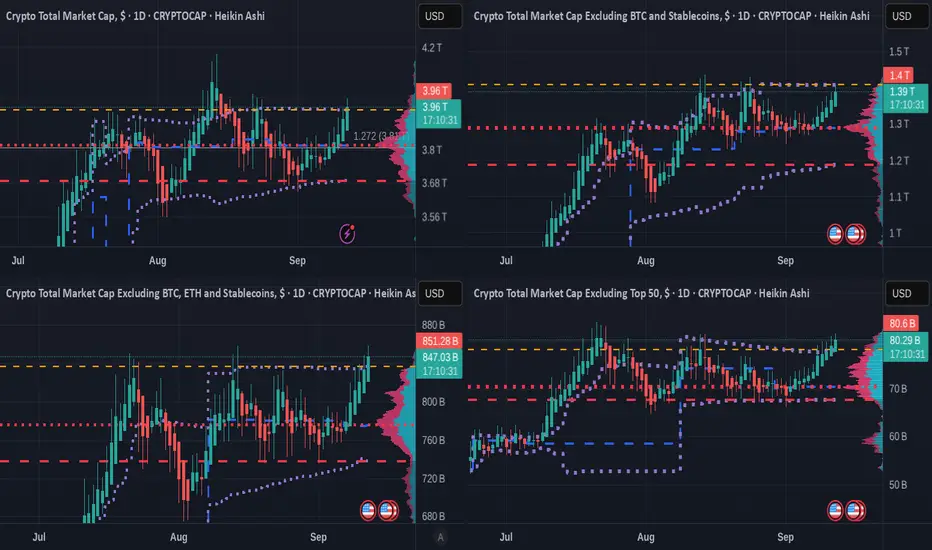
4 x TOTAL Crypto charts showing ALT Season has MomentumTop line - TOTAL Crypto Market Cap - TOTAL 2 (Excluding BTC )
Bottom Line - TOTAL 3 ( Excluding BTC & ETH ) - OTHERS ( Top 125 coins minus Top 50 by market cap )
TOTAL 3 is ALL ALT coins
OTHERS is Mid to Lower Cap ALT coins
These 4 Charts use the VRVP
he Volume Profile Visible Range (VPVR), is a technical analysis indicator on TradingView that displays the distribution of trading volume at different price levels within the currently visible range of a chart.
The Colour Key is below
Value Area High ( VAH ) - Orange Dashed Line
Value Area Low ( VAL ) - Red Dashed line
Point of Control ( POC ) - Red Dotted line
Developing POC - Blue Dashed line
Developing Value Area - Purple Dotted line
These lines can be seen as lines of support / Resistance.
The 2 Upper charts, we see that PA is being held back on the VAH line.
The 2 Lower charts show us that PA has Broken ABOVE the VAH line.
This shows us more Volume of training is happening on the lower Cap ALTS than the higher cap
It is as simple as that
But we should look at the BTC/Dominance chart
BTC.D is on Support and it has produced bounces in the past
We also see on the 2nd chart how we should have already have had the ALT season...so..It maybe short lived. But the dynamics of the market have changed......
So there we have it, The TOTAL charts for ALTS shows us that ALTS are breaking out but this could be Fragile but by no means does it mean they will crash right away.
But be careful, we are in uncharted territory.
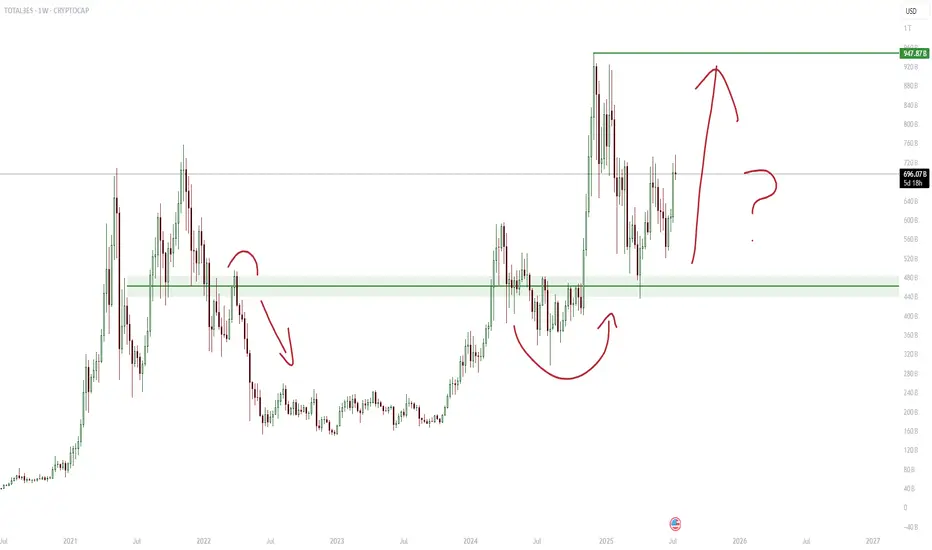
TOTAL3ES (Excluding BTC/ETH/stables) is coiled up."History doesn't repeat itself, but it often rhymes"
$1T is the line in the sand - reclaim & retest and the runway opens.
DXY rolling over (see previous post) = perfect fuel.
Alt season & beyond may almost be here.
ETH Season is confirmed. ALT Season? Not quite yet.Been travelling to gaze at the moon and somehow saw the future.
Firstly, we just experienced ETH season. Tom Lee, the high priest of Crypto, has spoken.
"ETH treasuries are a sovereign put." - Tom Lee, 2025.
In fact, ETH treasuries will drive the next 10 years of cybernetic transformation. Just watch.
Wen moon? Very soon indeed. When ETH season ends, money will flow into all our favorite DINO coins. XRP, XLM, ADA, LINK, TRON, BNB, DOGE, SOL. Honestly, not my favorite coins this season, but dinos are dinos. Pick 1 and enjoy the ride.
No love for SOL, but expect your eyeballs to melt as projects like PENGU takes over the world. PENGU = $0.8 is the secular target.
MEME dominance will drive everyone crazy - but that's just the first step. It'll precede the final, jaw-dropping moment as we experience the F word.
Yes, you heard it right, the Flippening - in 2026, in February. But be warned - the flippening is an exit ticket while BTC goes below 100k for its final time.

Recent Dip & What It Means for the Trojan Cycle: Fact Check1. Stablecoin Capital Flow — Not a Typical Sell-Off
On August 14–15 , Binance saw $1.82 billion in net stablecoin inflows, one of the highest recent figures.
Simultaneously, Tether and Circle minted a combined $9.5 billion in stablecoins over the past 30 days , signaling significant on-ramp activity.
These patterns contradict what we'd expect in a pure capitulation. Instead, they suggest capital is being positioned to buy into dips , not exit markets—hallmarks of the positioning-reset phase in the Trojan Cycle.
2. Institutional Accumulation Aligns with Thesis
Spot Ether ETFs just recorded over $1 billion in net inflows in one day (led by BlackRock’s ETHA and Fidelity’s FETH), bringing total ETF inflows to $10.8 billion.
Two whales accumulated $150 million in ETH , reinforcing institutional interest at these levels.
This indicates institutional players are using the dip as an opportunity to accumulate—consistent with the Trojan framework's “Trojan vehicles” mechanics.
3. Market Structural Trends Support Rotation Setup
Ethereum price dipped ~3% , suggesting short-term weakness but providing a potential entry zone.
Network activity remains robust: ETH daily on-chain transactions recently neared all-time highs at ~1.87 million , driven primarily by stablecoin transfers .
Strong on-chain activity alongside stablecoin flow indicates capital preparation for a rotation phase, rather than a breakdown.
Trojan Cycle Thesis — Data Review
Aspect --> What Trojan Cycle Predicts --> What Data Shows
Stablecoin Inflows --> Increases ahead of rotation --> Binance saw $1.82B in inflows; $9.5B minted overall
Institutional Buying --> Accumulation during dips --> $1B+ ETF inflows; $150M ETH whales buying
Network Activity --> Pre-rotation buildup --> High ETH txn volume, stablecoin activity peaking
Conclusion: All three key indicators align with the Trojan Cycle model. This dip appears to be a positioning flush, not the start of a structural downturn.
The Trojan Cycle: A New Framework for Altseasons & Liquidity🧭 A Thesis for a New Crypto Cycle
This post proposes a new lens for understanding crypto’s macro structure in the institutional era—rooted in two frameworks: The Trojan Cycle and Synthetic Rotation .
It challenges the legacy “ M2 = liquidity, BTC = lead, alts = profit ” model, proposing a more engineered and asymmetric structure shaped by capital rails, narrative timing, and retail dynamics.
📖 Key Concepts
🔹 Trojan Cycle
A macro capital flow model where:
• BTC still triggers narrative momentum—but no longer drives liquidity alone
• Institutional capital enters via regulated wrappers like ETFs and through equities with crypto treasuries (e.g., MSTR, miners, COIN)
• Stablecoins replace M2 as real-time liquidity proxies
• Retail unknowingly front-runs these flows
🛠 Trojan access isn’t just through ETFs—it includes public stocks holding crypto on balance sheets. These Trojan equities serve as indirect exposure rails that institutions use stealthily.
🔹 Synthetic Rotation
Altseasons today are not spontaneous BTC profit spillovers. They are:
• Platform-driven
• Narrative-coordinated
• Liquidity-engineered
• Retail-targeted—by design, not coincidence
🛠 Media, influencers, and platform incentives synchronize narrative deployment to align with capital rotation windows, driving retail engagement at peak distribution phases.
🔹 ETH as a Structural Fulcrum
Ethereum isn’t just a top asset—it’s the bridge:
• Serves as a midpoint for capital between BTC and high-beta alts
• TOTAL3ES/ETH ratio reveals directional bias in rotation structure
🛠 ETH is a liquidity buffer and rotational fulcrum—not just a layer-1 narrative asset.
🔹 Structural Liquidity Fragmentation
Institutional and retail flows now move on different rails, timelines, and tools:
• Retail is incentivized through volatility and engagement
• Institutions scale in/out passively, through wrappers and proxies
🛠 These cycles don’t just desync by chance—they’re structurally misaligned. This is why retail often exits late and enters at narrative highs.
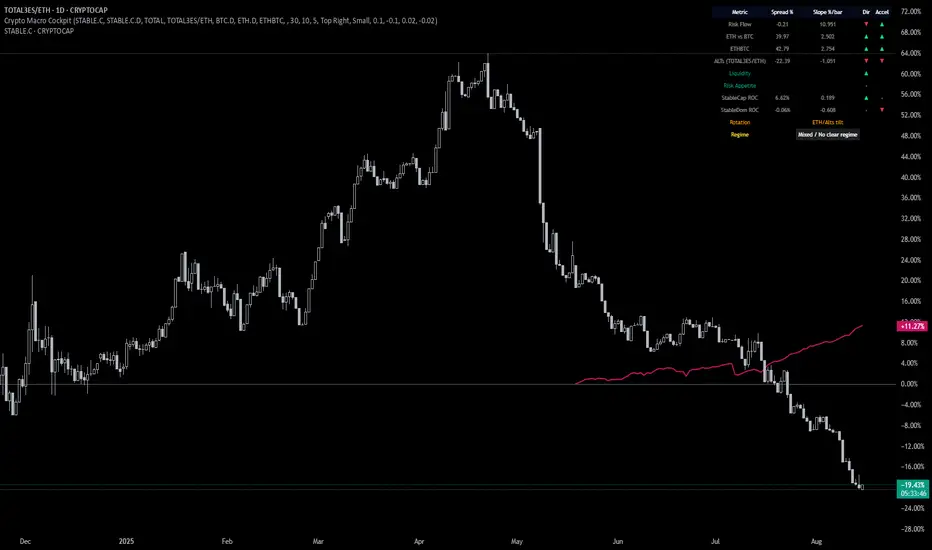
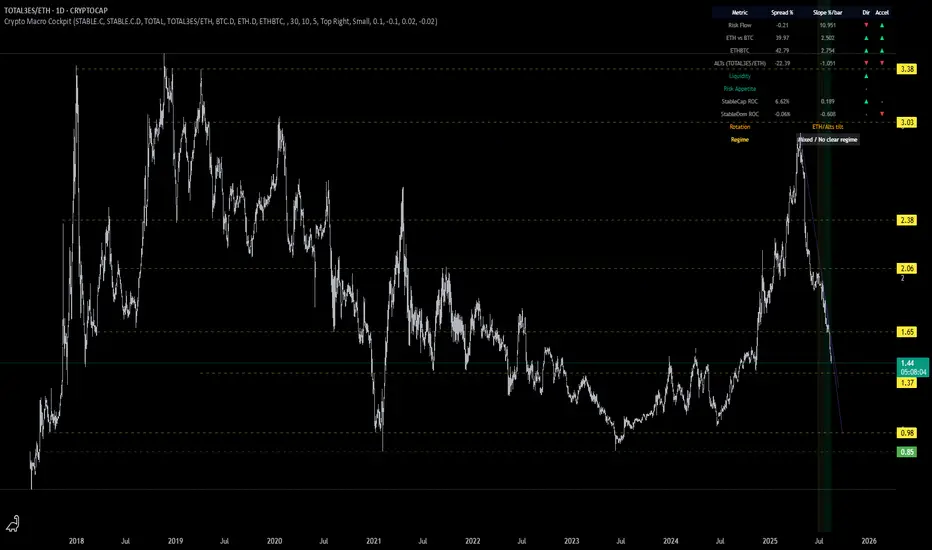
📊 Visual Framework
Using the Crypto Macro Cockpit script:
• Spread and slope = flow direction and acceleration
• Stablecoin cap = capital injection
• Stablecoin dominance = risk appetite
• TOTAL3ES/ETH = alt rotation pressure
• Composite regime classification = macro posture (Risk-ON/OFF, Caution, Waiting)
📎 Why It Matters
Understanding engineered cycles vs organic flows is key to staying ahead.
Legacy cycle models no longer apply.
New frameworks are needed to decode capital movement, timing asymmetries, and narrative deployment.
💬 This isn’t a prediction—it’s a proposed mental model for discussion.
Would love to hear your thoughts—how are you navigating the new cycle?
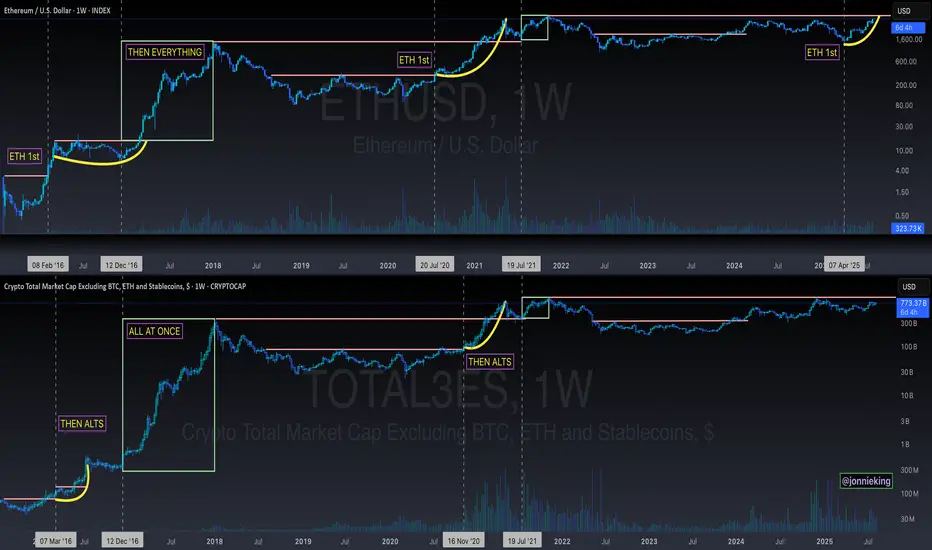
ETH > Alt Season Historical LookTHE STAGES OF ALT SEASON
ETH > Alts > market collectively corrects > Everything All Together
Alts are gonna absolutely rip your face off once ETH convincingly breaks its ATH.
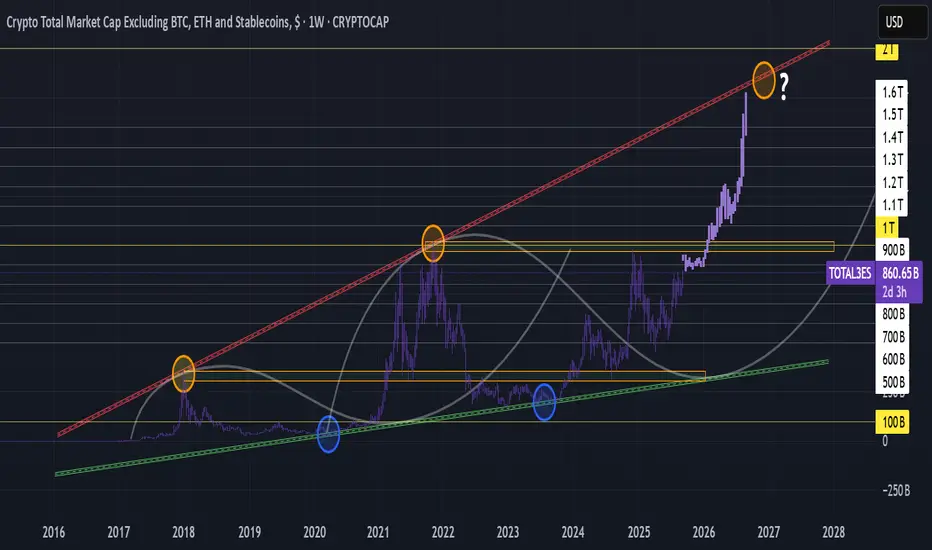
Altcoin MarketCap - Consolidating Before the Ride!On the chart you can see a Pure Capitazation of Altcoins - Crypto Market Cap Excluding Bitcoin, Ethereum and ALL Stablecoins.
There was formed a very clear model that has all chances of repeating once again:
First goes a strong ascending movement from 0 to a bit higher than 0.618 Fibo lvls.
Then there is a correction inside the descending channel/bull flag down to ~0.382 with one long shadow below that sets a 0 point for a new cycle.
Breakout of a bull flag follows after.
Final stage before the growth is consolidation in the range of 0.382 and 0.5 levels by Fibo.
Pump.
We are currently at the 4th stage , as you might have guessed. The consolidation can still take some time, up to a couple of months, since there are no specific time restrictions that invalidate the model.
However, this doesn't cancel the fact that the target is 1 by Fibo, namely $1.7T MarketCap of Altcoins, which is x2 from current points . I tend to believe holders deserve such a run.
