Monetary Liquidity: the Russell 2000 on the Front LineThe Russell 2000 is a U.S. stock market index that includes approximately 2,000 small-cap companies listed in the United States. Unlike the S&P 500 or the Nasdaq, which are largely dominated by large multinational corporations with significant international exposure, the Russell 2000 primarily refle

Russell at key supportSanta rally to start soon? Well, maybe. We have now had both the Fed and NFP out of the way, and not much else left except CPI report and a few CB meetings elsewhere. Among the major indices to watch is the Russell which is sitting at key inflection point here around 2520 area, marking prior resista

US2000 Momentum Rebuilds After Triangular MA Retest🚀 US2000 Bullish Setup – Triangular MA Pullback Play (Layered Entry Blueprint) 🚀
✨ Asset: US2000 – Small-Cap U.S. Index
📅 Trade Style: Day / Swing
🎯 Bias: Bullish Continuation confirmed through Triangular Moving Average Pullback
📌 Trade Plan – Clean & Clear
📈 Bullish Structure Confirmed
The price

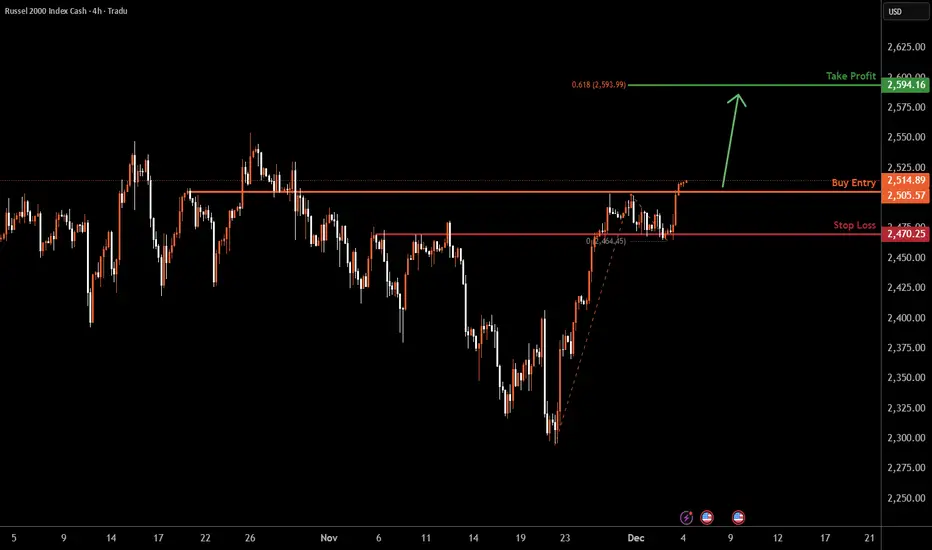
US2000 H4 | Bullish Momentum To ExtendMomentum: Bullish
Price has reacted well off the buy-entry level, which also aligns with an overlap support level.
Buy Entry: 2,513.55
Overlap support
Stop Loss: 2,470.25
Overlap support
Take Profit: 2,594.16
61.8% Fibonacci projection
High Risk Investment Warning
Stratos Markets Limited (trad
US2000 ATH idea Q1-early Q2 2026I applied the fractal from the last cycle when FX:US2000 put the peak, look how it repeats the structure with a false breakdown exactly like in 21 and what synchronization on the corrections in the current cycle.
if we look at the fractal, we can assume that ath will be put in the range of 3000-3


Can the Russell 2000 Lead the Next Bull Wave Above Resistance?📊 RUSSELL 2000: The Ultimate Small-Cap Breakout Blueprint 🚀💰
🎯 Market Overview: IWM Russell 2000 Index Analysis
The Russell 2000 (RUT/IWM) is setting up for what could be a chef's kiss momentum play! 🧑🍳✨ We're tracking a bullish continuation setup backed by triangular moving average confluence and

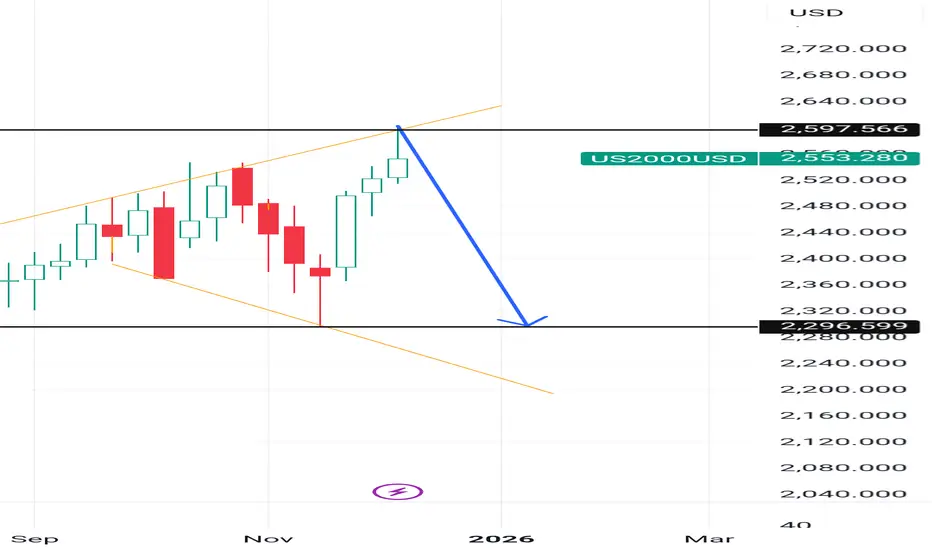
Russell 2000: Massive Breakout or Brutal Rejection?1) Technical Analysis
The Russell 2000 (RUT) has reached a major multi-year resistance zone at 2450–2550 — a level that rejected price repeatedly since 2021.
Key observations:
• A massive long-term Cup Pattern is visible, and the price is now at the top of the cup.
• Initial rejection is visibl

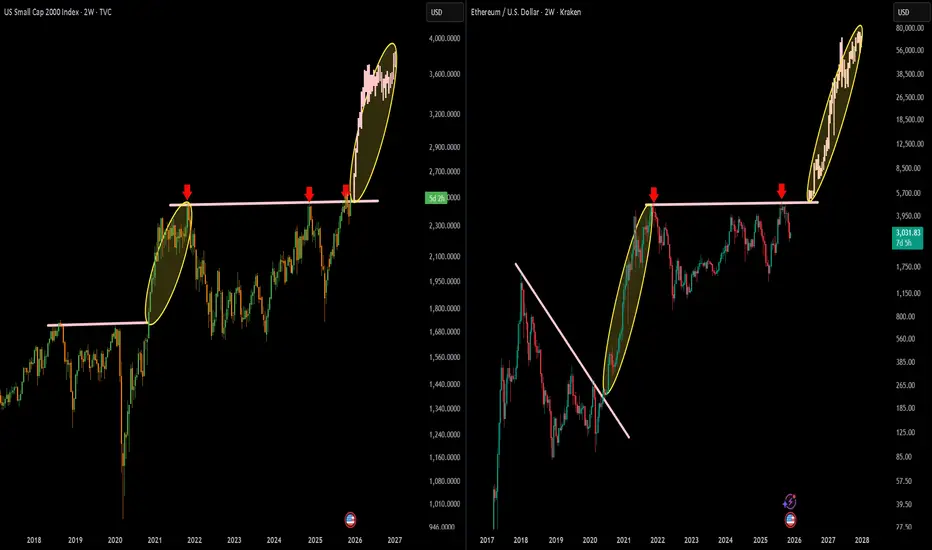
US Small Caps (Russell 2000) Vs Ethereum (ETH) CHART ANALYSIS & BIAS
I am comparing US Small Caps (Russell 2000) on the left with Ethereum (ETH) on the right.
Both charts show identical structural behavior:
A long multi-year accumulation / resistance zone
A clean breakout
A vertical markup phase immediately after reclaiming the key level
S
See all ideas
Displays a symbol's value movements over previous years to identify recurring trends.
Frequently Asked Questions
US 2000 reached its highest quote on Dec 12, 2025 — 2,603.40 USD. See more data on the US 2000 chart.
The lowest ever quote of US 2000 is 955.90 USD. It was reached on Mar 19, 2020. See more data on the US 2000 chart.
US 2000 is just a number that lets you track performance of the instruments comprising the index, so you can't invest in it directly. But you can buy US 2000 futures or funds or invest in its components.