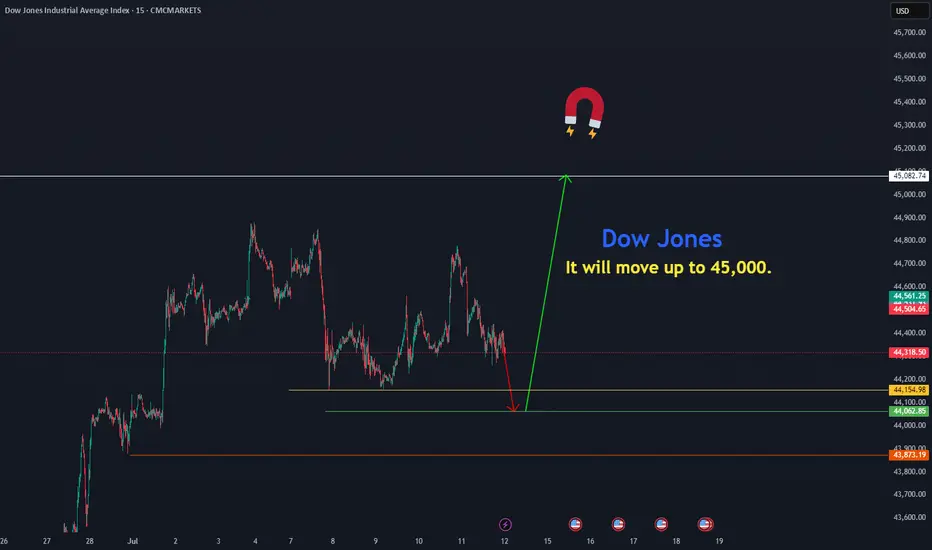
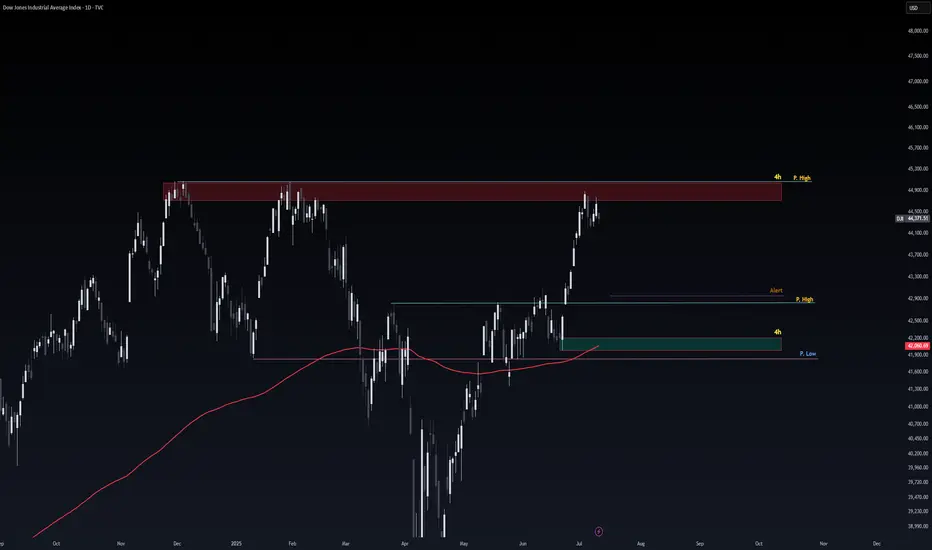
Dow Jones move upThe Dow Jones is resuming its rally toward 45,082 from the price zones of 44,154.97 and 44,000.
CMCMARKETS:US30
US30 trade ideas
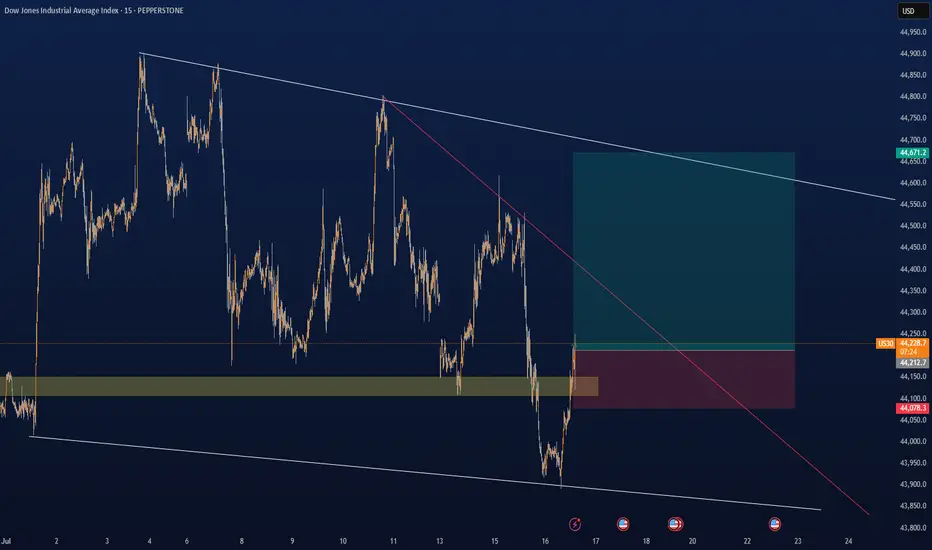
US30US30 needs some more correction, this week will be up and down both moves.
Disclosure: We are part of Trade Nation's Influencer program and receive a monthly fee for using their TradingView charts in our analysis.
Safe Entry DJIObvious Movement I Guess.
P.High(Previous High) Act As good Support for price to Respect.
Note: 1- Potentional of Strong Buying Zone:
We have two scenarios must happen at The Mentioned Zone:
Scenarios One: strong buying volume with reversal Candle.
Scenarios Two: Fake Break-Out of The Buying Zone.
Both indicate buyers stepping in strongly. NEVER Join in unless one showed up.
2- How to Buy Stock (safe way):
On 1H TF when Marubozu/Doji Candle show up which indicate strong buyers stepping-in.
Buy on 0.5 Fibo Level of the Marubozu/Doji Candle, because price will always and always re-test the

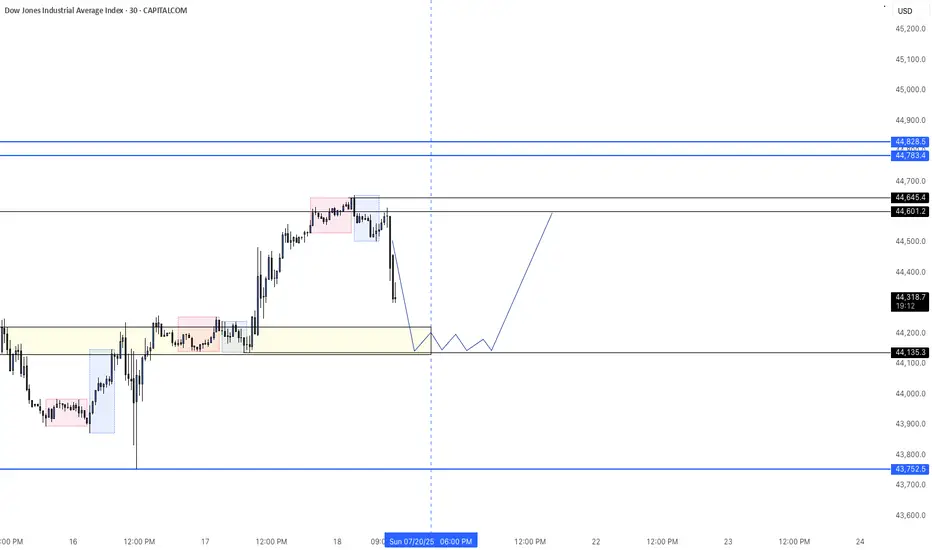
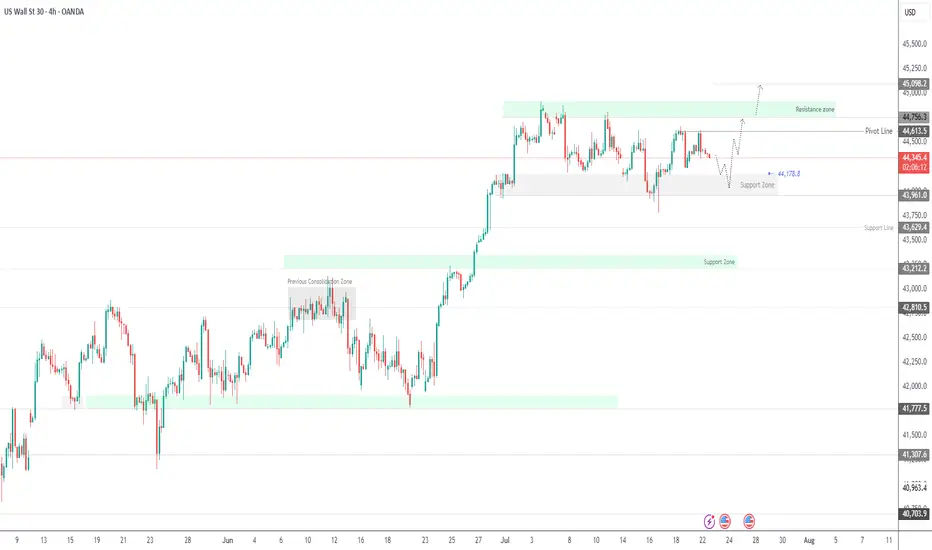
Dow Set for Volatile Move as Earnings, Tariff Risks CollideUS30 OVERVIEW
The price is currently consolidating between 44,180 and 44,620, awaiting a catalyst. Today’s earnings reports are expected to heavily influence Dow Jones price action.
If earnings come in strong, the index is likely to push toward 44,620 and 44,760. A confirmed stability above 44,620 would strengthen the bullish case, potentially opening the path toward a new all-time high near 45,100.
However, a break below 44,180 would signal bearish momentum, with potential downside toward 43,960. Additional pressure could come from escalating tariff tensions, further weakening sentiment.
Resistance: 44,620 · 44,760 · 45,100
Support: 44,180 · 43,960 · 43,630
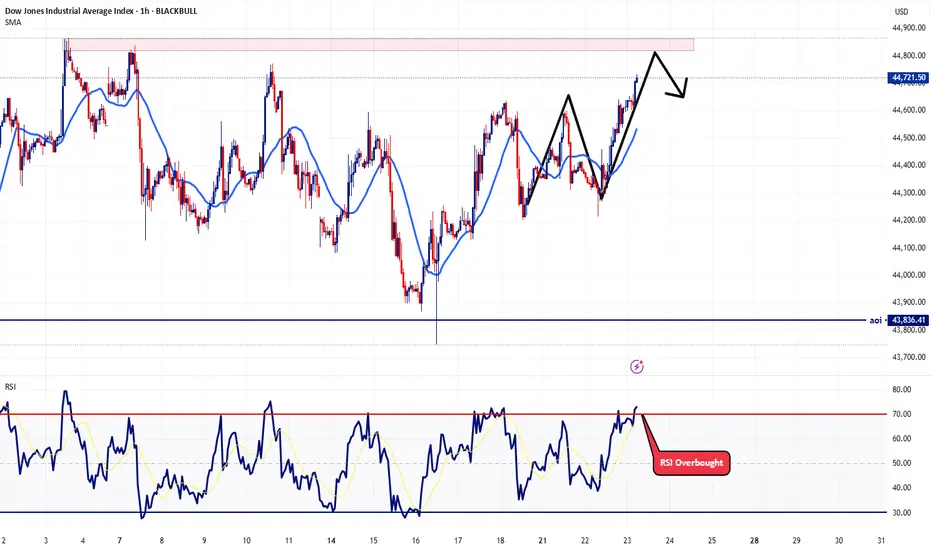
US30 - What I believe will happen todayConsidering today is now Wednesday and Wednesday's have a consistency of being one of those off days. Primarily because usually there are Fed speeches on this day that manipulate the market. With that said, I'm expecting price action to play out how I plotted the arrows on the chart. I believe there is still some further upside for today but then I believe we might get that intraday correction around 11:am - noon EST.
Let's see how today plays out. Trade safe
US30 US30 maintains a bullish outlook, supported by improving economic data, rotation into industrials and value stocks, and resilient corporate earnings. As long as price holds above key support levels, the broader uptrend remains intact.
Do you agree with a big profit in US30?
Hello friend
Do you think the orange line will break?
What if it breaks?
Just wait and collect the money.
If you liked my analysis, please support me by liking, commenting and subscribing. Thanks friend

US30 continues to exhibit bullish momentumThe US30 index continues to exhibit bullish momentum, driven by strong earnings reports and robust U.S. economic data. The key support zone around 44,300 has held firm, reinforcing confidence among buyers.
As long as the price remains above 44,300, the uptrend is expected to persist Upside target: 45,000 remains in focus. a focus on the 1H Candle close above 44,000 we could expect price could push more upside.
You may find more details in the chart Trade wisely best of luck buddies
Ps: Support with like and comments for better analysis Thanks for Supporting.


US30: The Market Is Looking Down! Short!
My dear friends,
Today we will analyse US30 together☺️
The recent price action suggests a shift in mid-term momentum. A break below the current local range around 44,306.1 will confirm the new direction downwards with the target being the next key level of 44,263.8..and a reconvened placement of a stop-loss beyond the range.
❤️Sending you lots of Love and Hugs❤️

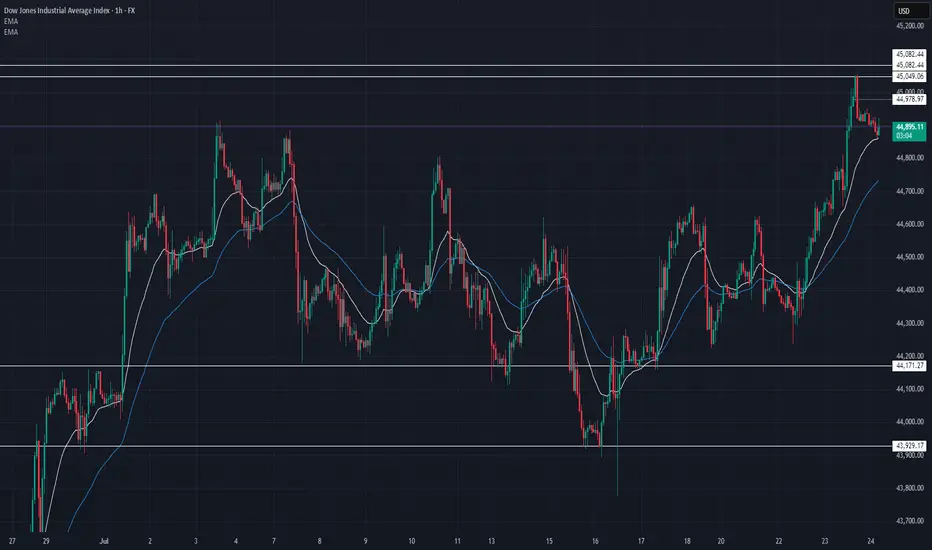
US30 Technical Breakdown – 07/24/2025📍 US30 Technical Breakdown – 07/24/2025
🔥 New highs achieved — bulls pushed straight through the 44,867 ceiling and tagged 45,082 before pulling back slightly. This is a key psychological level, and price is now consolidating just below.
We’ve officially shifted into breakout territory. Momentum is strong, and EMAs are fully bullish. But after such a run, we may be due for a retest or short-term correction. Let’s break it down 👇
📊 Current Market Structure:
✅ Series of higher highs & higher lows
✅ EMA 9 > EMA 21 > Price (bullish structure)
✅ Breakout from range: 44,867 → 45,082
🧱 Minor resistance at 45,050–45,082
⚠️ Watch for pullback to 44,750–44,800 zone
🔑 Key Levels:
🔼 Resistance:
45,050 → 45,082 (fresh supply zone)
45,200+ (blue sky if broken)
🔽 Support:
44,867 (former resistance turned support)
44,734 (EMA confluence)
44,450–44,600 (demand zone)
🧠 Market Bias:
📈 Still bullish, but extended.
Above 44,867 = continuation zone
Below 44,734 = momentum shift likely
Rejection at 45,082 could give scalpers a play short 🔄
💡 Potential Trade Setups:
📈 Breakout Buy (Momentum Entry):
Entry: Above 45,100
TP1: 45,200
TP2: 45,300
SL: Below 45,040
US30 | Inverted Hammer at Key Supply Zone – Reversal or BreakoutUS30 just printed an inverted hammer on the 4H at a major supply zone (44,550–44,600). This is a critical decision point:
✅ Bearish Case:
If price rejects and closes back below 44,530, sellers could take control with targets at 44,380 → 44,180 → 44,020.
✅ Bullish Fakeout:
If price breaks and holds above 44,620, expect a push toward 44,700 and 44,900.
📌 What I’m Watching:
Rejection candle + bearish close → short entries.
Strong breakout candle with retest → long continuation.
Key Levels:
🔴 Resistance: 44,550–44,600
🟢 Support: 44,380 → 44,020
⚠️ Manage risk carefully. Volatility is high and liquidity hunts are common in this zone.
💬 Do you think we reject here or break out higher? Drop your thoughts below!
#US30 #DowJones #PriceAction #SmartMoney #TradingView #TechnicalAnalysis #IndicesTrading
Buy
Rejection Level
Daily Volume
Market Structure Shift
London Session
Trend Line Break
Untapped Order Point
US30Recent COT data shows rising net short positions on U.S. equity indices, reflecting bearish sentiment from institutional traders toward the Dow (US30). This indicates growing caution or expectations of downside pressure.

NQ thread: Short ideaMonday started off bullish, but only to drop at the end of the session.
Here is a thread on what is happening and on which narratives I view the market
Starting off with the 4H Time frame, we witnessed NQ and ES taking last weeks high.
YM did not.
This is the first stage of the movement. To find the second stage, we need to dive deeper into the lower timeframes..
Litty Like US30!!I'm purely going off the Week chart. 4hr MSS+ 4hr BPR gives me reasons to buy price. I'm targeting the Equal Highs on the Weekly chart.

US30 - Pattern & SMA PerspectiveDear Friends in Trading,
How I see it,
Pattern suggests there is room for more upside action.
1) SMA's are weaving - tight state - accumulation
2) As long as price respects the pattern a bullish breakout is likely.
Keynote:
A very healthy bull trend full of liquidity lies beneath this holding pattern
An unforeseen fundamental catalyst may force a correction at any time
I sincerely hope my point of view offers a valued insight.
Thank you for taking the time study my analysis.

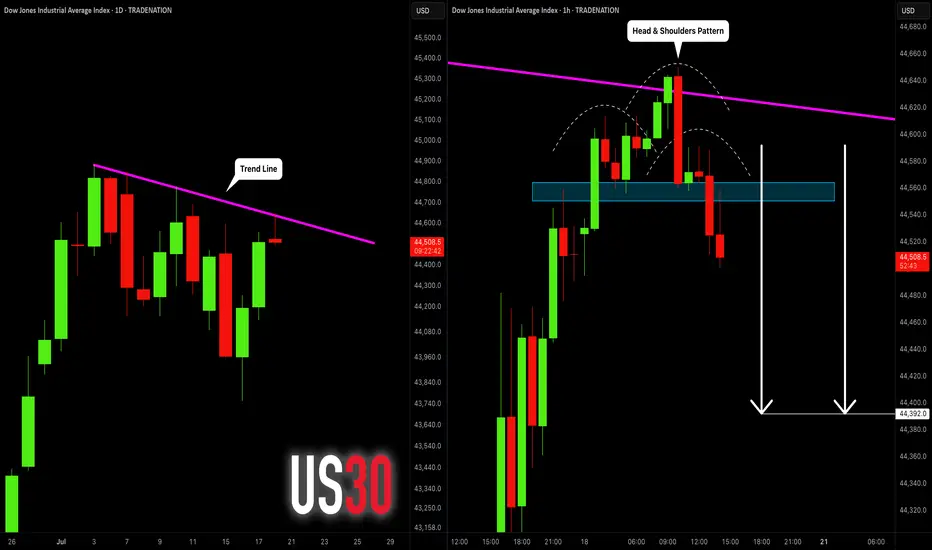
DOW JONES INDEX (US30): Bearish Move From Trend Line
I see a test of a strong trend line on US30.
The price formed a head & shoulders pattern on that
and a breakout of its neckline on an hourly time frame.
I expect a retracement to 48390
❤️Please, support my work with like, thank you!❤️
I am part of Trade Nation's Influencer program and receive a monthly fee for using their TradingView charts in my analysis.
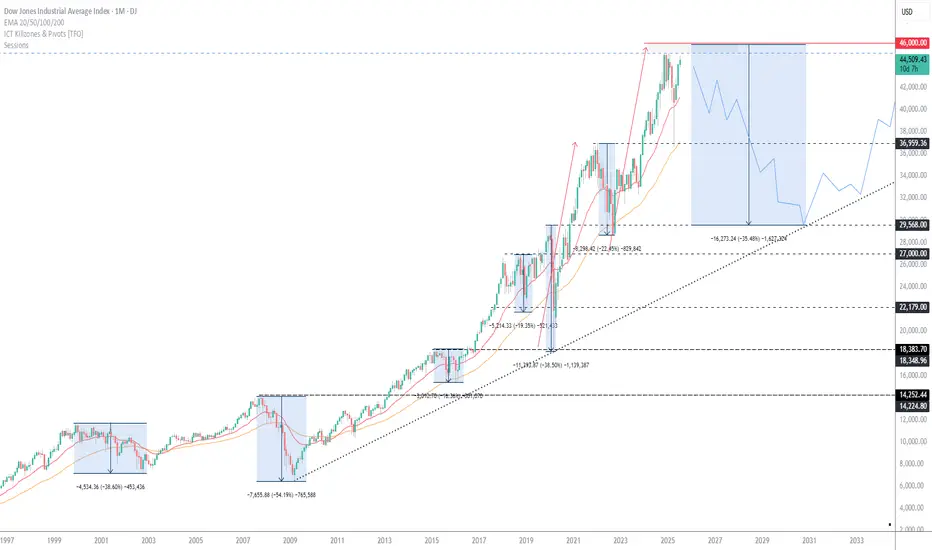
Dow Jones -> A breakout rally of +40%!🐂Dow Jones ( TVC:DJI ) will create new highs:
🔎Analysis summary:
Since the April lows, the Dow Jones already rallied about +25%. This was simply the expected rejection away from a strong confluence of support. Now, the Dow Jones is sitting at the previous all time highs and about to break out, leading to a massive rally.
📝Levels to watch:
$45.000, $60.000
🙏🏻#LONGTERMVISION
Philip - Swing Trader

US30 - LONGBearish Friday after price hit a key level high. Price will continue to the downside the remainder of today. Expecting a jump back to today's highs come Monday morning.