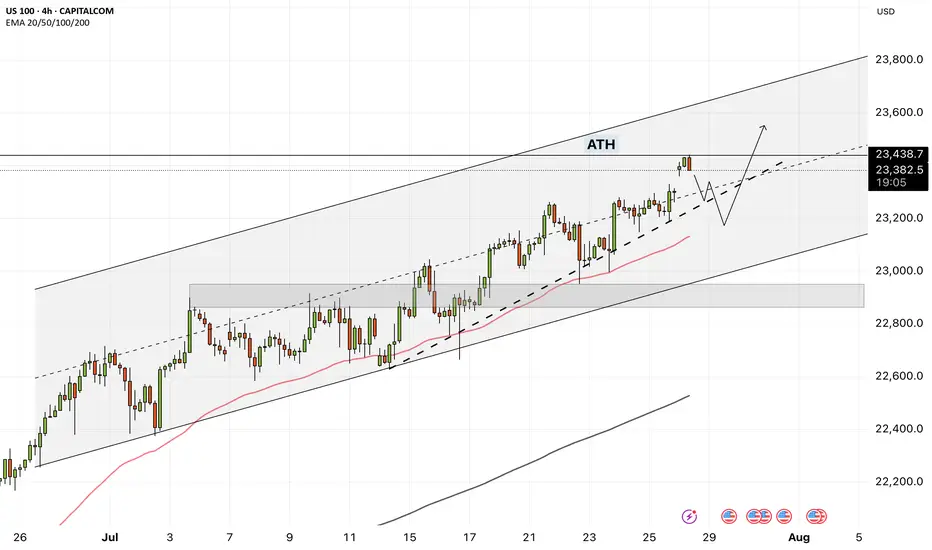
NAS100 - How will the stock market react to the FOMC meeting?!The index is trading above the EMA200 and EMA50 on the four-hour timeframe and is trading in its ascending channel. The target for this move will be the ceiling of the channel, but if it corrects towards the indicated support area, you can buy Nasdaq with better reward-risk.
As signs of easing global trade tensions begin to emerge, the Federal Open Market Committee (FOMC) is scheduled to meet this week. Analysts widely expect the Fed to hold interest rates steady for a fifth consecutive time. This anticipated decision comes as the U.S. President continues to push for rate cuts, persistently pressuring the Fed to adopt a more accommodative monetary stance.
So far, the Federal Reserve has kept its benchmark rate within a range of 4.25% to 4.5%. While some officials project two cuts by the end of the year, markets are waiting for the Fed’s patience to run out. According to the CME Group’s FedWatch tool, investors have priced in a 62% chance of a rate cut in the September meeting. By then, the Fed will have access to the July and August employment reports—key indicators of whether the labor market is weakening or remains resilient.
The upcoming week marks the peak of Q2 earnings season, with 37% of S&P 500 companies reporting results, including four major tech firms. In parallel, the August 1st tariff deadline for the EU and other countries is approaching, while legal challenges over existing tariffs remain ongoing.
According to a report by The Wall Street Journal, many large U.S. corporations have so far absorbed the bulk of tariff-related costs without passing them on to consumers. This strategy aims to maintain market share and avoid drawing criticism from President Trump. However, the question remains—how long can this continue?
Examples from the report include:
• General Motors paid over $1 billion in tariffs in Q2 alone without announcing any price hikes.
• Nike expects a $1 billion hit from tariffs this fiscal year and is planning price increases.
• Hasbro is working on a combination of price hikes and cost cuts to offset $60 million in tariff impacts.
• Walmart has made slight pricing adjustments (e.g., bananas rising from $0.50 to $0.54) and managed pressure through inventory reductions.
This week is shaping up to be one of the busiest on the economic calendar in recent months. A flood of key data on growth, inflation, and employment, alongside three major interest rate decisions, has markets on high alert.
On Tuesday, attention will turn to two significant reports: the Job Openings and Labor Turnover Survey (JOLTS) and the U.S. Consumer Confidence Index for July. These metrics will offer a clearer view of labor market dynamics and household sentiment heading into critical monetary policy decisions.
The most anticipated day is Wednesday. That day brings the ADP private payrolls report, the first estimate of Q2 GDP, and pending home sales data. Additionally, both the Bank of Canada and the Federal Reserve will announce rate decisions—events with the potential to simultaneously steer global market trajectories.
On Thursday, the July Personal Consumption Expenditures (PCE) price index will be released—a key inflation gauge closely monitored by the Fed. Weekly jobless claims data will also be published that day.
The week concludes Friday with two heavyweight economic indicators: July’s Non-Farm Payrolls (NFP) report, a crucial input for Fed policy decisions, and the ISM Manufacturing PMI, which offers insights into the health of the real economy.
Some economists argue that a September rate cut may be premature, and even suggest that no rate changes might occur in 2025. Analysts expect Fed Chair Jerome Powell to reiterate a data-dependent stance, consistent with previous meetings.
Still, beyond political dynamics, the July meeting holds independent significance.The Fed’s internal policy tone is gradually leaning more dovish, and subtle signals of this shift may emerge in the final statement. Given that only one meeting remains before September, if policymakers are leaning toward a rate cut then, it’s critical that the groundwork for such communication be laid now.
NAS100 trade ideas
US100 Bullish Momentum Targets AheadThe US100 shows strong bullish structure after completing an ABCD correction, with price eyeing a potential move towards the 1st target at 23,791 and possibly the 2nd target at 24,053. A brief pullback may precede the continuation towards these key resistance levels.
1. Current Structure
The chart follows an ABCD pattern after a strong bullish impulse from the early August lows.
Points A–B–C–D suggest a completed correction phase, with momentum now shifting upward.
Price is currently around 23,629, approaching the first resistance zone.
2. Key Levels
Immediate Support: ~23,500 (recent swing low, short-term demand zone)
1st Target: 23,791 (minor resistance, potential profit-taking zone)
2nd Target: 24,053 (major resistance, psychological round area)
Major Support: 23,200 (break below here could invalidate bullish momentum)
3. Price Action Expectation
Short term:
A small pullback toward 23,500–23,550 is possible before continuing upward (healthy retracement to build buying pressure).

Deep Bearish Bat - NAS100 - Big drop incoming? Deep bearish BAT pattern completion possible and potential for the nice risk reward setup.
Protective stop at 23,840
Downside objectives >
23,230
22,965
22,691
Visit my free educational platform for traders >
www.traderdream.com

USNAS100 | Consolidation Before CPI –Breakout or Pullback Ahead?USNAS100 Overview
The index reached its all-time high ahead of recent speculation about a potential Fed rate cut. This week’s CPI data will be a key driver, indicating whether the Fed may cut rates in the near term.
Technical Outlook:
As long as the price trades below 23640–23690, a decline toward 23530–23435 is expected. A break below this zone could extend the drop toward 23295.
A 1H close above 23695 would turn the outlook bullish, targeting 23870.
Support: 23535, 23435, 23295
Resistance: 23870, 24040
previous idea:

NAS100 Bearish Correction/Third touch of Support trendlineA correction to the downside and a third touch of the trendline will provide more opportunities to go long. However, confirmations to short are looking strong right now.

NAS100 Trend following tradeNas100 has been on a bullish run and already had a trade running which is already trailing. looking to add a new position after that engulfing on 1hour candle.

NAS100 - Stock market awaits an important week!The index is above the EMA200 and EMA50 on the four-hour timeframe and is trading in its ascending channel. If the index corrects downwards towards the drawn trend line or the specified demand zone, you can buy Nasdaq with better reward for risk.
Many Federal Reserve officials believe that tariffs could weaken the U.S. economy and push inflation higher—a dilemma that forces policymakers to choose between cutting interest rates to support growth or keeping them unchanged to control prices.
However, Miran—the economic adviser President Donald Trump intends to nominate to the Fed’s Board of Governors—rejects this view. He argues that tariffs will ultimately benefit the economy and will not significantly impact prices, allowing the Fed to resume the rate-cutting cycle it halted earlier this year.
The key question now is whether Miran’s arguments will be persuasive enough to sway the broader thinking of the central bank’s policy committee, or whether concerns over labor market weakness might prompt rate cuts regardless, rendering his arguments unnecessary.
According to analysis from The Wall Street Journal, beyond the policy disagreements, Miran has also challenged the institutional legitimacy of the Federal Reserve. He has accused Fed officials of having political motivations and criticized them for what he calls the “tariff disruption syndrome.” In a paper published last year, he argued that all senior Fed officials should be subject to dismissal at the White House’s discretion. If appointed, he would give Trump a loyal ally inside the Fed’s boardroom—someone capable of promoting the president’s views and challenging the institution’s consensus-driven culture and influential research staff.
Meanwhile, JPMorgan has revised its monetary policy forecast for 2025, now expecting the Fed to deliver three 25-basis-point rate cuts starting in September 2025, compared to its earlier projection of just one cut in December.
Miran, who holds a Ph.D. in economics from Harvard University, currently serves as Chairman of the White House Council of Economic Advisers. On Thursday, Trump announced his intention to nominate him for a newly vacant Fed board seat. This position became available unexpectedly after Adriana Kugler’s resignation last week and will expire in January. Trump also revealed plans to nominate another individual to fill this seat, who could potentially replace Jerome Powell as Fed Chair in the spring. Miran’s appointment would give Trump additional time to evaluate how candidates—whether Miran himself or Christopher Waller, whom he appointed during his first term—align with his policy views and vote on interest rates.
This week’s economic calendar is once again crowded, with a series of key inflation reports and consumer-related indicators in the spotlight.
Early Tuesday, the Reserve Bank of Australia will announce its interest rate decision, with markets expecting a 25-basis-point cut from 3.85% to 3.60%. Shortly after, traders’ attention will shift to the U.S. Consumer Price Index (CPI) for July, where core inflation is expected to rise from 0.2% in June to 0.3%.
Wednesday will be relatively quiet, with the main highlight being speeches from Fed officials Austan Goolsbee and Raphael Bostic. On Thursday, focus will return to major data releases, including the U.S. Producer Price Index (PPI), which is projected to see its core measure increase by 0.2% after holding steady in June. Weekly jobless claims figures will also be released that day.
The week will conclude with a broader look at U.S. consumer activity. July retail sales are forecast to slow from 0.6% to 0.5%, while core retail sales are expected to drop from 0.6% to 0.3%. Hours later, the preliminary August reading of the University of Michigan Consumer Sentiment Index will be released, providing insights into consumer expectations and confidence.
According to ISM data, pricing pressures have eased in the manufacturing sector but have jumped sharply in the services sector, which makes up a much larger share of the U.S. economy. This suggests that upcoming CPI and PPI reports carry an upside risk relative to forecasts. Inflation readings above expectations—even before fully factoring in the impact of retaliatory tariffs—could erase part of the market’s anticipated rate-cut outlook.

Different Strats, Same ChartICT, SMC, breakout traders, trendline traders… everyone swears they’ve got a unique edge, but it’s all pointing to the same POI. Same price, same reaction. Doesn’t matter what you call it — the market delivers the same setup for everyone, only difference is how you see it.

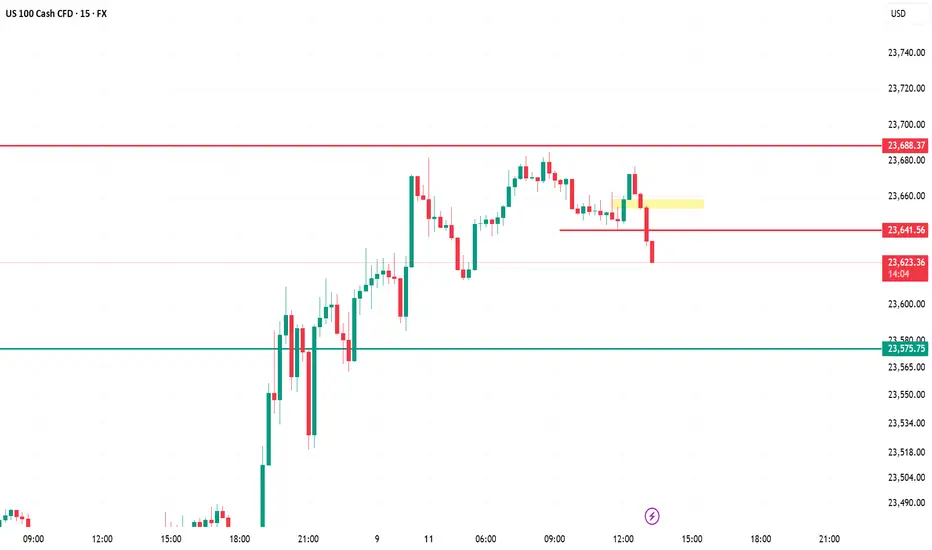
US100 (5m) – AnalysisKey Breakdown – Price has broken below the 23,641 support (red line) after failing to hold the yellow retest zone, signaling short-term bearish momentum.
Immediate Resistance – 23,641 is now flipped into resistance; any pullback toward it could attract sellers.
Downside Target – Next major support sits at 23,575; if broken, deeper liquidity may be targeted below 23,550.
Market Structure – Shifted from intraday uptrend to lower highs & lower lows; momentum favors short trades until structure flips.
Trading Approach – Look for short entries on retests of 23,641 with stop above yellow zone, target 23,575, then trail for possible extended drop.
NasdaqAs said before, nasdaq going down, can take out highs then plummet, but time will tell. PS: my previous posts got removed. View auto supply and demand zones indicator. Dm me free for a month free. (It draws snd zones).

Nasdaq Pumping High, We Might Ride The WavePrice today(Wed) is recovering from yesterday's (Tue) dumping. Our bullish direction is still intact.
Entries should be taken once, price has entered within our Area of Opportunity.
Targets with their success rate have been outlined on the charts.

NDX & SPX , Stay heavy on positionsNDX & SPX , Stay heavy on positions. (QLD, TQQQ)
Despite the rebound, the market remains tilted toward hedging and caution.
In stay light on positions zones, I hold QQQ and reduce exposure.
In stay heavy on positions zones, I increase allocation using a mix of QLD and TQQQ.

Sunday pre market analysistake the liQ from Junes high then
possible hit the 4H FVG if not just continue
upwards into September

when to change your session bias and Take profit, YM! Long1. This video demonstrate when you should change you bias for the session, sometimes before session price action quite confusing but when you add SMT and strength switch concept to you bias you will see true price intention where it will go.
2. Always take entry or profit one level to another level, price always go from one level to another level.
3. This video I try to demonstrate how to take profit when you have to level to target, always look for the correlated instruments to build bias

Nasdaq long position Nasdaq long position update. Nasdaq is still going as predicted and is about to hit the set target of 24,000. Recently Nasdaq retested a support of break-out and retest and continued with the bullish momentum. Nasdaq is set to thrive even higher to a price of 25,000.

NSDQ100 sideways consolidation support at 23045Nasdaq 100 Market Summary – August 8
Markets remain cautious, with a mix of corporate and macro developments driving sentiment.
Gold futures surged after the US unexpectedly imposed tariffs on one-kilo and 100-ounce gold bars. The move surprised traders and added fresh uncertainty to the metals market. Oil prices stabilized following a recent decline, as attention shifts to potential diplomatic developments, including a possible Trump-Putin meeting.
In the tech sector, Tesla scrapped its Dojo supercomputer project, a blow to its in-house AI and self-driving ambitions. This comes just weeks after Elon Musk said he was doubling down on the effort. The departure of the project’s lead adds to investor concerns. Meanwhile, Intel’s CEO responded to political pressure by reaffirming his board’s support, as Trump called for his resignation over alleged conflicts of interest.
On the economic front, the latest jobless claims data brought some relief after last week’s soft payrolls report. Initial claims rose slightly to 226,000, just above the 222,000 forecast. However, continuing claims came in higher at 1.974 million, with most of the increase seen in California—likely due to seasonal factors. Additionally, the New York Fed’s July survey showed a rise in both inflation expectations and concerns about the job market.
Conclusion for Nasdaq 100 Trading:
The tone remains cautious. Disruptions at major constituents like Tesla and Intel may drag on sentiment, while macro uncertainty—rising geopolitical tensions, new tariffs, and unstable commodity markets—adds to headwinds. Traders may rotate into defensives or software names with lower exposure to AI hardware or international trade risks. Expect range-bound trading with elevated volatility until clarity emerges on US-Russia diplomacy and the true extent of tariff impacts.
Key Support and Resistance Levels
Resistance Level 1: 23700
Resistance Level 2: 23900
Resistance Level 3: 24085
Support Level 1: 23045
Support Level 2: 22870
Support Level 3: 22675
This communication is for informational purposes only and should not be viewed as any form of recommendation as to a particular course of action or as investment advice. It is not intended as an offer or solicitation for the purchase or sale of any financial instrument or as an official confirmation of any transaction. Opinions, estimates and assumptions expressed herein are made as of the date of this communication and are subject to change without notice. This communication has been prepared based upon information, including market prices, data and other information, believed to be reliable; however, Trade Nation does not warrant its completeness or accuracy. All market prices and market data contained in or attached to this communication are indicative and subject to change without notice.


BUY USTEC 8.8.2025Confluence order: BUY at M15
Type of order: Limit order
Reason:
- The current top is not touching anything, expected to rise to the MAINKEY of H1~M15 above.
- M15~FIBO 0,5-0,618 (same position)
Note:
- Management of money carefully at the last bottom (23,459)
Set up entry:
- Entry buy at 23,438
- SL at 23,423
- TP1: 23,459 (~1R)
- TP2: 23,481 (~2R)
- TP3: 23,540 (~6R)
Trading Method: Price action (No indicator, only trend and candles)


NAS100 - LONGPrice pushed down a lot lower than I thought it would but sentiment still remains the same. Waiting for bullish confirmation for price to reach today's highs.

NAS100 - LONGstrong sell of this morning. Waiting for buyers to reenter the market and push price back to todays highs.

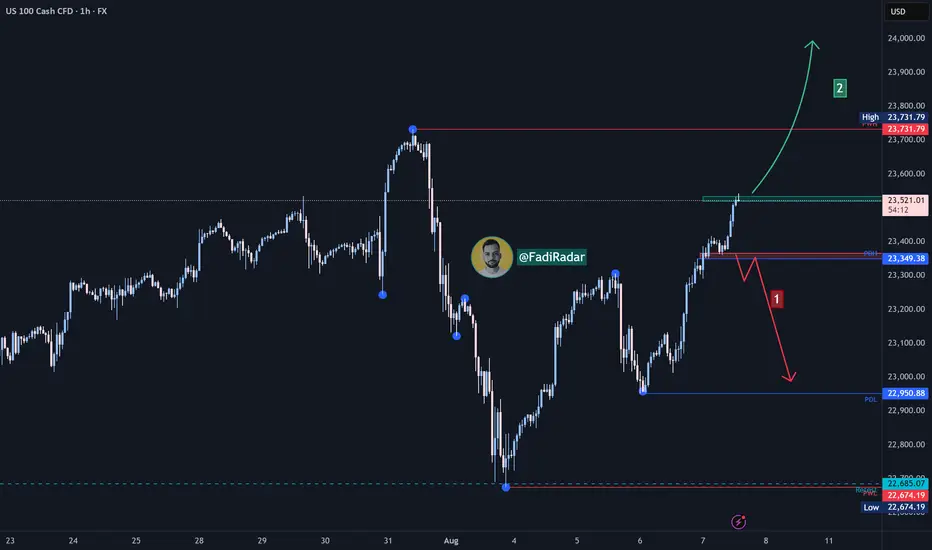
NASDAQ Index (US100 / NASDAQ) Analysis:The NASDAQ index has shown strong bullish momentum recently and is currently trading near a key resistance level at 23,530.
🔻 Bearish Scenario:
If the price fails to break above 23,530 and selling pressure begins to appear, we may see a downside correction toward 23,350. A break below this level could extend the decline toward 23,000.
🔺 Bullish Scenario:
If the price successfully breaks and holds above 23,530, it could support a continued move upward toward 23,730 as the first target. With sustained momentum, we might see a further push toward 24,000.
⚠️ Disclaimer:
This analysis is not financial advice. It is recommended to monitor the markets and carefully analyze the data before making any investment decisions.