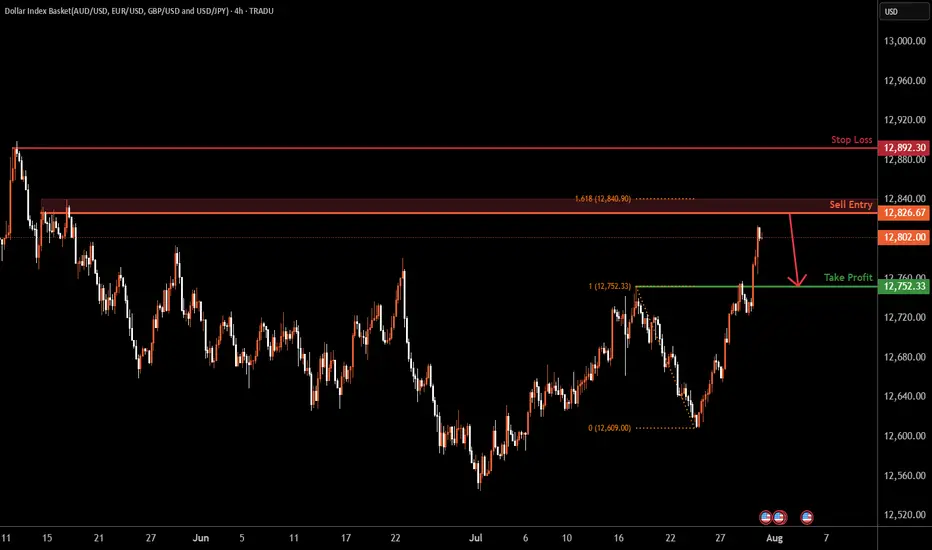
USDOLLAR H4 | Bearish reversalBased on H4 chart analysis, we can see the price rising towards the sell entry at 12,826.67, which is a swing high resistance.
Stop loss is at 12,892.30, which is a swing high resistance.
Our take profit will be at 12,752.33, which is a pullback support.
High Risk Investment Warning
Trading Forex
About Dollar Index Basket(AUD/USD, EUR/USD, GBP/USD and USD/JPY)
The Dow Jones FXCM Dollar Index (short: DJ FXCM Index) is a currency index that tracks the strength of the US Dollar against a basket of the four most liquid currencies in the world. It is the product of collaboration between FXCM and S&P Dow Jones Indices. The index was designed to help traders assess whether the US Dollar is strengthening or weakening and is known for its transparency and simplicity. It reflects the change in value of the US Dollar measured against the basket of currencies: it rises when the US Dollar gains value relative to this basket and it falls when the opposite happens.
The basket contains the Euro, the British Pound, The Japanese Yen and the Australian Dollar in equal amounts, which are equally weighted. It is geographically balanced and accounts for 80% of worldwide Forex activity. The DJ FXCM Index was introduced on January 1, 2011, at a value of 10,000.00, is calculated every 15 seconds and updated Monday to Friday. It should not be mistaken for the much older and more complex US Dollar Index (DXY), which represents the weighted geometric mean of the US Dollar's value compared to six specific currencies. The weights were set according to trade weights and the Euro has the dominant weight in the DXY.
The basket contains the Euro, the British Pound, The Japanese Yen and the Australian Dollar in equal amounts, which are equally weighted. It is geographically balanced and accounts for 80% of worldwide Forex activity. The DJ FXCM Index was introduced on January 1, 2011, at a value of 10,000.00, is calculated every 15 seconds and updated Monday to Friday. It should not be mistaken for the much older and more complex US Dollar Index (DXY), which represents the weighted geometric mean of the US Dollar's value compared to six specific currencies. The weights were set according to trade weights and the Euro has the dominant weight in the DXY.
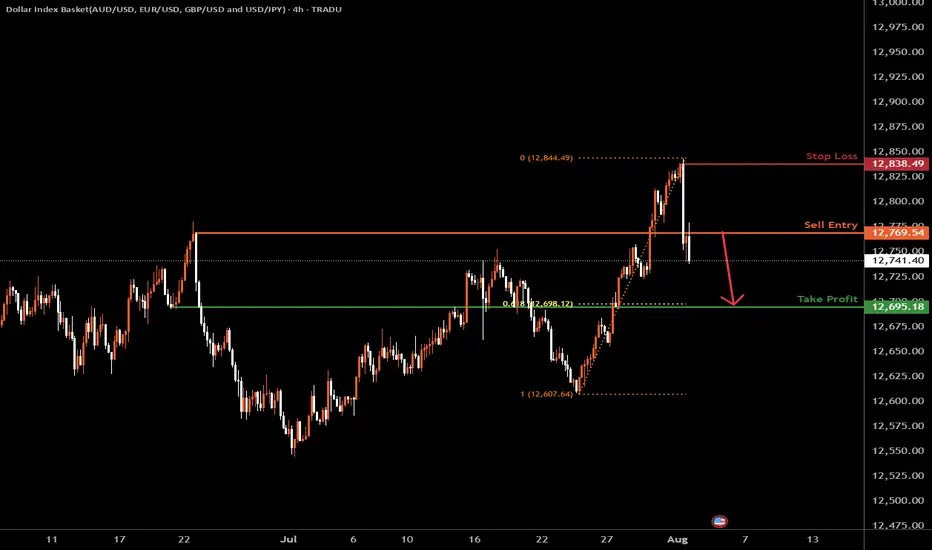
USDOLLAR H4 | Bearish dropBased on the H4 chart analysis, we could see the price drop lower from the sell entry, which is a pullback resistance and could drop to the downside.
Sell entry is at 12,769.54, which is a pullback resistance.
Stop loss is at 12,834.49, which is at 12,695.18, which is a pullback resistance.
Take

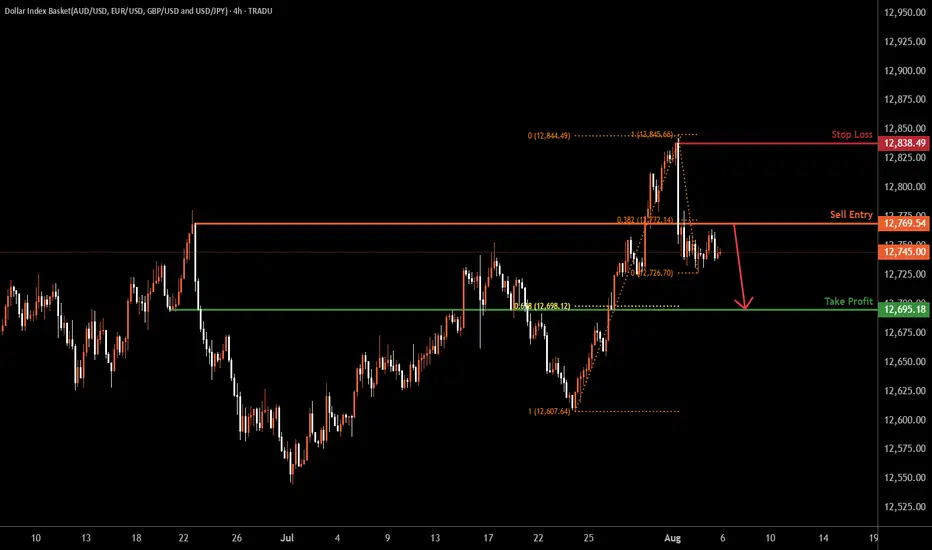
USDOLLA H4 | Bearish dropBased on the H4 chart analysis, we can see the price rise to the sell entry which is a pullback resistance and could drop from this level to the take profit.
Sell entry is at 12,769.54, which is a pullback resistance that lines up with the 38.2% Fibonacci retracement.
Stop loss is at 12,838,49, wh
DXY DOLLAONLY looking for bullish price action..
we already have a plan paitence wins the race as per 😃

USDOLLARGrounds are ready to sell USD Uh further 12 600 That's why I have posted idea to buy Euro USD pattern is same need to follow the pattern.

USD finna DROP like Crazy!!Since we have clearly rejected this resistance area, there will likely be more downward movement for the USD. search for BUYS ON EURUSD. GBPUSD. ETC..
bullish isea pf EURCHFI'm using support and resistance and the market shift structure and Order blocks and handle shoulder and the Candlestick confirmation to confirm if that the price have probability to go higher from my support

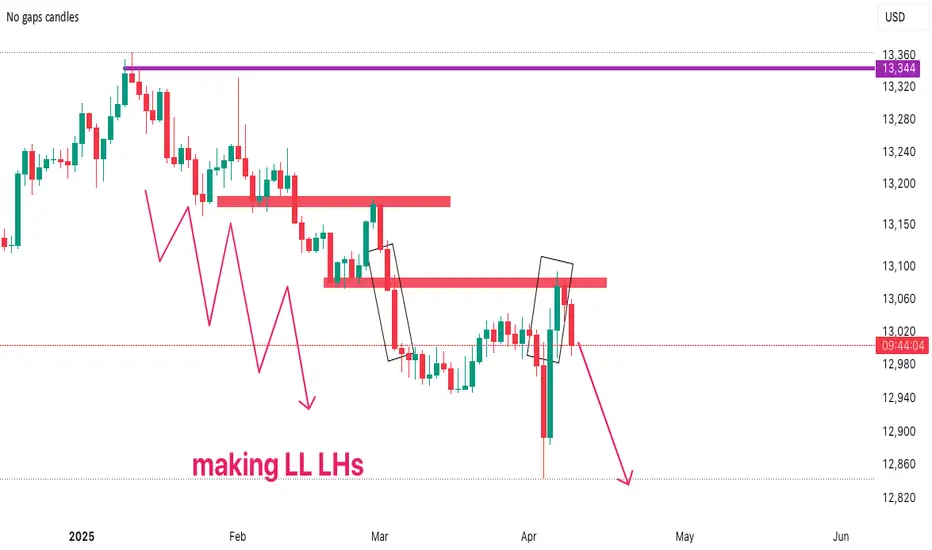
usdollarUS Dollar made a cup handle. It is currently retesting this area. It may reach the points I marked.

Dollar Index(DXY) Rebounds from Key Support–Is a New High Cominghello guys.
Let's see what happened for us index and what will happen:
Uptrend Support:
The price has been respecting a long-term ascending trendline since 2011, indicating a strong bullish structure.
Recent price action suggests that the index retested this trendline and bounced off it.
Key Resis

See all ideas
Displays a symbol's price movements over previous years to identify recurring trends.