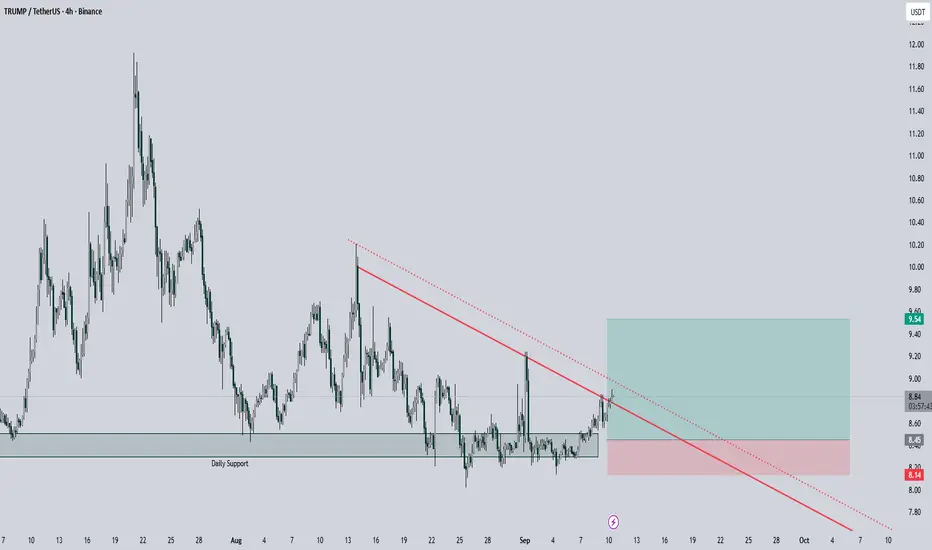
TRUMP Possible breakoutBINANCE:TRUMPUSDT Current Status
The overall trend is bearish, but there's a strong and solid support zone between $8 and $8.50. On the daily timeframe, this support is still valid and has not been broken yet.
Right now, we have a descending trendline that the price is trying to break for the umpteenth time, and we're seeing another attempt today.
There's a chance the descending trendline could break, or it could fail and lead to a drop. In either case, the price of $8.45 could be a good spot for a long position with a 1:3.5 risk-to-reward ratio.
Personally, I never enter a position the moment a trendline breaks. I always wait for the price to come back to my desired entry point, which happens most of the time.
⛔ Disclaimer: This is not investment advice or a recommendation to buy. Please do your own research.
Market insights
TRUMP!!!Hello friends
Considering the good growth we had, you can see that the price could not continue the growth of the hood and it has fallen. Now it is suspected of a head and shoulders pattern. I repeat, it is suspected of a head and shoulders pattern. The pattern has not yet formed.
If the price breaks the designated resistance, the price can move to the specified targets and if the resistance is broken, I will update it for you.
*Trade safely with us*

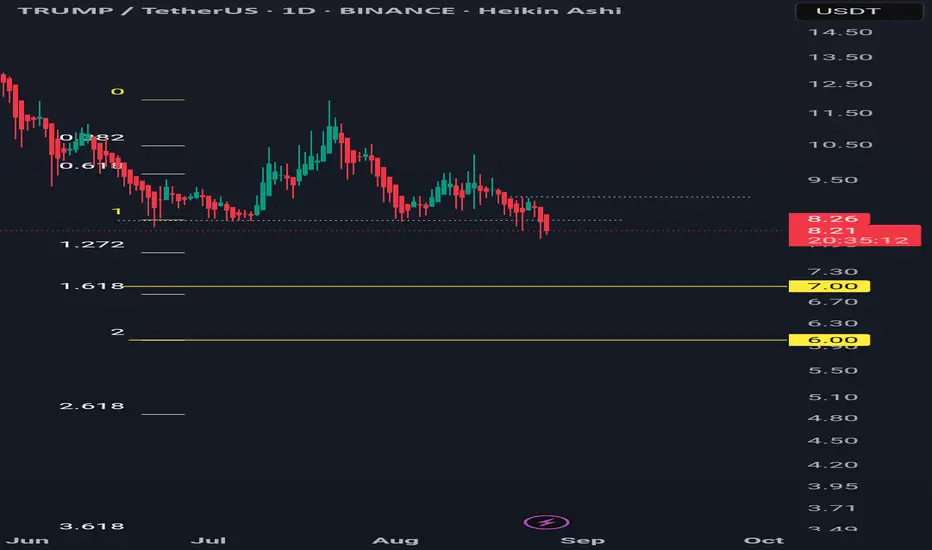
Trumpusdt Bearish h&s pattern in daily time frameA bearish H&S pattern has formed in the daily time frame.
Targets are 7 and 6.
Invalidation if it closes above 9.1 in daily time frame.
September 9, 2025: TRUMPUSDT.P Price has been consolidating above key support around 8.25 and recently confirmed a breakout with higher lows forming. Entry is set at 8.547, looking for continuation towards the next resistance zone.
Entry: 8.547
Partial Take Profit: 8.990 → Move SL to Breakeven
Final Take Profit: 9.239
Stop Loss: 8.201
This setup carries medium risk but has a high probability of playing out, supported by clean structure, breakout momentum, and strong support retest. Managing risk with a partial TP and shifting SL to breakeven ensures protection if momentum weakens.
This is not financial advice. Trading involves risk, and you should always do your own research before making any investment decisions. Manage your risk properly and never trade with money you cannot afford to lose.

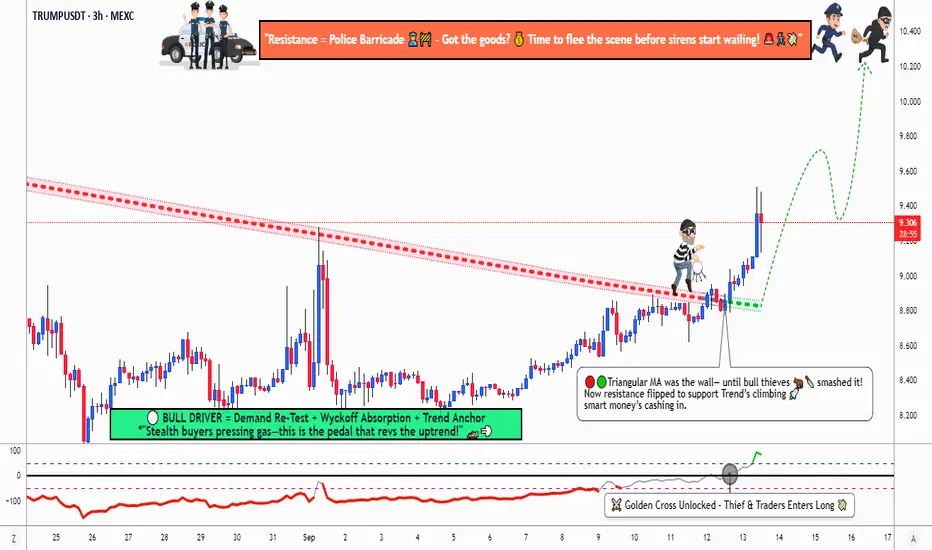
Unlock TRUMP/USDT Gains: Swing Trade Strategy Revealed!🎉 Trump vs Tether: Crypto Heist of the Century! 🚨 (TRUMP/USDT Swing/Day Trade)
🔥 Ladies and Gentlemen, Thieves of Profit! Welcome to the Trump vs Tether crypto caper, where we sneak into the market, grab the gains, and vanish before the cops (resistance) catch us! 😎 This swing/day trade setup is designed for maximum loot with a polished, rule-abiding thief vibe that’ll make the TradingView community go wild. Let’s dive into this bullish breakout plan with style and swagger! 💰
📜 The Heist Plan: Bullish Breakout Blueprint
🚀 Demand Zone Push: Buyers are storming in from a strong demand zone, setting the stage for a bullish breakout. The market’s screaming, “Let’s go, thieves!”
🔄 Retest Confirmation: Price retests the breakout level, confirming the move. This is our green light to join the heist!
📈 Triangular Moving Average Breakout: The price smashes through the TMA like a vault door, signaling a bullish trend.
📊 Momentum Oscillator Golden Cross: The momentum oscillator flashes a golden cross, screaming, “This trend is legit!” Time to load up on TRUMP/USDT!
🔑 Entry: Layered Limit Order Strategy (Thief Style) 🕵️♂️
🎯 Entry Levels: Use a layering strategy to sneak into the market with multiple limit orders. Suggested buy entries:
$9.000
$9.100
$9.200
$9.300
Pro Tip: Stack more layers based on your risk appetite and market conditions! Be the sneakiest thief in the game. 😏
⚡ Flexible Entry: No strict price? No problem! Enter at any level that aligns with the demand zone push and TMA breakout. Just don’t get caught sleeping!
🛑 Stop Loss: Protect Your Loot!
🔒 Thief’s Stop Loss: Set your SL at $8.750 to guard your stash.
⚠️ Note: Dear Thieves (OGs), this SL is a suggestion. Adjust it to your strategy and risk tolerance. You’re the mastermind of this heist—own it!
🎯 Target: Grab the Cash and Run! 🏃♂️
💸 Profit Target: Aim for $10.300, where strong resistance and overbought conditions signal a potential trap. The market police are waiting, so cash out before they cuff you!
⚠️ Note: Thieves, this TP is a guide. Take profits at your own discretion—grab the money and escape at your own risk!
🔗 Related Pairs to Watch (Correlated Assets) 👀
To boost your heist, keep an eye on these correlated pairs in USD for additional opportunities or confirmation:
BITSTAMP:BTCUSD : Bitcoin often sets the tone for altcoins like TRUMP. A bullish BTC move could fuel our TRUMP/USDT rally.
BITSTAMP:ETHUSD : Ethereum’s strength often correlates with altcoin pumps. Watch for ETH breakouts to confirm TRUMP’s momentum.
COINBASE:DOGEUSD : Meme coins like DOGE can move in tandem with TRUMP due to similar speculative vibes. A DOGE surge could signal a TRUMP breakout.
CBOE:MAGA (MAGA/USDT): The direct sentiment sibling. Often moves in close correlation.
CRYPTOCAP:USDT (DXY Watch): Keep an eye on Tether's peg and overall dollar strength (via DXY). A weak dollar can often benefit crypto.
Key Correlation Points:
TRUMP/USDT thrives in a risk-on crypto environment. If BTC and ETH are pumping, TRUMP is likely to follow.
Watch for high-volume breakouts in these pairs to confirm TRUMP’s bullish momentum.
🕵️♂️ Why This Setup Rocks
Bullish Confluence: Demand zone, TMA breakout, and golden cross align for a high-probability trade.
Thief-Approved Strategy: Layered entries let you scale in like a pro, minimizing risk while maximizing gains.
Community Appeal: This fun, professional vibe is crafted to grab attention, spark engagement, and maybe even land an Editor’s Pick! 🌟
⚖️ Disclaimer
This Thief Style trading idea is purely for educational and entertainment purposes. It’s a fun spin on market analysis, not financial advice. Always conduct your own research, assess your risk tolerance, and trade responsibly. The market’s a wild place—steal those gains at your own risk, Thieves! 😜
✨ If you find value in my analysis, a 👍 and 🚀 boost is much appreciated — it helps me share more setups with the community!
#TradingView #CryptoHeist #TRUMPUSDT #SwingTrade #DayTrade #BullishBreakout #ThiefStrategy

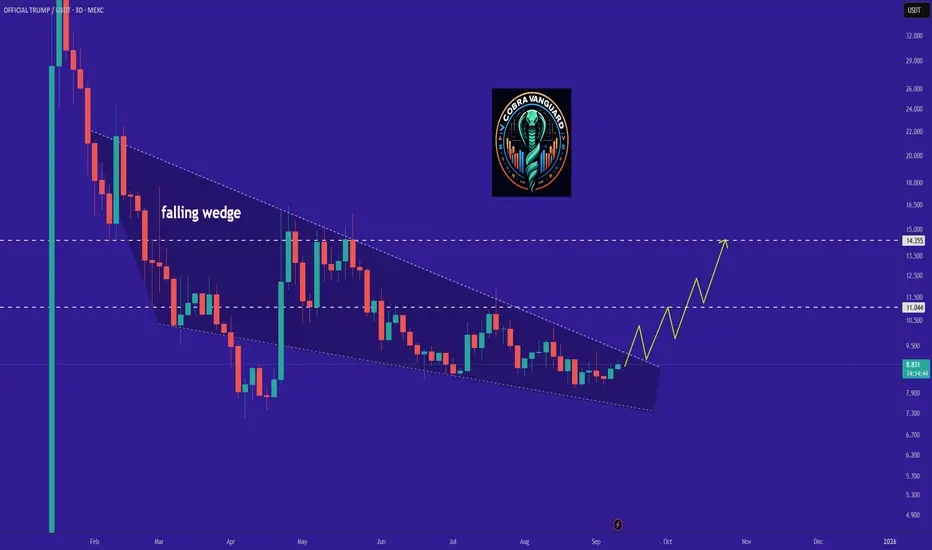
TRUMP is bullish now and many Traders don't see it !!Are you watching TRUMP I think it's slowly moving towards $10. What do you think?
NOTE: wait for break of the WEDGE .
Best regards CobraVanguard.💚
Trump BUYA clear bullish flag is seen as TRUMP/USD has been selling for a while but, there is a trend in trends where there is also a clear W formation visible within the bullish flag and the clear retest at 8.68. which is the ideal point of entry for a BUY.
The TP (15.68) is also the point at which the W formation will end and the safest take profit level.

TRUMPUSDT - Clear bottom!The Trump token shouldn’t be treated like any other coin — it has backing from big companies and institutions, and more importantly, it’s directly tied to the U.S. President himself. 🇺🇸
Right now, the entire crypto market is forming a bottom that looks almost identical to the one in September 2024, right before the massive rally in October. That’s a strong signal of the next bull market, and naturally, a coin with Trump’s significance will capture a huge share of that upside.
Because honestly — if you can’t make money with Trump, you won’t make money in this market at all.
It has been consolidating for more than 200 days, building a massive symmetrical triangle. Once that breakout happens, the minimum target is $30, and it could hit that level easily in a very short time. Keep a close eye on it.
Best Regards:
Ceciliones🎯

trump/usdt.1hAnalysis of Trump/USDT, one of the cryptocurrency pairs, on the hourly time frame. The analysis is based on trend analysis, support and resistance, and the price action. It is strongly qualified to rise.

$TRUMP🚨 Signal TRUMP/USDT (1H) 🚨
* ✅ Entry: 8.66 – 8.70
* ⛔️ SL: 8.56
* 🎯 TP1: 8.75
* 🎯 TP2: 8.84
* 🎯 TP3: 8.94

TRUMP/USDT PRE INCREASE VIEWTRUMP shows on the low time frame a pre increase depending on data, there will be a follow-up to see if this coin is able to get confirmed.

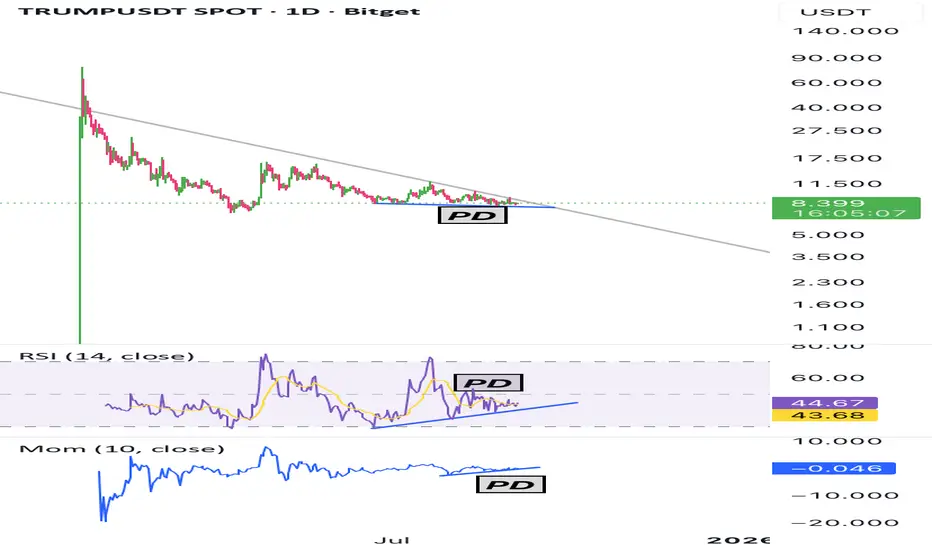
TRUMP/USDT – Daily Chart Positive Divergence AnalysisThe most notable feature on the chart is the descending triangle formation where the price is consolidating while showing strong bullish divergences across multiple indicators.
🔹 Price Action:
The price keeps making lower lows but finds solid support around the 8 USDT zone, holding near the bottom of the triangle.
🔹 RSI (14):
While the price trends lower, RSI is forming higher lows. This signals weakening selling pressure and growing strength from buyers.
🔹 Momentum (Mom 10):
The Momentum indicator also prints higher lows against the lower price action. This confirms that bearish momentum is fading and increases the probability of an upside breakout.
⚡ Summary:
As the price approaches the apex of the triangle, both RSI and Momentum show strong bullish divergences. This setup may anticipate an upside breakout. A sustained move above 10 USDT could open targets around 13 – 17 – 23 USDT levels.
TRUMPUSDT at a Critical Decision Zone: Rebound, or Breakdown?Currently, TRUMPUSDT is trading within the critical support range of $8.33 – $7.13, which has repeatedly acted as a strong demand zone since May. After a prolonged downtrend from its peak earlier this year, the market is now moving sideways, signaling a potential accumulation phase or preparation for the next major move.
---
🔎 Chart Structure & Pattern
Main trend: Long-term bearish since the peak.
Current phase: Sideways consolidation near a strong support zone.
Key support: $8.33 → $7.13 (demand zone).
Layered resistance levels: $9.59 → $11.25 → $12.48 → $15.11 → $17.11.
Major psychological targets: $21.59 and $27.96 if a strong reversal takes place.
---
✅ Bullish Scenario
1. If the price holds above $7.13 and forms a bullish reversal candle (pinbar, engulfing, or volume spike), a rebound is likely.
2. Short-term upside targets: $9.59 – $11.25.
3. A breakout above $12.48 with strong volume may push price toward $15.11 – $17.11.
4. A decisive breakout above $21.59 would confirm a long-term trend reversal with potential to reach $27.96+.
---
❌ Bearish Scenario
1. If the $7.13 support fails, selling pressure could intensify.
2. Next bearish target would be around $6.10 as a psychological support.
3. A breakdown below this zone may create a new lower low, extending the bearish trend.
---
📝 Conclusion
TRUMPUSDT is currently at a make-or-break zone.
As long as $7.13 holds, the possibility of a rebound toward key resistance levels remains strong.
However, a breakdown below this support would likely extend the bearish continuation.
📌 The best approach now is to wait for confirmation from price action at this crucial support level before positioning.
---
#TRUMPUSDT #CryptoAnalysis #AltcoinUpdate #TechnicalAnalysis #BullishScenario #BearishScenario #CryptoSignals

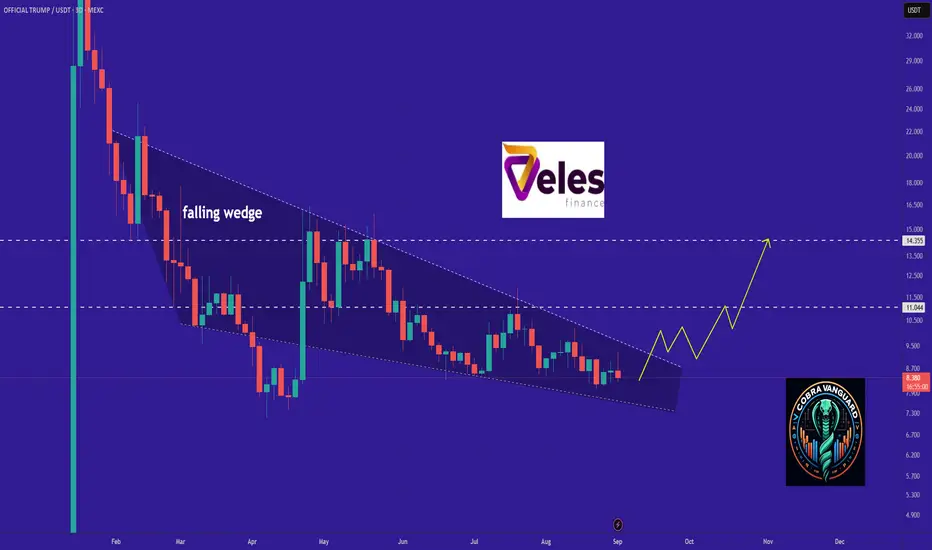
TRUMP is bullish now and many Traders don't see it !!Are you watching TRUMP I think it's slowly moving towards $10. What do you think?
NOTE: wait for break of the WEDGE .
Best regards CobraVanguard.💚
TRUMP ANALYSIS📊#TRUMP Analysis
✅There is a formation of Descending triangle pattern on daily chart🧐
Pattern signals potential bullish movement incoming after a small retest 📉
👀Current Price: $8.37
🚀 Target Price: $11.29
⚡️What to do ?
👀Keep an eye on #TRUMP price action and volume. We can trade according to the chart and make some profits⚡️⚡️
#TRUMP #Cryptocurrency #TechnicalAnalysis #DYOR

TRUMP TRADE PLANLooking forward to accumulate trump in the grey zone. It will have massive pumps during the memecoin rally!
Lets see the price action in the grey zone and do some DCA.

100% pump incomingBullish divergence. Descending wedge. Trump fever. What more do you need? Big wave surfing

Possible SHORT on TRUMPUSDTSince TRUMPUSDT is on a Downtrend, there's a minor bullish counter trendline. If the counter trendline breaks, we expect SELLS but if the main trendline breaks, we might expect BUYS.

TRUMP - Tight Squeeze - 1000% upside & minimal downside R/R 30. 10x from current levels a bit less if entering at entry point of 11.86.
A bit of a wild card pattern, as it has developed a flat bottom. I entered this last time I posted, stopped out but have re-entered.
Entry - 11.86
Stop - 8.686
Interval 1 - 14.39
Interval 2 - 20.186
Target - 111.969

HODL BASKETHello friends
You see the Trump meme coin on the weekly time frame that has an important resistance and a good support.
Now, to buy this currency, we must wait for a valid break of the resistance and then the price can move to the specified targets.
Note that the specified support is very important and for the price to rise, both the support and the resistance need to be maintained.
Be sure to observe risk and capital management.
*Trade safely with us*

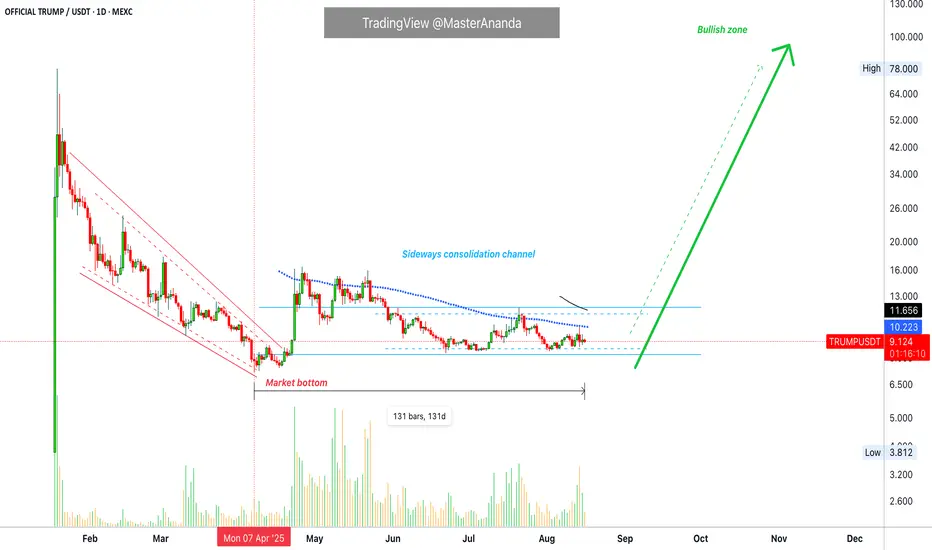
OFFICIAL TRUMP · How Long Will It Take? How To Win!We start counting from the final low. When the bearish wave (correction) makes one final low, no new lows, we start to count towards a reversal.
I cannot tell you exactly how long it will take for TRUMPUSDT to produce a very strong bullish wave but I can tell you how the altcoins market behaves. A strong bullish wave tends to happen every 8-10 months.
TRUMPUSDT. The bottom was hit in April 131 days ago. So a little over four months.
Now, a bullish wave can develop after 8-10 months but there is always a two months build up process and then the wave itself. The wave can last 1-3 months of rising prices. Five months in total more or less. (Please continue reading.)
If TRUMPUSDT hit bottom already four months ago and a full bullish wave can unravel in 9 months, here we are getting very close. At anytime, any week or day now TRUMPUSDT can start growing. Any growth is not all there will be but only part of a rising trend. Many pairs are already here doing just that. Some move first while others move later. Patience is key.
Wait patiently. One pair can be growing daily for 90 days and end up with +300%. Say another pair goes sideways and even a bit lower for 60 days, but after sixty days starts to go up and by day 90 is up 500%. If you are ready to wait 3 months, it doesn't matter what is happening short-term, what matters is the long-term results.
Namaste.
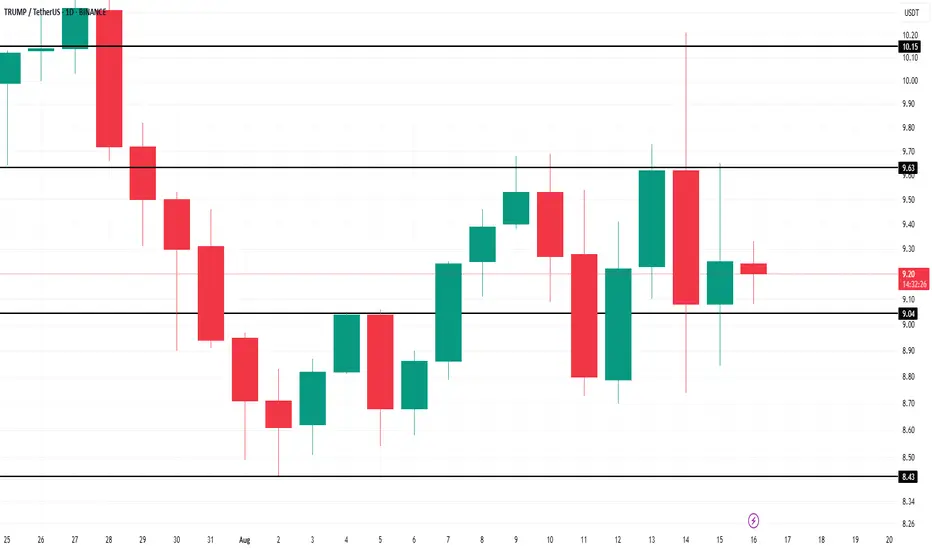
This Is Why TRUMP Price Didn’t Surge After Alaska MeetingBINANCE:TRUMPUSDT is currently trading at $9.17, holding above the support level of $9.04. This range-bound movement suggests that the price could continue consolidating between the $9.04 support and the resistance of $9.63. The market’s indecisiveness points to a period of low volatility.
However, if the outflows continue, BINANCE:TRUMPUSDT could fall through the $9.04 support and fall to the next support level of $8.43. This would extend the losses and put further downward pressure on the price, signaling a potential decline.
On the other hand, if BINANCE:TRUMPUSDT manages to flip the $9.63 resistance level into support, it could make its way towards $10.00 . This would require a change in investor sentiment, likely driven by renewed confidence in the asset's potential.