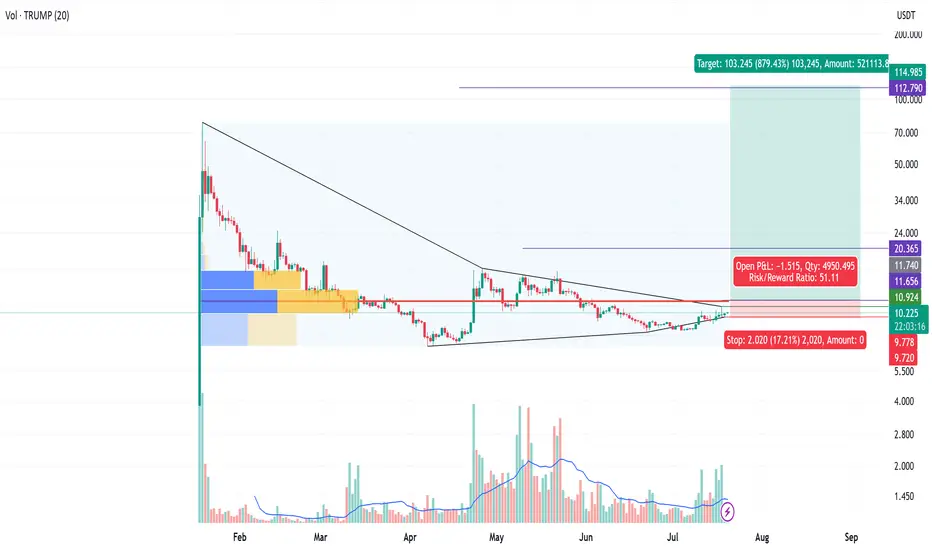
TRUMP - Tight Squeeze - 1000% upside & minimal downside R/R 30. 10x from current levels a bit less if entering at entry point of 11.86.
A bit of a wild card pattern, as it has developed a flat bottom. I entered this last time I posted, stopped out but have re-entered.
Entry - 11.86
Stop - 8.686
Interval 1 - 14.39
Interval 2 - 20.186
Target - 111.969
TRUMPUSDT trade ideas

OFFICIAL TRUMP · How Long Will It Take? How To Win!We start counting from the final low. When the bearish wave (correction) makes one final low, no new lows, we start to count towards a reversal.
I cannot tell you exactly how long it will take for TRUMPUSDT to produce a very strong bullish wave but I can tell you how the altcoins market behaves. A strong bullish wave tends to happen every 8-10 months.
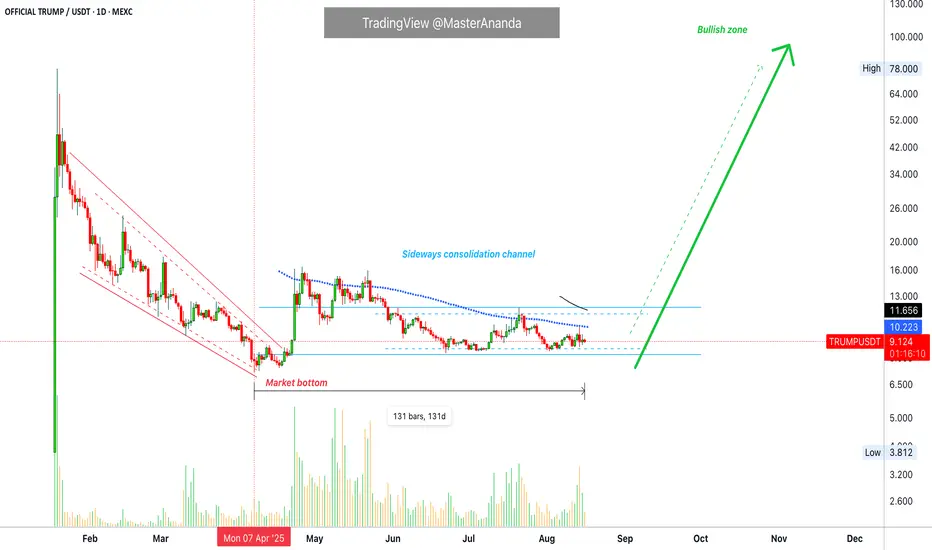
TRUMPUSDT. The bottom was hit in April 131 days ago. So a little over four months.
Now, a bullish wave can develop after 8-10 months but there is always a two months build up process and then the wave itself. The wave can last 1-3 months of rising prices. Five months in total more or less. (Please continue reading.)
If TRUMPUSDT hit bottom already four months ago and a full bullish wave can unravel in 9 months, here we are getting very close. At anytime, any week or day now TRUMPUSDT can start growing. Any growth is not all there will be but only part of a rising trend. Many pairs are already here doing just that. Some move first while others move later. Patience is key.
Wait patiently. One pair can be growing daily for 90 days and end up with +300%. Say another pair goes sideways and even a bit lower for 60 days, but after sixty days starts to go up and by day 90 is up 500%. If you are ready to wait 3 months, it doesn't matter what is happening short-term, what matters is the long-term results.
Namaste.
HODL BASKETHello friends
You see the Trump meme coin on the weekly time frame that has an important resistance and a good support.
Now, to buy this currency, we must wait for a valid break of the resistance and then the price can move to the specified targets.
Note that the specified support is very important and for the price to rise, both the support and the resistance need to be maintained.
Be sure to observe risk and capital management.
*Trade safely with us*

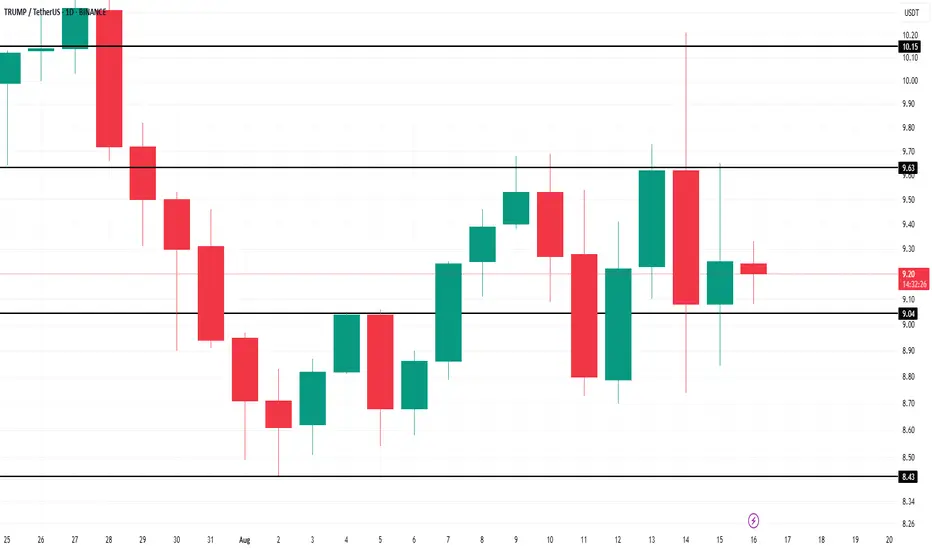
This Is Why TRUMP Price Didn’t Surge After Alaska MeetingBINANCE:TRUMPUSDT is currently trading at $9.17, holding above the support level of $9.04. This range-bound movement suggests that the price could continue consolidating between the $9.04 support and the resistance of $9.63. The market’s indecisiveness points to a period of low volatility.
However, if the outflows continue, BINANCE:TRUMPUSDT could fall through the $9.04 support and fall to the next support level of $8.43. This would extend the losses and put further downward pressure on the price, signaling a potential decline.
On the other hand, if BINANCE:TRUMPUSDT manages to flip the $9.63 resistance level into support, it could make its way towards $10.00 . This would require a change in investor sentiment, likely driven by renewed confidence in the asset's potential.
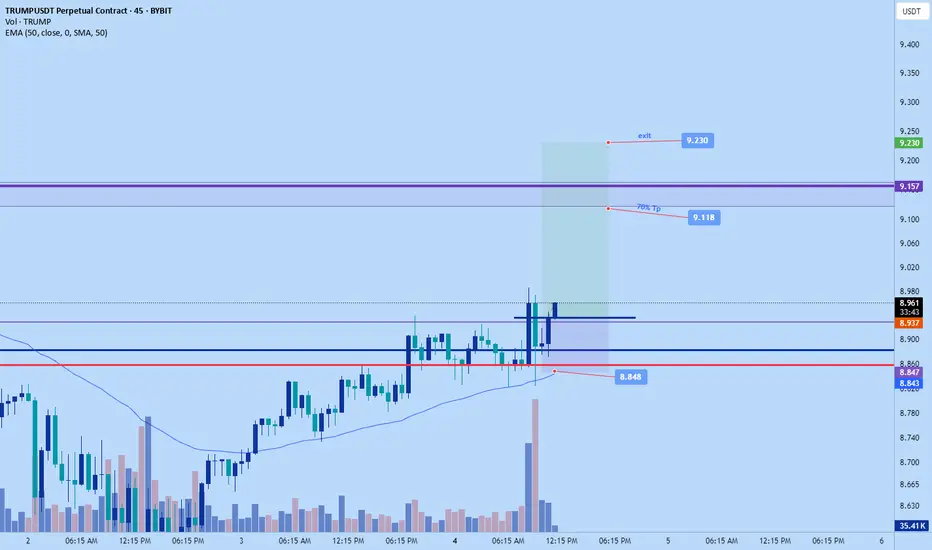
TRUMP USD SHORT RESULT Price has been trading in a sideways channel range and held the support Trendline to the top with conflunce of the choppy price action and low volume, I expected price to dump back ito the range, so I executed the short from the next resistance zone and it moved just as I predicted.
_THE_KLASSIC_TRADER_.🔥

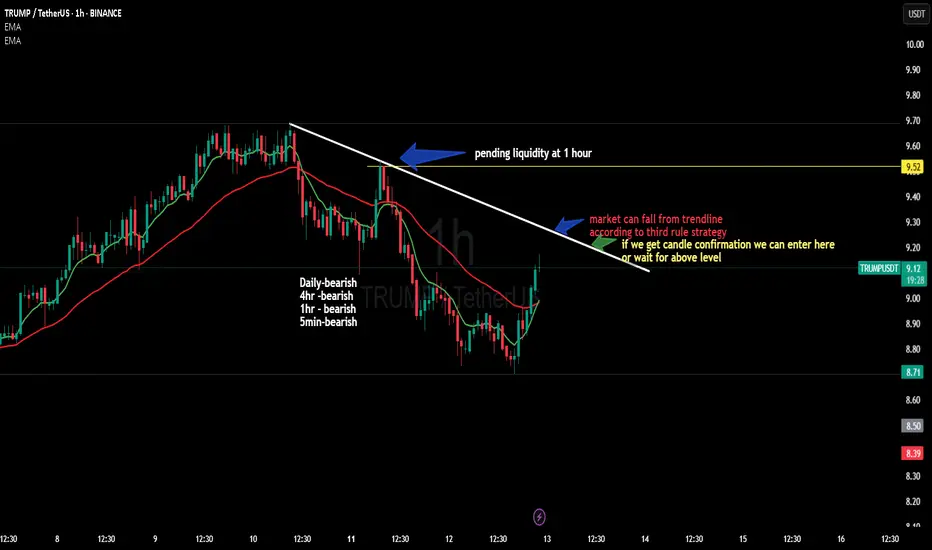
TRUMPUSD SHORT TRADEMarket trend is bearish in daily,4hr,1hr and 5 min TF
trendline rejection can lead to short tade with candle confirmation
(acc to third rule strategy)
otherwise wait for liquidity grab at 1 hr time frame
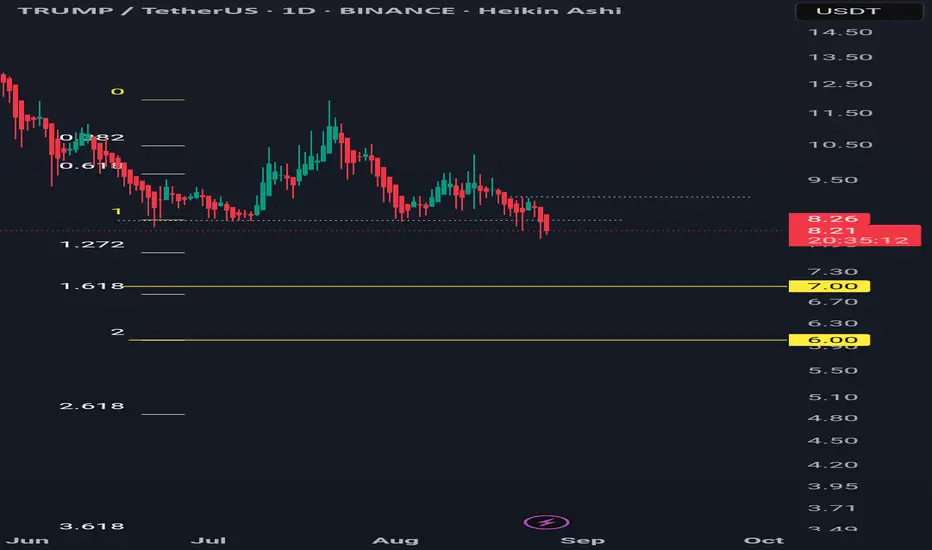
Trumpusdt Bearish h&s pattern in daily time frameA bearish H&S pattern has formed in the daily time frame.
Targets are 7 and 6.
Invalidation if it closes above 9.1 in daily time frame.
OFFICIAL TRUMP Updated : Can take off from here.....Trend History
Initial Pump and Dump: Price had a huge spike in the early phase (January), followed by a sharp sell-off.
Descending Channel: From late January to early April, the price was moving in a falling wedge/descending channel .
Market Bottom: Found around 7 April 2025, near the $7.15 level (highlighted as “Market bottom”).
Breakout from Wedge: After hitting the bottom, the price broke above the wedge, signaling a reversal attempt.
2. Consolidation Phase
Sideways Period: The market moved sideways for about 126 bars (~4 months) between roughly $7.5 – $12.5.
Higher Low: The recent low is slightly higher than the market bottom, indicating bullish pressure.
Key Technical Signals
Accumulation: Long sideways action after a bottom often signals accumulation by big players.
Breakout Potential: If price breaks above the $12.5–$13 zone with volume, it could trigger a strong rally.
Volume: Needs to see a surge in buy volume for confirmation of any breakout.
If price loses $7.15 support, it could retest much lower levels.
Market sentiment & news will play a big role here, not just technicals.
✅ Bullish Scenario: Hold above $9 and break $13 with volume → next targets $34.7 → $51.7.
❌ Bearish Scenario: Break below $7.15 → risk of extended downtrend.

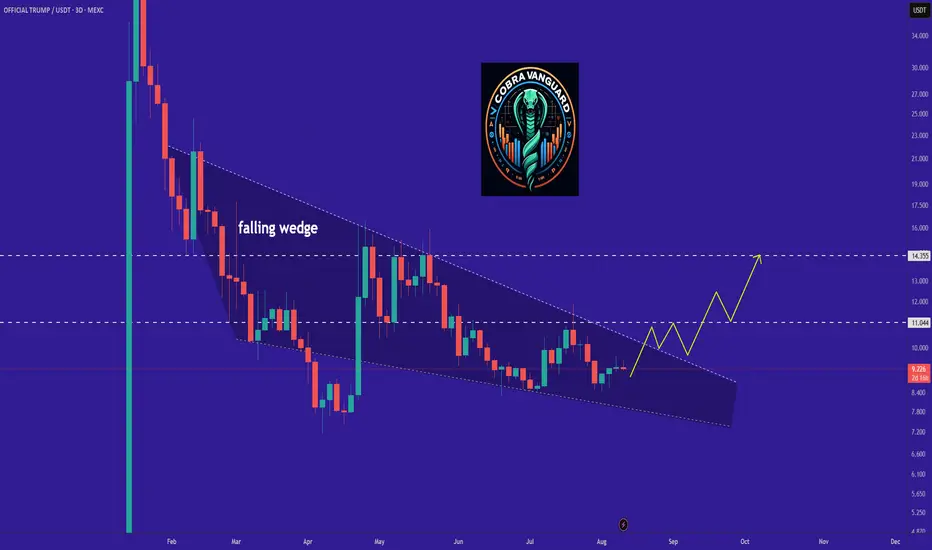
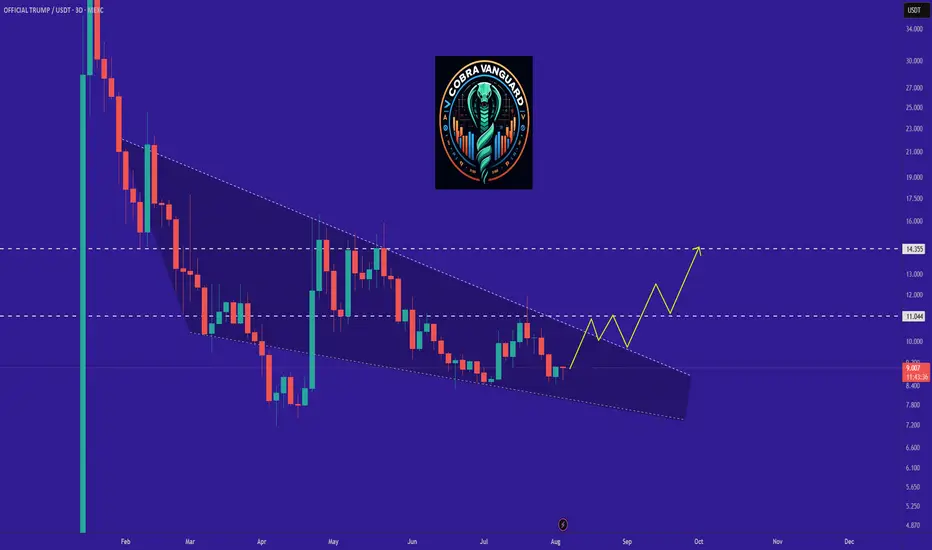
TRUMP is bullish now and many Traders don't see it !!So if you pay attention to the TRUMP chart you can see that the price has formed a Ascending wedge which means it is expected to price move as equal as the measured price movement.( AB=CD )
NOTE: wait for break of the WEDGE .
Best regards CobraVanguard.💚
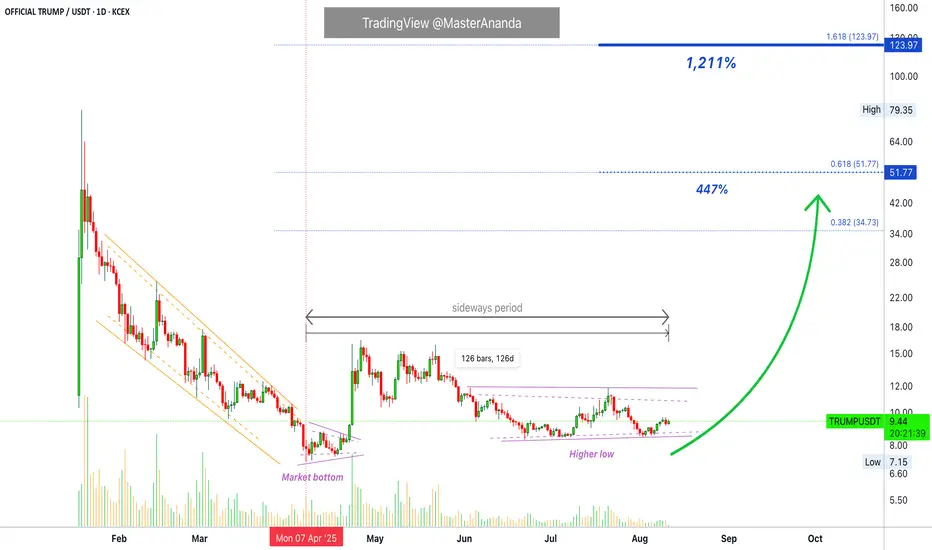
OFFICIAL TRUMP Updated · New Numbers, New Targets & 1,211%Hello my dear follower, it is my pleasure to write for you. I have an update on this memecoin, TRUMPUSDT, and you are going to like it.
Are you one of the many holding long-term?
Have you been able to do it?
What does it feel like?
Is it hard or was it an easy process?
The entire market is in the same situation; either consolidating or growing slowly.
Some pairs can be more advanced than ours but there is no difference if we are only willing to sell high. Some can be behind and catch up or even go beyond one that has been rising for months.
It is a mixed bag. It is better to plan and follow the plan. Opportunities are many and good but you have to make your choice. Your own choices, your own decisions, your results, your responsibility. We are all adults.
TRUMPUSDT has been sideways for four months and nothing changes. The longer this sideways period lasts the stronger the bullish wave that follows. We go straight to a bullish wave because we clearly have a higher low and we know Ether, XRP and Cardano are trading high up. The rest of the market will catch up.
The numbers on the chart have been updated. These are good and valid now and these numbers do not change. You can use it now and forever more they work long-term.
The levels on the chart are main resistance points. $35, $52 and $124.
It will be a nice rise.
It will be a strong rise.
Today the price can be $9.46, in just two months it can be $65. It can be more, it can be less.
There can be a two months long correction after a very strong wave of growth. After these two months long correction we get another advance, the famous bull run.
We are looking at bottom prices now, August 10 2025. It is already late.
It is early to buy, there is still time. But the market will not wait.
The wait is over.
Namaste.
$TRUMP (TRUMP) 6HPrice rejected from $9.60 and is now pulling back toward the $9.05 support zone.
Holding above this level could trigger a bullish reversal targeting $10.00 first, then $11.00.
Structure remains intact as long as $9.05 holds.
$TRUMP continues to benefit from strong social media traction and growing political narrative hype.

Price Analytics: $TRUMP's Potential Correction and Future RallyPossible Rebranding of an Existing Token: A Strategic Collaboration with the President
The recent announcement of the MEXC:TRUMPUSDT cryptocurrency has ignited discussions about its origin and its sudden rise to fame. Market data suggests that $TRUMP might not be entirely new but a rebranded version of an existing token. Historical price charts from exchanges like Gate.io and MEXC reveal trading activity for a $TRUMP-named token as far back as March 2024, long before the President’s public endorsement.
Rebranding an existing token in collaboration with a high-profile figure like the President offers several advantages:
Instant Market Hype: Association with a well-known personality generates massive publicity, attracting retail and institutional investors.
Enhanced Trust and Legitimacy: A presidential collaboration can shift market perception, making the token appear more credible.
Reviving Dormant Projects: Tokens with limited traction can leverage rebranding to reignite interest and trading activity.
If the MEXC:TRUMPUSDT token is indeed a rebranded project, its association with the President has proven successful, as evidenced by its meteoric rise in value to $72 shortly after the announcement.
Current Analysis:
The MEXC:TRUMPUSDT token is currently trading at $72, experiencing a surge due to its high-profile launch. However, considering historical data and market patterns, a price correction to the $37–$40 range is likely. This range aligns with the previous all-time high (ATH) of $37–$38 recorded on March 5, 2024.
Short-Term Projection:
If the token revisits its previous ATH, this retesting could act as a strong support level. Historically, price corrections to significant levels often precede larger upward movements, as they confirm market confidence in these levels.
Long-Term Projection:
Assuming the token completes the #5 Wave of the Elliott Wave cycle, it could potentially surpass the $100 mark. The Elliott Wave theory suggests that the fifth wave is often driven by strong market sentiment and euphoria, fueled by both technical and fundamental catalysts.
Conclusion:
While the MEXC:TRUMPUSDT token's current momentum is undeniable, investors should anticipate a near-term correction to $37–$40 before a rally beyond $100. This projection combines historical data, technical analysis, and the hype surrounding its rebranding and presidential collaboration. However, as with any volatile asset, investors should exercise caution and conduct thorough due diligence.

TRUMP - Tight Squeeze Huge R/R 50+, a bit of a wild card as in the pattern maybe still forming and developing. It appears to be bottomed, with supporting OBV (buying volume rising). I will take a 2x leverage on this one.
Entry - 10.924
Stop - 9.778
Interval 1 - 11.7
Interval 2 - 20.36
Target - 112.79
TRUMPUSDT – Daily Supply & Demand AnalysisTRUMPUSDT is showing signs of a bullish reversal after bouncing from the key demand zone around $7.20 – $7.80. Price is now pushing higher, with two major resistance levels ahead.
🔍 Key Observations:
Demand Zone: $7.20 – $7.80 (orange zone)
This zone has held multiple times and is fueling the current bullish momentum.
First Major Resistance: $12.23
A breakout above this level could accelerate the rally toward the next target.
Supply Zone: $15.00 – $15.74 (blue zone)
A strong historical resistance area where sellers may step in.
📈 Possible Scenarios:
Bullish Breakout – If price closes above $12.23, expect continuation toward $15.74.
Rejection – If sellers defend $12.23, price may pull back toward $9.50 or even retest the demand zone before attempting another breakout.
✅ Bias:
Medium-term bullish while price stays above $8.00, with a clear path toward $12.23 as the next major target.
Disclaimer: This analysis is for educational purposes only and not financial advice. Always manage your risk before trading.

TRUMPUSDt long turmA.o.A all,
Accroding to VSFA+ Trump is dump toO😯🤗, so becarefull & wait when price tuch 5.50$ then buy some Trump coins and ready for 1st pump near 10$ in sha Allah, after that i update whatscoming up next accroding to VSFA+ Golden stratgy 🇵🇰
. . . . . . . . . . . . . . . . . . . . .


Trump Coin Wave Analysis – 8 August 2025
- Trump Coin reversed from the support area
- Likely to rise to resistance level 10.75
Trump Coin recently reversed from the support area between the support level 8.440 (lower border of the sideways price range inside which the price has been moving from June) and the lower daily Bollinger Band.
The upward reversal from this support area stopped the previous short-term ABC correction ii from last month.
Given the strongly bullish sentiment seen across the cryptocurrency markets, Trump Coin can be expected to rise to the next resistance level 10.75 (upper border of the active sideways price range).

trump/usdt=Trump/USDT Analysis.
= The analysis is based on trend analysis, support and resistance levels, and price action.
= We need a breakout of the trend to begin the upward movement toward the targets.

Trump/USDT -DOGE mirror 2021TRUMP/USDT is shaping up with a structure that closely mirrors DOGE/USDT’s 2021 price action just before its explosive rally. After an extended period of accumulation and liquidity sweeps, TRUMP appears to be entering the final phase of consolidation — the calm before the storm.
With growing attention, solid community backing, and price behavior aligning with historic meme coin cycles, the setup suggests we could be on the verge of a parabolic breakout.

Buy opportunityThere is a clear W formation on a bigger scale and the buy signal confluence of a small w after the descending channel.
TP1 and TP2 have been indicated.

TRUMP is bullish now and many Traders don't see it !!So if you pay attention to the TRUMP chart you can see that the price has formed a Ascending wedge which means it is expected to price move as equal as the measured price movement.( AB=CD )
NOTE: wait for break of the WEDGE .
Best regards CobraVanguard.💚
Trumpcoin short to $8.292Just now opened up a short position on Trumpcoin. Market is low and soon I anticipate reversal to the upside but not just yet. Based on my DTT analysis market is likely to make new lows ago.
Sl: $8.745
Time sensitive