Lingrid | TRXUSDT Flag Pattern Breakdown Continuation SetupBINANCE:TRXUSDT perfectly played out my previous trading idea . Price lost its bullish continuation after price slipped below the trendline and failed to hold the flag structure. The recent lower high confirms weakening demand, while the break beneath the mid-range support signals a transition from corrective pullback into renewed downside pressure. Momentum now favors sellers, with price struggling to reclaim the broken structure.
The current reaction zone around 0.283–0.285 acts as pivotal resistance. As long as price remains capped below this level, downside rotation toward the 0.270 support area looks increasingly likely. That zone aligns with prior demand and the lower boundary of the broader structure, making it the next technical magnet.
➡️ Primary scenario: rejection below 0.285 → continuation down toward 0.270
⚠️ Risk scenario: sustained reclaim above the trendline revives upside attempts toward 0.300
If this idea resonates with you or you have your own opinion, traders, hit the comments. I’m excited to read your thoughts!
Trade ideas

TRXUSDT 1D#TRX has broken above the falling wedge on the daily chart. The RSI and MACD both suggest continued upward momentum, but for now, #TRX is facing the daily SMA50. In case of a breakout above the SMA50, the potential targets are:
🎯 $0.3075
🎯 $0.3188
🎯 $0.3301
🎯 $0.3462
🎯 $0.3667
⚠️ Always remember to use a tight stop-loss and maintain proper risk management.

TRX Breakdown Incoming? This Trendline Retest Could Be the FinalYello Paradisers, could this be the final warning before #TRX breaks down completely? Or is the market setting up for a savage fakeout that will trap late sellers and then rip higher?
💎#TRXUSDT is currently retesting the ascending trendline after pulling back from the supply zone around $0.2820, a level that has consistently acted as strong resistance. Price action remains within a clearly defined ascending channel, with the lower trendline still providing solid technical support; however, momentum is beginning to shift. The MACD is starting to show signs of developing bearish pressure, supporting the likelihood of a potential downside continuation in the short term.
💎If the current retest fails and confirms a rejection from this supply zone, the probability of a move lower increases significantly. In that case, the price could first target the minor support around $0.2720, and if selling pressure continues, we would be eyeing the stronger support zone near $0.2660 as the next key level to watch. On the flip side, a confirmed breakout above $0.2900 would completely invalidate the bearish setup and instead favor a bullish reversal scenario, opening the door for a more aggressive leg up.
💎Right now, the market structure presents a clean and high-probability short setup. The risk is clearly defined above the $0.2820 supply zone, and if the rejection confirms, the setup offers a very favorable risk-to-reward ratio for disciplined traders.
Trade smart, Paradisers. The market is never generous for long, and only those who combine strategy with discipline will reach the winner’s circle.
MyCryptoParadise
iFeel the success🌴

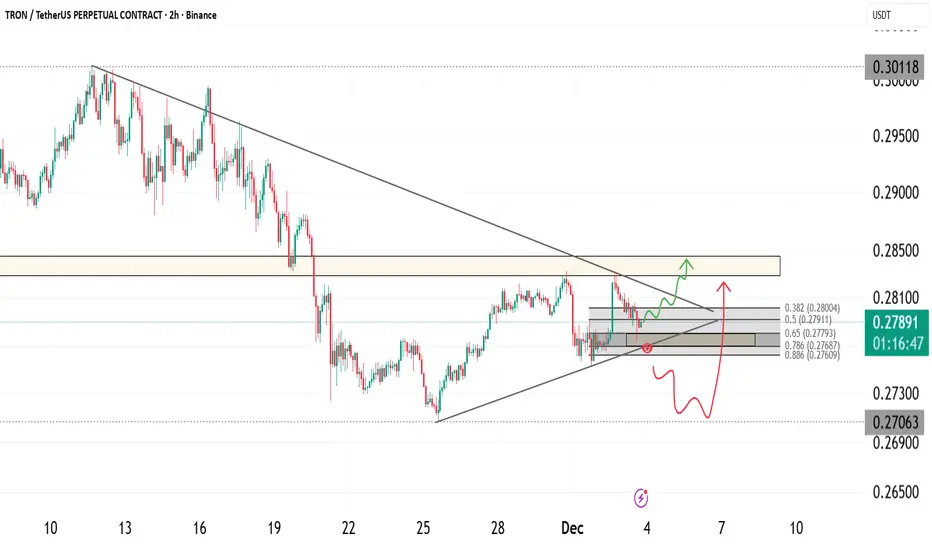
TRX Approaching Key Breakout Zone as Structure TightensTRX is approaching a critical decision point inside a compressing structure where price is being held between diagonal resistance and a rising support line. The market has printed a clean series of higher lows while repeatedly testing the same resistance, suggesting growing pressure beneath the price.
The current reaction inside the grey fib zone shows that buyers are active, and as long as this support holds, TRX can attempt another push into the supply region highlighted above. The behaviour inside this zone will determine whether price continues upward or rejects for a deeper pullback.
The zone around 0.282 to 0.286 is the important breakout region to watch. If price reclaims it, momentum can shift upward rapidly toward the next liquidity pockets.
Key Notes
• Price is compressing into an apex between support and diagonal resistance
• Fib retracement region is holding as intraday support
• Liquidity sits above the 0.282 to 0.286 supply region
• Higher lows suggest accumulation behaviour
Bullish Scenario
If TRX continues to hold the fib support and breaks above 0.282, the structure opens room for a move toward the upper supply zone with potential follow through.
Bearish Scenario
Failure to hold the grey support region can push price back to retest the lower trendline around 0.270.
Invalidation
A clean break and continuation below 0.270 invalidates the bullish setup and delays any potential breakout.
Simple explanation
TRX is squeezing into a decision point. Holding support gives it room to break out. Losing support sends it back to the lower trendline. Watch how price behaves around 0.282 because that level decides everything.
TRXUSDT Chart Analysis 12-Dec-25Stop Loss: 0.2706
Buy Stop: 0.3015
Take Profit 1: 0.3333
Take Profit 2: 0.3645
A Falling Wedge pattern has formed within the recent bearish structure, accompanied by a clear bullish RSI divergence, indicating a potential trend reversal. If the price breaks above the Buy Stop level at 0.3015, it may confirm bullish momentum, with expected targets at 0.3333 and 0.3645.
⚠️ Always remember to protect your capital with a proper stop-loss and disciplined risk management.

TRX: Bullish with high confidenceHey guys, let's break down what's happening with Tron on the 1-hour timeframe because we're seeing some textbook oversold conditions that could set up a solid mean reversion play.
TRX is currently trading at $0.2772, down 1.29% over the last 24 hours and sitting dangerously close to the daily low at $0.2767. The price action has been grinding lower throughout the session, but what's really catching my eye is the confluence of extreme oversold readings across multiple momentum oscillators. RSI has crashed to 19.2, Stochastic is pinned at 9.7, and Money Flow Index is absolutely wrecked at 11.3 - these are capitulation-level numbers that we don't see every day.
When you get RSI below 20 and Stochastic under 10 simultaneously, you're typically looking at selling exhaustion rather than the start of a fresh breakdown. The ADX reading of 59.1 confirms we're in a strong trending environment, but here's the thing: strong trends paired with extreme oversold conditions often mark the final flush before a bounce. Price is literally kissing the lower Bollinger Band at $0.2766, which has been acting as a technical support floor. The 4.5% lower wick on recent candles tells us buyers are already starting to defend these levels, even if hesitantly.
From a moving average perspective, the picture is clearly bearish. TRX is trading below the EMA20 ($0.2795), EMA50 ($0.2811), and EMA200 ($0.2825), with a confirmed lower high formation that validates the downtrend structure. The HMA55 sits at $0.2795, creating a resistance cluster right around that EMA20 level. This convergence zone between $0.2795 and $0.2801 (Bollinger middle band) is going to be your first major hurdle on any bounce attempt. The MACD remains bearish with the histogram negative (MACD at -0.0011, Signal at -0.0008), so we're definitely fighting against the prevailing momentum here.
But here's where it gets interesting: volume analysis is showing a completely different story. Current volume sits at just $3.26M compared to the 24-hour average of $8.43M - that's only 39% of normal activity. When you see price making new lows on significantly below-average volume, it's a red flag that the move lacks conviction. Sellers aren't piling in with force here; instead, we're seeing passive drifting lower, which often precedes reversals. The 24-hour volume of $64.7M is decent, but the intraday weakness in participation suggests this decline is running on fumes.
Let's talk support and resistance levels because these are critical for framing any trade setup. Immediate support is the 24-hour low at $0.2767, which coincides almost perfectly with the lower Bollinger Band at $0.2766. This is your line in the sand - hold here and we're looking at a bounce; break below with volume and the oversold condition could extend further (though that seems less likely given current momentum exhaustion). On the upside, first resistance is that EMA20/HMA55 cluster at $0.2795, followed quickly by the Bollinger middle band at $0.2801. These levels will likely act as magnets for any mean reversion move.
Beyond that initial resistance zone, the EMA50 at $0.2811 and EMA200 at $0.2825 represent more substantial barriers. The EMA200 in particular is significant because it's been capping rallies and would mark a full retracement of today's decline. The 24-hour high at $0.2834 sits just above that and represents the upper boundary of today's range - breaking above that would flip the short-term structure and potentially signal a trend reversal rather than just a bounce.
For a trading setup, I'm favoring a counter-trend long position here with tight risk management. Entry zone would be in the $0.2770 area, essentially current price levels while we're testing support. Your stop loss needs to be tight given we're fighting the trend - I'd place it below $0.2760 to give about 10 pips of breathing room below the support cluster. That's roughly a $0.001 risk per unit. Take profit targets would be layered: TP1 at $0.2795 (EMA20/HMA55, about 2.5:1 RR), TP2 at $0.2801 (Bollinger middle band, about 3:1 RR), and TP3 at $0.2825 (EMA200, roughly 5.5:1 RR) for those wanting to ride extended bounces.
The risk-reward here is favorable if you're disciplined with your stops. This isn't a high-conviction trend-following setup - it's a tactical mean reversion play based on extreme oversold conditions and weak selling volume. The confidence level sits around 73%, which reflects the fact that we're trading against the prevailing trend but with strong technical justification from momentum indicators. You're essentially betting that the rubber band has stretched too far and needs to snap back toward the mean.
One scenario to watch: if we do get that bounce to the $0.2795-$0.2801 zone and price gets rejected hard with increasing volume, that would actually be a great short setup for continuation lower. But right now, at these oversold levels with price testing support, the path of least resistance for a short-term move appears to be up rather than down. The bearish structure remains intact on higher timeframes, so this would be a scalp rather than a swing trade - get in, take profits at resistance, and don't overstay your welcome.
What are you thinking on this setup? Are you comfortable fading this weakness for a bounce, or would you rather wait for confirmation above $0.2795 before getting involved?

TRX/USDT — Long-Term Trendline Test: Bounce or Breakdown?TRX has maintained a multi-year higher-high, higher-low structure, making it one of the most stable altcoins in a volatile market cycle. But now, price is sitting directly above the primary ascending trendline — the same trendline that has supported TRX’s entire bullish expansion since early 2023.
This weekly zone is a major decision point:
Will TRX extend its long-term bullish structure, or will it break down and enter a deeper correction phase if the trendline and the $0.212 support fail?
---
The long-term uptrend remains intact as long as the trendline holds.
The price is currently retesting the trendline — a zone that historically triggers strong reactions (powerful bounce or sharp breakdown).
The horizontal level at $0.212 acts as the critical structural support.
Current movement looks like a healthy pullback, not a full reversal (unless the trendline breaks).
---
📈 Bullish Scenario — “The Continuation Rally”
If TRX successfully holds the trendline and forms a bullish reaction, the next leg of the uptrend may begin.
Bullish Confirmation Signals:
Strong weekly close above the trendline
Bullish reversal candle (pin bar, hammer, or engulfing)
Increase in buy volume during the trendline retest
Bullish Targets:
1. $0.32 – $0.35 → first resistance zone
2. $0.45 → major 2025 peak
3. Break above $0.45 → potential long-term price discovery
Bullish Narrative:
“As long as the trendline holds, this is not a correction — it’s a refueling phase before the next rally.”
---
📉 Bearish Scenario — “Trendline Breakdown Phase”
If TRX loses the trendline on a weekly close, the long-standing bullish structure may break for the first time since 2023.
Bearish Confirmation Signals:
Weekly close below the trendline
Retest of the trendline turning into resistance
Weekly close below $0.212 → full structure breakdown
Bearish Targets:
Deeper correction into the next major demand zones
Larger volatility due to long positions liquidating below the trendline
Bearish Narrative:
“A trendline breakdown is not a pullback — it signals a structural reversal.”
---
📌 Pattern Summary
Primary Pattern: Long-term rising trendline
Current Phase: Controlled weekly pullback
Possible Outcomes:
Bull Flag continuation (if price bounces)
Trendline Breakdown (if price closes below support)
---
🎯 Final Conclusion
TRX is positioned at a critical structural level where the market will decide between a continuation of the multi-year uptrend or a macro correction phase.
The next few weekly candles will be decisive.
---
#TRX #TRXUSDT #CryptoAnalysis #TechnicalAnalysis #Trendline #WeeklyChart #Altcoins #BullishScenario #BearishScenario

TRX/USD — Trying to Break the Downtrend TRX/USD has been under pressure since August, losing up to 26%, yet compared to other L1 assets the decline remains relatively mild. Over the past weeks, the pair stabilized around 0.27, forming a minor rebound structure. The key question now: can TRX reclaim its trend, or is this just a relief bounce?
⸻
Market Structure
Price reacted to the 0.272 support zone again, while on-chain metrics show improving fundamentals:
• Total Tron accounts exceed 350M
• Perp DEX volume on Tron surged 271% in November
• Stablecoin market cap on Tron reached $80B, near ATH
TRX remains the dominant network for USDT flows — an upside catalyst if risk appetite returns.
A confirmed trend reversal requires a breakout above the 20-day EMA, followed by a push toward 0.289 (Supertrend resistance). Failure to hold 0.277 risks another retest of 0.272.
⸻
Bullish Levels
0.289 • 0.293–0.298 • 0.305 • 0.319–0.326 • 0.334 • 0.354–0.362 • 0.369
A break of 0.293–0.298 is the key to unlocking bullish momentum — this zone clusters the 50 EMA, 38.2% Fib, and 200 EMA.
Above it, the next pivot is 0.319–0.326, followed by 0.334, and the Golden Pocket at 0.354–0.362, which is the maximum realistic upside in the coming weeks unless macro conditions flip risk-on.
⸻
Bearish Levels
0.278–0.271 • 0.261–0.258 • 0.240 • 0.225–0.212
Below the 20 EMA, downside pressure persists. A break below 0.271 would reopen a slide toward 0.258 (23.6% Fib).
Further bearish momentum targets 0.240, and then the macro support 0.225–0.212, which held from January–April 2025.
Given Tron’s relative strength, a return to yearly lows remains unlikely unless Bitcoin makes fresh cycle lows.
⸻
Indicators
• Daily RSI: bullish divergence — supporting recovery
• Weekly RSI: recently flashed a sell signal, invalidated only above the 20-day EMA
• Monthly RSI: cooling off but still holding above neutral — long-term structure remains intact
⸻
Bias: Neutral → Bullish above 0.293; Bearish below 0.277
Critical Reversal Zone: 0.293–0.298
Key Support: 0.272
Breakout Target: 0.319–0.326 and 0.354–0.362
Breakdown Target: 0.258 and 0.240

FireHoseReel | TRX Technical Outlook After Resistance Break🔥 Welcome to FireHoseReel!
Let’s jump into the TRX market structure analysis.
👀 TRX – 4H Overview
TRX has successfully broken above the $0.2824 resistance and is now pushing higher.
Over the past 24 hours, TRX trading volume has dropped by 20%.
📊 Volume Analysis
Watch the volume closely on the chart. Every time price previously reached $0.2824, it faced strong sell pressure and sell orders were heavily filled.
On the third and current test, fewer sell orders were present, and with a slight increase in volume, this resistance was finally broken.
✍️ TRX Trading Scenarios
Below are the active scenarios you can use alongside your trading strategy:
🟢 Long Scenario
Since TRX has broken this resistance, you can enter a long position, placing your stop-loss below the current low.
Alternatively, wait for better consolidation above this level and enter on the pullback for a safer setup.
🔴 Short Scenario
A break below the $0.2791 support, accompanied by strong selling pressure, could lead to a deeper drop and offers a valid short setup.
🧠 Protect your capital first. No setup is worth blowing your account. If risk isn’t controlled, profit means nothing. Trade with rules, not emotions.

Tron (TRX): Important Trend Holder Has Been Broken | 200EMATRX has been respecting its trend for a long time, but now we finally got a clean breakdown of that structure. Buyers tried to re-secure the zone, but so far the reaction isn’t convincing.
Right now the chart favors the sell side — unless buyers manage to reclaim the EMAs and push back above the broken zone, the ideal setup remains a short from current levels.
If the retest fails again, continuation lower becomes the most likely scenario. We’ll stick with the plan and wait for the setup to fully play out.
Swallow Academy

TRX/USDT BREAK OUT I'm looking for Tron to break out to the upside shortly. Currently at a crucial support level and breaking out of the down trend. If we can get above the EMAs, I see a big bounce to the upside.

Trxusdt long setupIf you backtest the entire history of TRXUSDT using Smart Honey 2.0, you will see that there were 4 similar situations. From this, I conclude that TRX price will rise to the yellow line in the near future
Settings for smart honey 2.0
tp = 1.5
sensitivity = 2.7

Long trade
15min
📘 TRXUSDT.P – Trade Journal Entry (15-Min Chart)
Sat 22nd Nov 25 — 3:00 pm — NY Session PM
Buyside Trade
🟦 TRADE SUMMARY (Tab 1 — Blue)
Pair: TRXUSDT.P
Direction: Buyside Trade
Date: Sat 22nd Nov 25
Time: 3:00 pm
Session: NY Session PM
Timeframe: 15m
🟩 TRADE PARAMETERS (Tab 2 — Green Transparent)
Entry: 0.27588
Profit Level: 0.27784 (+1.52%)
Stop Level: 0.27352 (–0.13%)
Risk-to-Reward: 11.56 R
30min
🟨 MARKET CONTEXT & STRUCTURE
1. Trend Context
TRX recovered from a heavy markdown cycle seen on the 30m structure.
The 15m chart shows a micro accumulation zone beneath the 200 EMA, then a displacement above the structure. NY PM session creates a clean shift in order flow, reclaiming: The NY AM high, the FVG left during the earlier breakdown and the intraday session midpoint
2. Key Structure Points
BOS at 0.2754 marks a bullish transition.
The 50 EMA flips upward and crosses the 200 EMA — momentum confirmation.
Series of higher lows formed after the BOS → clear buyside continuation model.
🟪 LIQUIDITY
Sell-Side Liquidity Removed
Liquidity swept below 0.2738, creating a final inducement.
NY PM grabs sell-side beneath the Asian and London session lows.
This clears the path for Algorithmic Repricing.
Buyside Liquidity Targets
First cluster at 0.2775–0.2780
HTF resistance levels at 0.2795–0.2802
TP lands inside the first premium inefficiency.
Liquidity Narrative Summary
Sweep → Displacement → FVG → OB Tap → Expansion (buyside model)
🟧 ICT MODEL BREAKDOWN
Model Used: Sell-Side Sweep → BOS → FVG → PD Array → Buyside Delivery
1. Inducement
London + Tokyo lows + NY early lows all swept before entry.
2. Displacement
Strong bullish displacement candle breaks above the 0.27540 BOS level.
3. Entry Type
Entry sits directly inside a:
Bullish FVG
Discount Retracement (OTE zone)
Order Block Retest
Aligned with session timing (NY PM)
4. Target Logic
TP hits first internal buyside inefficiency.
Secondary targets remain valid at 0.2795–0.2810.
🟫 WYCKOFF ALIGNMENT
Phase TRX Reaction
Phase A Selling climax & AR
Phase B Accumulation under 50/200 EMA
Phase C Spring: final liquidity sweep at 0.2738
Phase D SOS + LPS zone (Entry 0.27588)
Phase E Markup into buyside targets
🟩 VOLUME & CONFIRMATION
Volume spikes confirmed the BOS.
Retracement into FVG shows volume tapering → bullish absorption.
No heavy sell volume returned — confirming algorithmic buy program.
🟥 OUTLOOK / CONTINUATION
If TRX holds above 0.2750–0.2753, further markup remains likely.
Extended upside zones:
0.2800
0.2820–0.2830
Invalidation: Break below 0.2734 kills the buyside idea

CLOSE THE POSITIONthe bubble is getting emptied and we cannot risk staying in the position.
im closing the position so should you i will explain the reason:
the chart till now had to start moving , since it didnt this means the bubble of over sold has been emptied and now the market is most likely to continue moving downwards or upwards but the probability of our sl being hit is more likely now thats why we should close the position.
stay focused
stay sharp
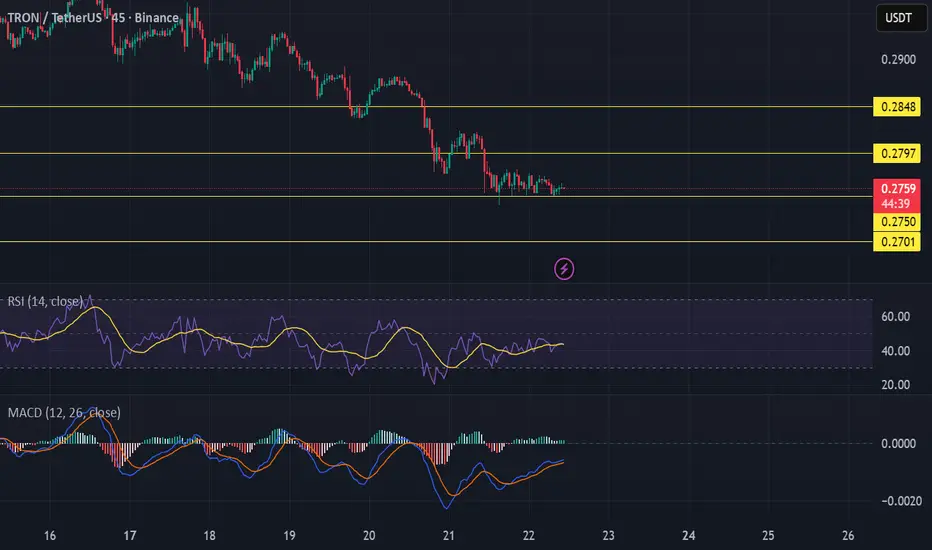
SIGNAL TRXUSDT LONG position
USE 1:1 RR ratio
SL.0.2701
you can close on 0.2848
or we can wait to see how far it can go
but in that case you gotta follow me so we move up the sl step by step
lets hunt it

Short trade
📘 Trade Journal Entry — 30min
Asset: TRXUSDT
Timeframe: 30min TF overview
Model: Distribution → liquidity sweep → Sell-Side Continuation
Bias: Bearish
Session: NY PM
Entry: 0.29024
Stop: 0.29301 (0.95%)
Target: 0.27907 (3.84%)
RR: 4.03
📉 TRXUSDT.P – Full Technical & Sentiment Breakdown
(30-Min Chart Context) 1. Higher-Timeframe Bias (Market Structure & Liquidity)
🔹Price is trading below the major reaccumulating range midpoint, showing inability to sustain above 0.2950–0.3000, which acts as a structural ceiling.
🔹The macro flow is distribution → liquidity sweep → signalling sell-side continuation.
🔹A consistent pattern of London + NY session highs being swept, followed by sharp reversals confirms algo-driven sell-side narrative.
🔹Directional Bias: Sell-side, targeting inefficiencies and unmitigated demand below 0.2850 and 0.2780.
📌Pattern Seen Across All 3 Trades
Tokyo prints inducement + creates the manipulation range.
London sweeps liquidity (Buy-side taken).
NY delivers displacement downwards (Sell-side model).
🔴Sentiment
TRX market sentiment turned risk-off during NY session, syncing with liquidity hunt behaviour.
Late NY session often gives the strongest liquidity dumps. TRX showed rotation out of altcoins into dominant BTC pairs. Macro crypto sentiment: risk-off → supporting deeper drawdown.
🧭Summary
The TRXUSDT sell-side setup price seems to be forming a clear session-based distribution model type, sweeping London highs before NY delivered displacement to the downside. Each entry aligned with bearish FVG retests, breaker block confirmations, and declining volume on pullbacks. Sentiment across the crypto market turned risk-off, fuelling deeper sell-side delivery into untouched inefficiencies and liquidity pools below

TRON: an inverse Head and Shoulders Hi!
Trend Overview:
The chart shows a prolonged downtrend, highlighted by the steady descending trendline. Price has been making lower highs and lower lows, consistent with a bearish market structure.
Trendline Break:
Recently, a shorter-term descending trendline was broken to the upside, signaling potential bullish pressure and a shift in momentum.
Pattern Formation:
A classic inverse head and shoulders pattern has formed:
Left Shoulder: 0.2900 level
Head: 0.2765 level
Right Shoulder: ~0.2920 level
This pattern suggests a potential reversal from the prior downtrend to an upward move.
Target Zone:
The target of the head and shoulders pattern is marked around 0.3140–0.3180, representing the measured move from the head to the neckline. This is a key resistance zone where sellers might appear.

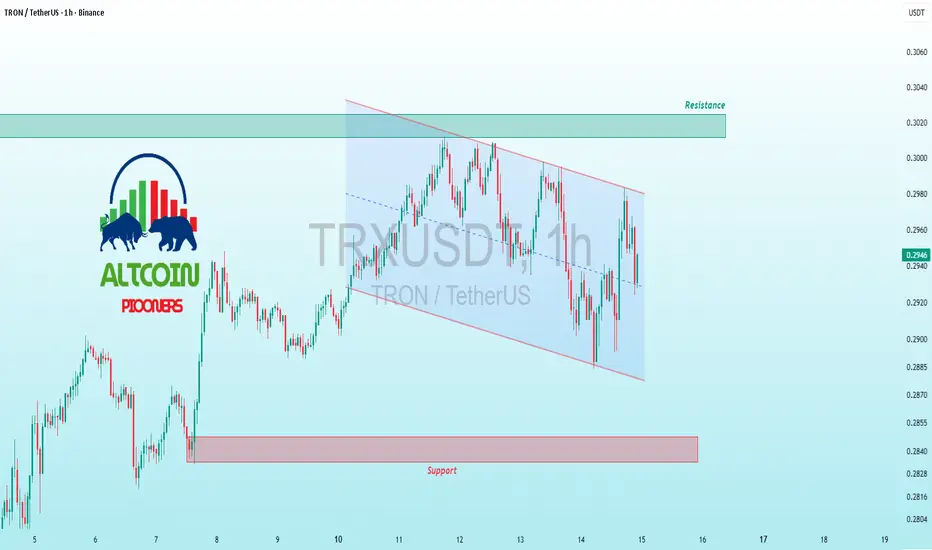
$TRX Tron’s Tightrope – Support Snap or Channel Escape?BINANCE:TRXUSDT CRYPTOCAP:TRX Tron’s Tightrope – Support Snap or Channel Escape?
Altcoin Pioneers! 🌐 TRX/USDT 1H is hugging that black descending channel lower boundary, price dipping to probe support at ~0.288 after a clean rejection at resistance 0.300. TRON's utility play shining through the noise, but macro headwinds keep the lid on – volume's muted, signaling caution.
Hold support? Bullish bias if it bounces with conviction; oversold RSI at 28 begging for relief. Breakout above resistance? Tease of upside to 0.305 on DPoS buzz, but needs >0.302 close. Deeper dip risk? Elevated – breach targets 0.282 (channel extension), altcoin drag.
Target: Mild pop to 0.295 if holds, probe 0.285 on fail. Tracking: MACD histogram flatten, Fibonacci retraces for confluence, and TRX/BTC for pair weakness. Tron on! ⚡📊
#TRX #TronNetwork #CryptoTA

TradeCityPro | TRX Pressured at Key Breakdown Level👋 Welcome to TradeCityPro!
In this analysis, I want to review the TRX coin, one of the oldest projects in the crypto space, with a market cap of $27.65 billion, currently ranked 8th on CoinMarketCap.
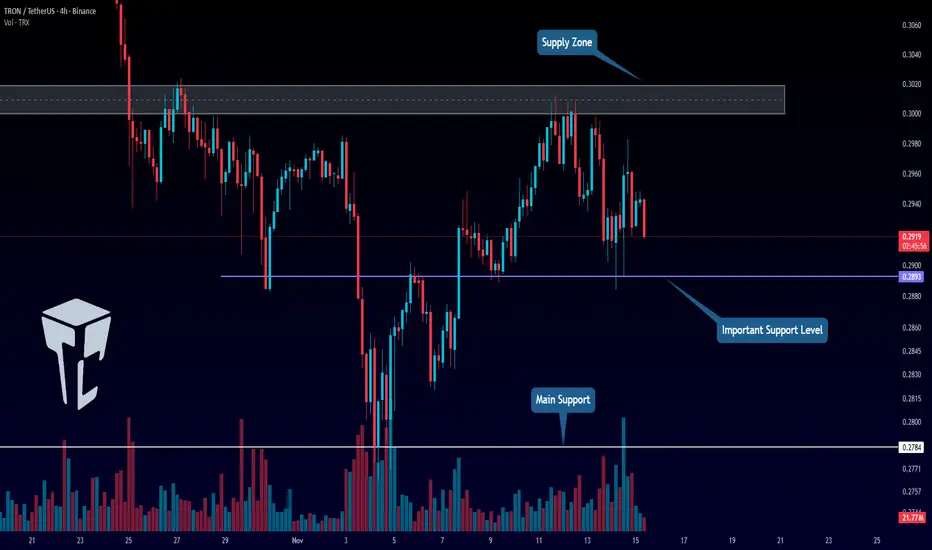
⏳ 4-Hour Timeframe
On this timeframe, as you can see, TRX is facing a very strong resistance zone, from which it has recently been rejected and has started a minor correction.
⭐ The support level currently holding this coin is at 0.2893, and during this correction phase, the price has already tested this level several times with long wicks.
✔️ At the moment, the price is hovering close to this support zone.Breaking below 0.2893 could serve as a solid short trigger.
🎲 The next support zone, if 0.2893 breaks, is around 0.2784, which can be used as the target for the short position.
💥 For long positions, the current trigger is the breakout of the resistance zone. A successful breakout above this area could mark the start of a new bullish trend for TRX.
📝 Final Thoughts
Stay calm, trade wisely, and let's capture the market's best opportunities!
This analysis reflects our opinions and is not financial advice.
Share your thoughts in the comments, and don’t forget to share this analysis with your friends! ❤️
$TRX Channel Compression Nearing Support BreakdownBINANCE:TRXUSDT CRYPTOCAP:TRX Channel Compression Nearing Support Breakdown
TRX coiling in descending channel, probing support at $0.285 after rejection at $0.30 resistance.
Hold here for rebound to $0.305 target; break risks dip to $0.27.
RSI neutral but flattening, MACD bearish crossover, low volume hints at volatility spike. 📊🔻
#TRX #CryptoTrading #AltcoinUpdate
$TRX Trendline Tug-of-War – Support Showdown?BINANCE:TRXUSDT CRYPTOCAP:TRX Trendline Tug-of-War – Support Showdown?
Current trend: TRX's respecting the descending trendline from 0.31 highs, now probing the 0.291 support amid BTC bleed—sellers probing, but low-volume wicks scream buyer lurking 🛡️.
Hold support? High conviction yes; confluence with 50 EMA and prior lows positions for a clean defense.
Breakout above resistance? Bullish if 0.303 closes above trendline—could spark 4-6% rip to 0.315 🚀.
Dip risk? Capped at 0.285 on weak hold, with oversold preventing cascade.
Target: Short-term 0.305 on bounce; extended 0.32 with momentum.
Indicators tracking: RSI (40, neutral bounce), Trendline slope, and Stochastic oversold 📊.
#TRXTrading #CryptoSupport #AltcoinPioneers

$TRX Steady Support Hold – Breakout on Horizon?BINANCE:TRXUSDT CRYPTOCAP:TRX Steady Support Hold – Breakout on Horizon?
Current trend: TRX is consolidating post-pump, defending the 0.285 support zone after a clean rejection at 0.303 resistance—low volatility with bullish doji tails showing accumulation strength 🛡️.
Hold support? Affirmative; volume on greens and price stability confirm buyers in control, unlikely to breach without BTC dump.
Breakout above resistance? High setup if 0.303 flips—expect 4-6% pop to retest highs 🚀.
Dip risk? Minimal to 0.28, cushioned by 50 EMA confluence.
Target: Near-term 0.31 on confirm; longer 0.32 with volume.
Indicators monitoring: Stochastic (rising from oversold), EMA stack bullish, and OBV uptick 📊.
#TRXTrading #CryptoConsolidation #AltcoinPioneers

$TRX Steady Support Hold, Breakout Setup Forming?BINANCE:TRXUSDT CRYPTOCAP:TRX Steady Support Hold, Breakout Setup Forming? 📊⚡
TRX's 1H trend leans bullish, firmly testing and bouncing off main support at ~0.292 amid decent volume—clear buyer defense!
Strong chance to maintain here, with breakout above 0.30 resistance eyeing 0.31 target next. Deeper dip risk low (monitor 0.29), but use tight stops.
Tracking RSI ~54 (neutral uptick), 20 EMA as dynamic support, and MACD histogram gaining steam.
TRX momentum building! 🚀
#TRX #CryptoTrading #AltcoinRise
