Aecon Group Inc. (TSX: ARE) — Swing Trade💰 Aecon Group Inc. (TSX: ARE) — Swing Trade Breakdown
Chart Date: Nov 13, 2025
RSI(2): 3.11 (deep oversold signal)
🏢 Company Snapshot
Aecon Group is one of Canada’s leading infrastructure and construction companies — active in transportation, utilities, and industrial projects. The stock has been trending higher since mid-2024, supported by strong backlog growth and resilient margins in public and energy projects.
📈 Fundamentals
Valuation remains moderate with a P/E around 9×, a healthy 3.4% dividend yield, and a manageable debt-to-equity ratio near 0.6. Free cash flow and liquidity are solid, positioning Aecon to capitalize on new government-funded infrastructure spending. Fundamentally sound and cash-generative — ideal for steady accumulation during pullbacks.
🔍 Technical Setup
ARE recently pulled back from its October peak near CAD $35 to test the 50-day moving average around $27–28, printing a strong RSI(2) oversold reading at 3.11 — historically a high-probability bounce zone on this ticker.
Price remains above the 200-SMA (~$21), confirming a sustained uptrend. Volume has stabilized after the post-earnings surge, showing orderly profit-taking rather than panic.
The pattern resembles a textbook pullback within an ongoing uptrend, where previous “BUY” signals at the 50-SMA have consistently led to multi-week rallies.
🎯 Trade Plan
Entry Zone: $27.00 – $27.50, near 50-SMA and RSI(2) signal confirmation.
Stop Loss: $25.80, below the 50-SMA and recent swing low.
Target: $31.50 – $33.00, near prior resistance and measured-move projection.
Risk/Reward: ~2.5× potential return to risk.
Aggressive traders may scale in at current levels; conservative traders can wait for a bullish reversal candle or reclaim of $28.00 with uptick in volume.
🧠 Swing Trader’s View
Aecon is in a bullish intermediate trend with short-term oversold momentum. RSI(2) at 3.11 is one of the lowest readings of 2025 — typically preceding a relief rally. As long as price holds above $26.00, the 50-SMA should act as dynamic support.
This setup aligns with prior buy triggers seen earlier in the trend (August and September), both leading to strong continuation swings.
💡 Outlook (Next 1–3 Weeks)
Expecting a technical rebound toward $31+ if the 50-SMA holds.
Favouring a buy-the-dip swing targeting mid-November strength — confirmation comes with an RSI(2) cross back above 10 and volume expansion off the 50-day line.
Aecon Group Inc.
No trades
Market insights

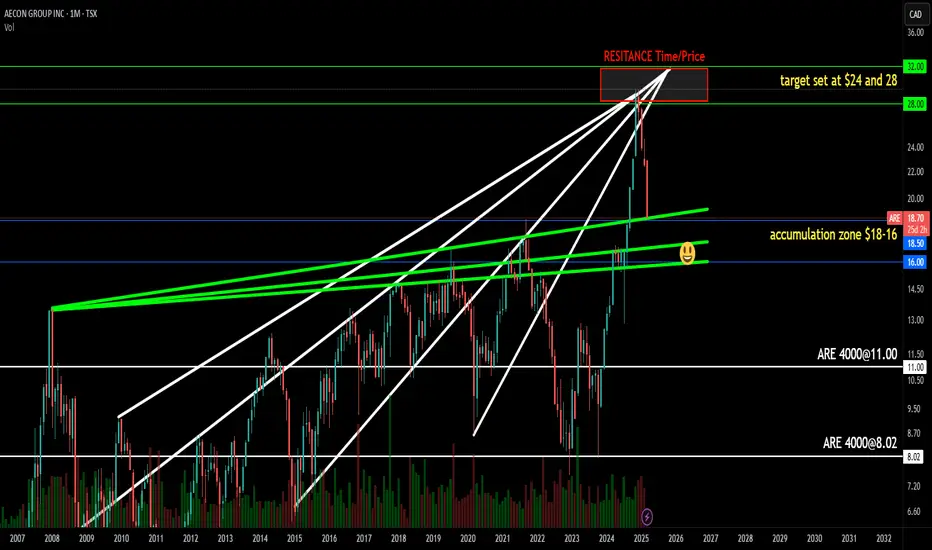
ARE - Dip BUYThere are not too many opportunities like these but I feel we are in for some choppy times this year before the final higher of the 2025 cycle. This is one of them!

ARE Earning pop.Somebody liked ARE earning. Nice breakout on volume. Like to wait for pull back and hold of breakout point before entry.
