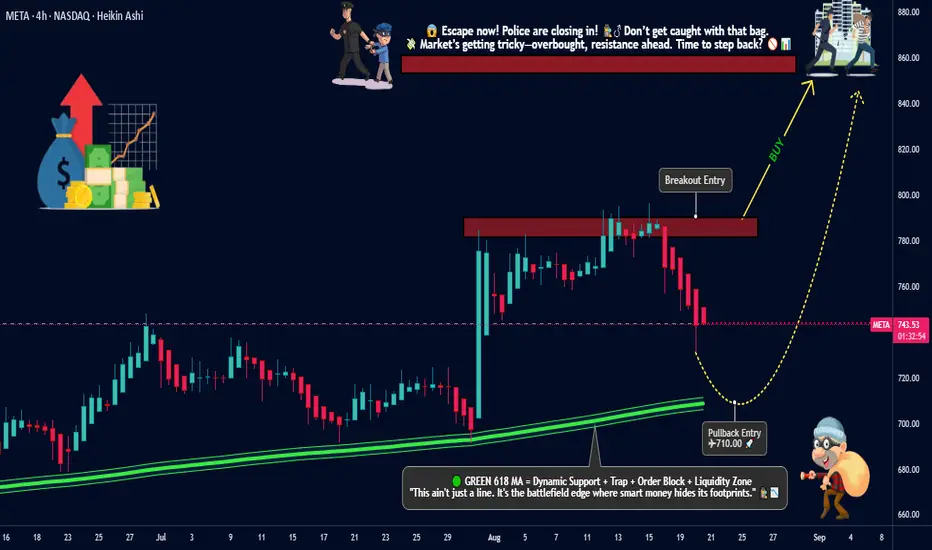
META Platforms Inc. Heist: Breakout Loot vs Pullback Entry🚨META Platforms Inc. Stock Heist Plan🚨
💎Asset: META Platforms Inc. (Swing Trade Robbery)
💎Plan: Bullish Break-In
📈 Breakout Entry: 790.00 (Vault Door Break)
📉 Pullback Entry: 710.00+ (Sweet Spot for the Thieves)
🔑 Any perfect pullback after 710.00, OG thieves may layer orders at chosen levels – stack the loot, DCA style!
🛑 Stop Loss (SL): Thief SL parked @ 675.00 (but remember OG’s—adjust based on your risk appetite & personal robbery strategy).
🎯 Target (Escape Point): 850.00 (Police barricade spotted! Don’t get greedy—take the cash and run before sirens go off 🚔💨).
🕵️♂️ Thief Trader Notes:
Use layering method (multiple limit orders) for maximum loot collection.
Don’t panic if guards (market makers) try to set traps; patience is the true thief’s weapon.
Adjust SL to protect your robbery stash.
Stay sharp—volatility = more doors to break in!
⚠️ Trading Alert for OG’s:
News & earnings reports are like security alarms—avoid entering new trades at that time.
Use a trailing SL to lock in profits once you’re in the getaway car 🚗💨.
💥 If you like this META Heist Plan, smash the Boost Button 💥 and join the robbery crew. Together we loot the markets, one breakout at a time! 🤑💰🏆
META trade ideas
Meta Platforms (META) Shares Decline Amid AI ConcernsMeta Platforms (META) Shares Decline Amid AI Concerns
Shares of US tech giant Meta Platforms (META) fell by around 3% after media reports revealed that the company plans to reorganise its artificial intelligence operations for the fourth time in six months. The news has raised investor concerns over whether Meta’s AI strategy is on the right track.
Meanwhile, Bloomberg reports that Meta intends to begin selling its first smart glasses with a built-in display next month. However, the price may come in lower than expected — at $800 — as the company is willing to accept slimmer margins to stimulate demand (and, consequently, lower its profit outlook).
Technical Analysis of META Stock
In our previous analysis of META’s chart, we outlined an ascending channel and suggested that the bulls might attempt to push the price higher within this structure, supported by strong fundamentals following the company’s quarterly earnings release.
Since then, the price has climbed to new record highs (with the all-time peak now above $790). However, the technical outlook appears uncertain, with several bearish signals emerging:
→ Selling pressure may arise around the psychological $800 level.
→ The upper boundary of the channel is acting as resistance, and the price has formed a bearish double top pattern (as indicated by the arrows).
→ A bearish gap (highlighted in orange) may also act as an obstacle to further upward movement.
Additionally, adding an intermediate ascending trendline to the chart reveals the formation of a bearish rising wedge pattern.
At present, the price is hovering around the channel’s median line, but given the above factors, we could assume that the balance could shift in favour of the bears. In this case, META’s share price may undergo a significant correction.
Should this scenario unfold, the bulls could become active again around the support level at $747 or at the lower boundary of the channel.
This article represents the opinion of the Companies operating under the FXOpen brand only. It is not to be construed as an offer, solicitation, or recommendation with respect to products and services provided by the Companies operating under the FXOpen brand, nor is it to be considered financial advice.
$META: Narrative Extended🏛️ Research Notes
Exploring non-linear dynamics
Original Structure After witnessing the outcome I was intrigued to see how extended narrative would look like.
Logical Continuation

Meta Could Be Fighting HigherMeta Platforms recently pulled back, but some traders may think it’s still fighting higher.
The first pattern on today’s chart is the gap to new all-time highs after quarterly results beat estimates. That may reflect strong fundamentals in the social-media giant.
Second is the weekly close of $736.67 from February 14. META stalled at the level in late June but held it last week. Has old resistance become new support?
Third, stochastics are turning up from an oversold condition.
Next, the rising 50-day simple moving average potentially suggests an intermediate-term uptrend remains in effect. The 8-day exponential moving average (EMA) is also above the 21-day EMA. That may be consistent with a short-term uptrend.
Last, META is an active underlier in the options market. (Its average daily volume of 453,000 contracts ranks tenth in the S&P 500 over the last month, according to TradeStation data.) That could help traders take positions with calls and puts.
TradeStation has, for decades, advanced the trading industry, providing access to stocks, options and futures. If you're born to trade, we could be for you. See our Overview for more.
Past performance, whether actual or indicated by historical tests of strategies, is no guarantee of future performance or success. There is a possibility that you may sustain a loss equal to or greater than your entire investment regardless of which asset class you trade (equities, options or futures); therefore, you should not invest or risk money that you cannot afford to lose. Online trading is not suitable for all investors. View the document titled Characteristics and Risks of Standardized Options at www.TradeStation.com . Before trading any asset class, customers must read the relevant risk disclosure statements on www.TradeStation.com . System access and trade placement and execution may be delayed or fail due to market volatility and volume, quote delays, system and software errors, Internet traffic, outages and other factors.
Securities and futures trading is offered to self-directed customers by TradeStation Securities, Inc., a broker-dealer registered with the Securities and Exchange Commission and a futures commission merchant licensed with the Commodity Futures Trading Commission). TradeStation Securities is a member of the Financial Industry Regulatory Authority, the National Futures Association, and a number of exchanges.
Options trading is not suitable for all investors. Your TradeStation Securities’ account application to trade options will be considered and approved or disapproved based on all relevant factors, including your trading experience. See www.TradeStation.com . Visit www.TradeStation.com for full details on the costs and fees associated with options.
Margin trading involves risks, and it is important that you fully understand those risks before trading on margin. The Margin Disclosure Statement outlines many of those risks, including that you can lose more funds than you deposit in your margin account; your brokerage firm can force the sale of securities in your account; your brokerage firm can sell your securities without contacting you; and you are not entitled to an extension of time on a margin call. Review the Margin Disclosure Statement at www.TradeStation.com .
TradeStation Securities, Inc. and TradeStation Technologies, Inc. are each wholly owned subsidiaries of TradeStation Group, Inc., both operating, and providing products and services, under the TradeStation brand and trademark. When applying for, or purchasing, accounts, subscriptions, products and services, it is important that you know which company you will be dealing with. Visit www.TradeStation.com for further important information explaining what this means.

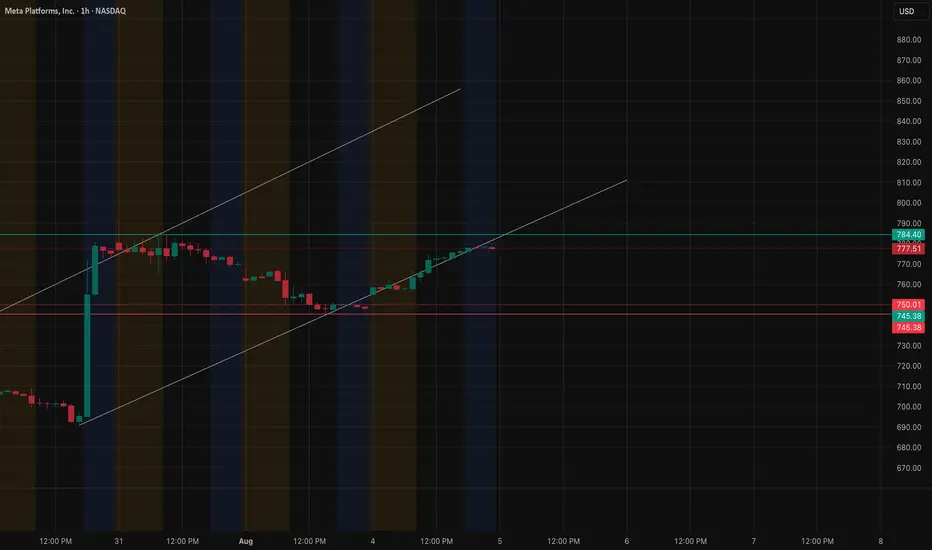
META wants to hold us upGreat attempts to break 800 this week. If there is something rallying, I'm betting it's META next week. Can we break 800? If we can, can we hit 810 -820s?
That's what I'm going to be watching out for. Or maybe give it 2 weeks. The earnings push gave nice volume. We did gap up on daily chart. This weekly chart is showing bullish continuation and that's what I'm going to keep my eyes out for.

META Long opportunity?Meta has broken strong resistance and Ichimoku sees a good buying opportunity next Monday. This is not a financial offer.

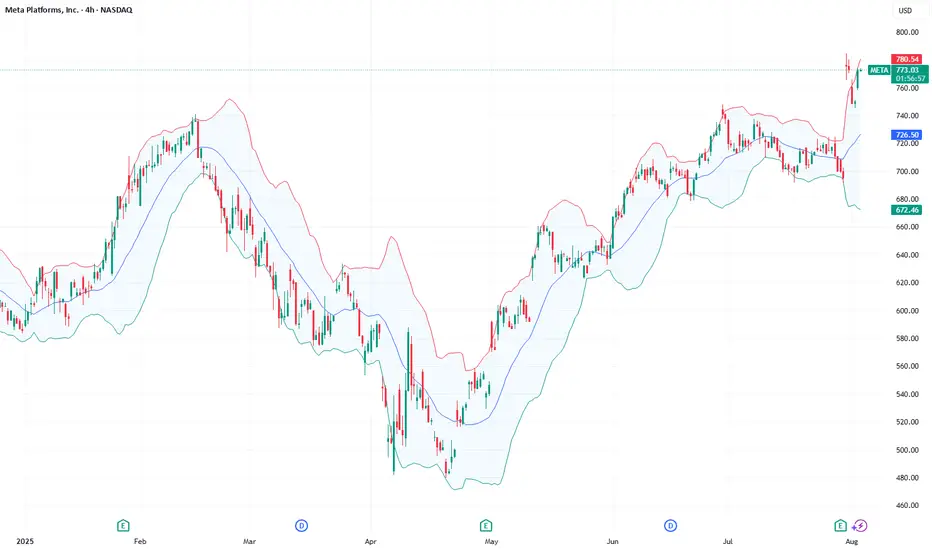
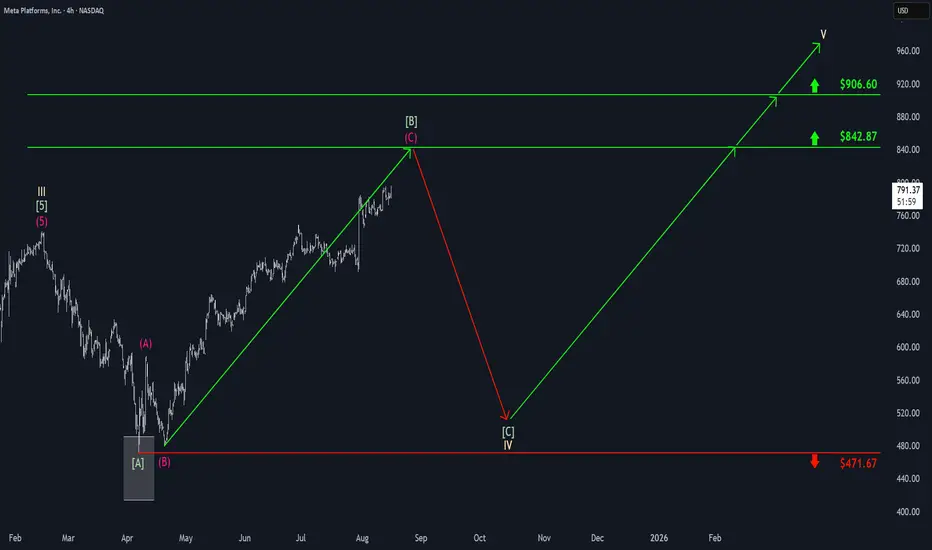
Meta: More Room to RunAfter a sharp rally, Meta has taken a more measured approach but continues to build on its upward momentum, even reaching a new all-time high. We’re still allowing for further gains in green wave , with room to run up to the new resistance at $842.87. Ideally, we would expect the price to reverse downward at that level to resume the broader correction. In wave , we’re preparing for potential sell-offs toward support at $471.67, though we still anticipate that the final correction low – and the subsequent trend reversal to the upside – will occur above this level. Looking further ahead, the next bullish cycle, wave V, is likely to drive Meta to new highs above $906.60 over the long term.
META daily updade(swing) Meta after break out is going retest the flag.
have 2 important point to get in.
ready to entry and watch out could fake break out.

META Calls on Fire– Don’t Miss Out 🚀 META Bulls Eye \$805 – One-Day Call Sprint Before Expiry
**Sentiment:** 🟢 *Strong Bullish*
* **Daily RSI:** Rising 📈
* **Weekly RSI:** Rising 📈
* **C/P Ratio:** 1.82 → heavy call buying
* **Volume:** Weak (0.5× last week) → watch for hesitation
* **Gamma Risk:** HIGH — expiry in 1 day ⚡
---
### 📊 **Consensus Snapshot**
✅ All models agree: bullish momentum + strong options flow
⚠️ Weak volume + high gamma = manage risk tightly
---
### 🎯 **Trade Setup**
* **Type:** CALL (Single-Leg)
* **Strike:** \$805.00
* **Expiry:** 2025-08-15
* **Entry:** \$0.57
* **Profit Target:** \$0.85 (+49%)
* **Stop Loss:** \$0.34 (–40%)
* **Confidence:** 75%
* **Entry Timing:** Market open
---
💬 *High-momentum, high-risk expiry play — eyes on the tape all day.*
📌 *Not financial advice. DYOR.*
---
**#META #OptionsTrading #GammaSqueeze #DayTrading #StocksToWatch #TradingSignals #OptionsFlow**

METAIf 779.7 cannot hold we will see Meta in the green zone below the breaking trend.
I hope i'm wrong because i'm risking by holding call contracts.

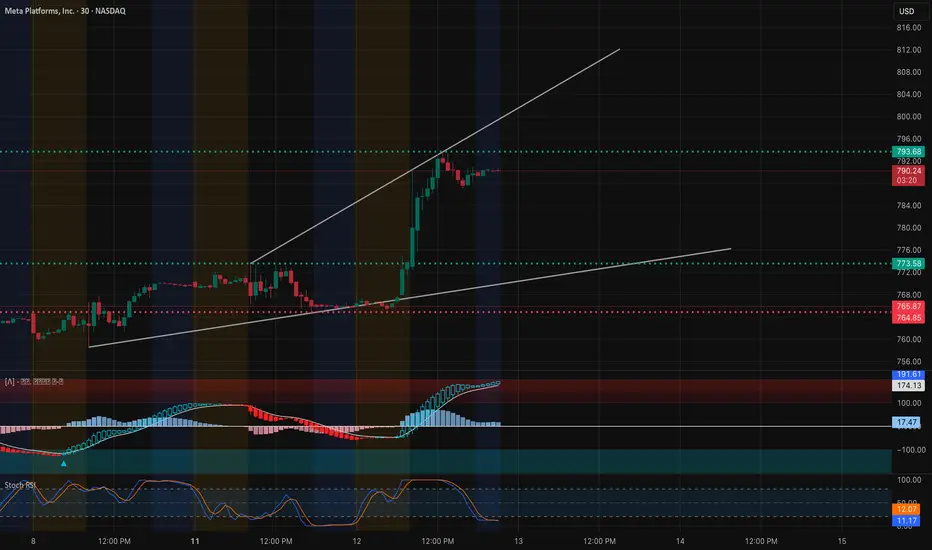
META – TA + GEX Confluence for August 13, 202530-Minute + 1-Hour GEX Combined Analysis
Price Action (30m)
META broke out from the $773 zone, confirming a Break of Structure (BOS) midday and running into $793 resistance before showing a Change of Character (ChoCH). This late pullback signals short-term profit taking but not necessarily a trend reversal.
GEX Confluence (1h)
That $793 top is no coincidence — it’s the highest positive NET GEX level (Gamma Wall). This is where market makers are most incentivized to cap upside unless heavy call buying forces a hedge-driven breakout.
Key Levels for Tomorrow
* $793 – Major Gamma Wall / breakout trigger
* $781 – Short-term pivot / intraday support
* $773 – Strong GEX-backed demand zone
* Upside Target if Breaks $793 – $800–$805 (next GEX resistance layer)
* Downside Target if $781 Fails – $773 retest
Trading Outlook for Aug 13
* Bullish Breakout: Hold above $793 with volume could trigger a gamma squeeze toward $800–$805.
* Bearish Rejection: Fail at $793 + lose $781 opens path to $773.
* Neutral Chop: $781–$793 range-bound action possible if neither side dominates.
Reasoning
* The 30m chart shows the rally’s structure and key pivots.
* The 1h GEX map explains why $793 is such a heavy resistance and why $773 is the likely support zone.
* Tomorrow’s trading will likely be decided at $793 — a clean break could lead to rapid continuation, while rejection could see a controlled pullback.
Disclaimer: This analysis is for educational purposes only and does not constitute financial advice. Always conduct your own research and manage risk appropriately before trading.
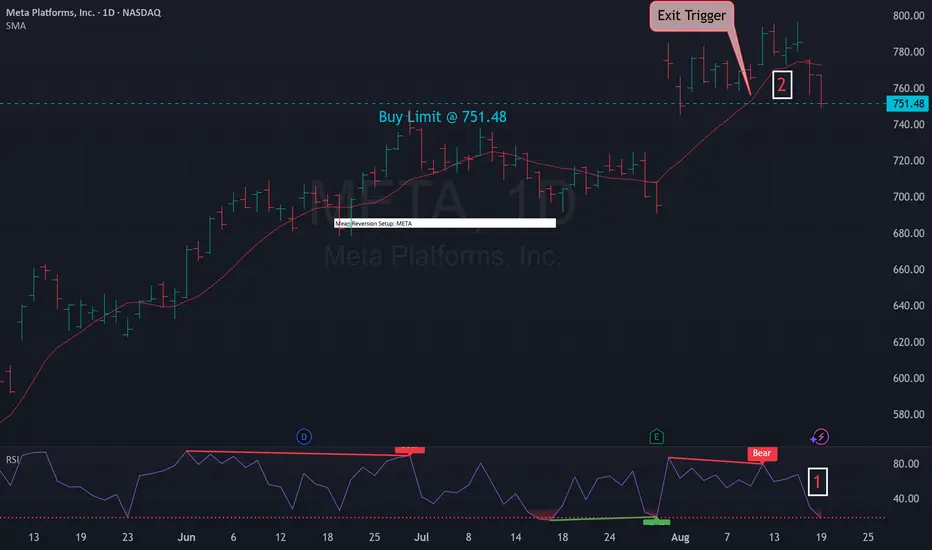
Mean Reversion Setup: META1. RSI in oversold region
2. Price likely to rebound back the the mean
Trade Rules:
Entry Trigger - RSI has cross below oversold region, enter limit buy at close price
Exit Trigger - Close at market when close price cross above exit trigger (Red Line)
Buy Limit @ 751.48
Entered Long @ 100.99
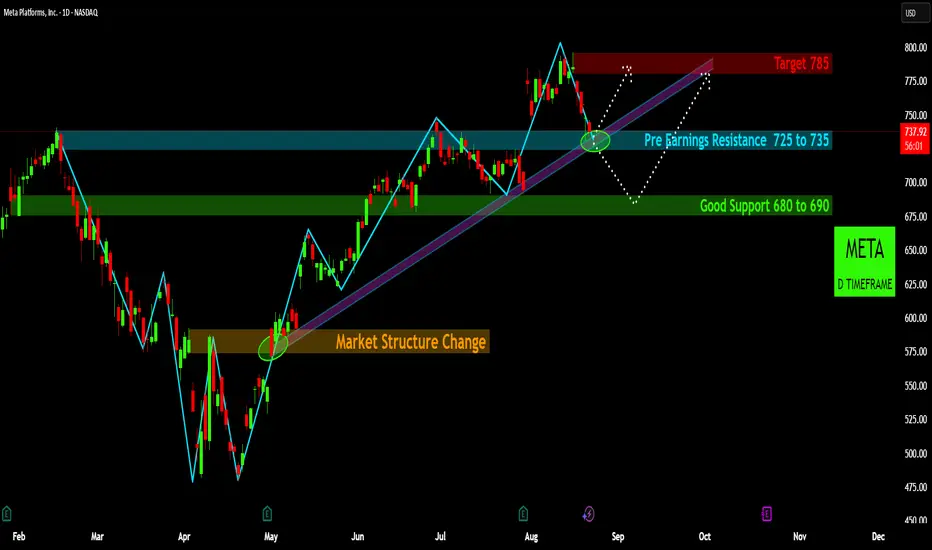
META's Uptrend: What to Watch NextMETA Stock: Key Levels & Potential Trades
Uptrend intact: META has been in a strong uptrend since May, consistently finding support along the green trendline and making higher highs.
Current Level: The stock is currently retraced back to $725 and $735 zone, which was Pre Earnings Resistance Area.
Potential Trades:
Bullish: If META can stay above $735, we can target $785.
Key Support: If it struggles at this resistance or pulls back, look for strong support in the
680−690 range.
The Overall Uptrend is still intact.
Disclaimer:
The information provided in this chart is for educational and informational purposes only and should not be considered as investment advice. Trading and investing involve substantial risk and are not suitable for every investor. You should carefully consider your financial situation and consult with a financial advisor before making any investment decisions. The creator of this chart does not guarantee any specific outcome or profit and is not responsible for any losses incurred as a result of using this information. Past performance is not indicative of future results. Use this information at your own risk. This chart has been created for my own improvement in Trading and Investment Analysis. Please do your own analysis before any investments.
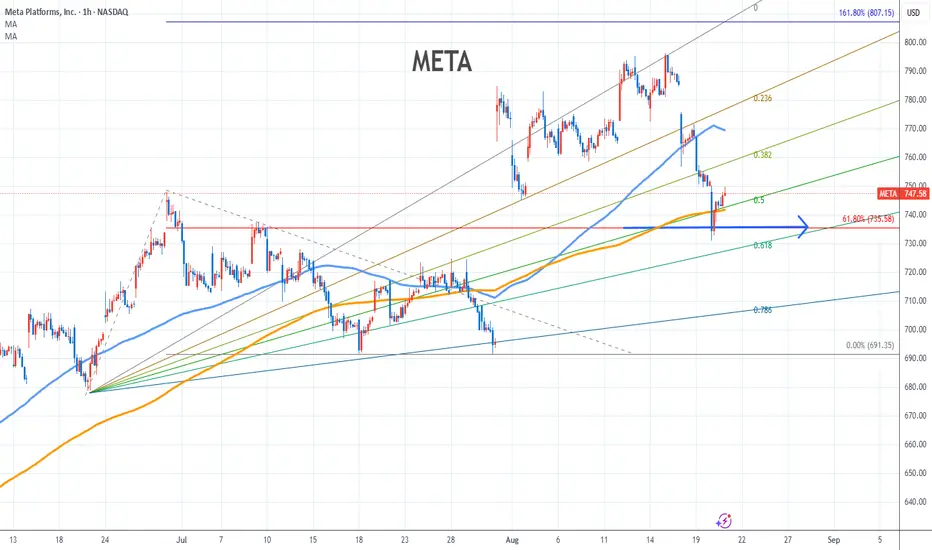
META Stock Chart Fibonacci Analysis 082025Trading Idea
1) Find a FIBO slingshot
2) Check FIBO 61.80% level
3) Entry Point > 735/61.80%
Chart time frame:B
A) 15 min(1W-3M)
B) 1 hr(3M-6M)
C) 4 hr(6M-1year)
D) 1 day(1-3years)
Stock progress:C
A) Keep rising over 61.80% resistance
B) 61.80% resistance
C) 61.80% support
D) Hit the bottom
E) Hit the top
Stocks rise as they rise from support and fall from resistance. Our goal is to find a low support point and enter. It can be referred to as buying at the pullback point. The pullback point can be found with a Fibonacci extension of 61.80%. This is a step to find entry level. 1) Find a triangle (Fibonacci Speed Fan Line) that connects the high (resistance) and low (support) points of the stock in progress, where it is continuously expressed as a Slingshot, 2) and create a Fibonacci extension level for the first rising wave from the start point of slingshot pattern.
When the current price goes over 61.80% level , that can be a good entry point, especially if the SMA 100 and 200 curves are gathered together at 61.80%, it is a very good entry point.
As a great help, tradingview provides these Fibonacci speed fan lines and extension levels with ease. So if you use the Fibonacci fan line, the extension level, and the SMA 100/200 curve well, you can find an entry point for the stock market. At least you have to enter at this low point to avoid trading failure, and if you are skilled at entering this low point, with fibonacci6180 technique, your reading skill to chart will be greatly improved.
If you want to do day trading, please set the time frame to 5 minutes or 15 minutes, and you will see many of the low point of rising stocks.
If you want to prefer long term range trading, you can set the time frame to 1 hr or 1 day
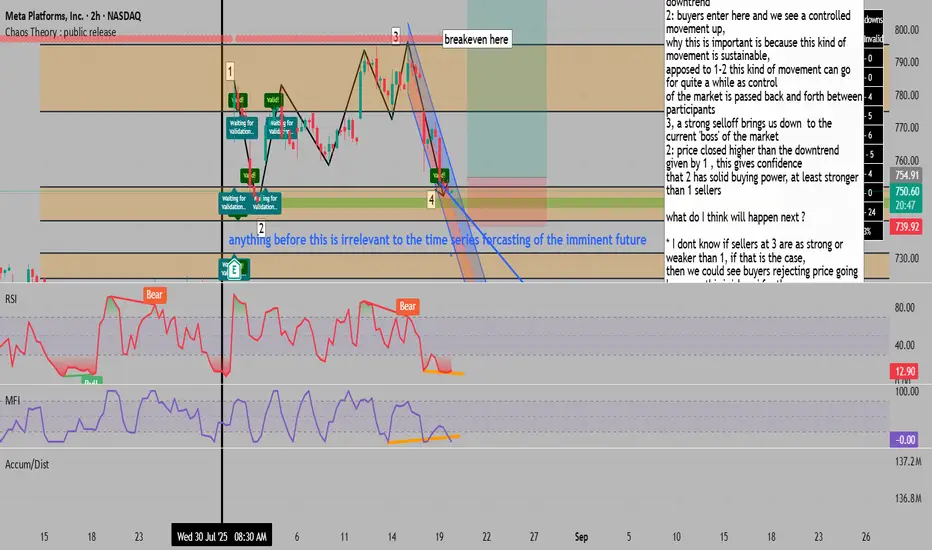
a return to structure after gap up presents high RR = BUY1: entrance of sellers, kind of one sided and seemed to be more of a
profit take, rather than the start of a downtrend
2: buyers enter here and we see a controlled movement up,
why this is important is because this kind of movement is sustainable,
apposed to 1-2 this kind of movement can go for quite a while as control
of the market is passed back and forth between participants
3, a strong selloff brings us down to the current 'boss' of the market
2: price closed higher than the downtrend given by 1 , this gives confidence
that 2 has solid buying power, at least stronger than 1 sellers
what do I think will happen next ?
* I dont know if sellers at 3 are as strong or weaker than 1, if that is the case,
then we could see buyers rejecting price going lower, as this is 'cheap' for them,
and they will buy..
* we would want to see some kind of confirmation, I do like that at 4 we have an
inside candle meaning a slowdown, if price comes back up a bit it could
be a good high RR entry
* mfi and rsi hidden divergence, helps the case a bit oversold but I dont care, its too volitile for this to mean anything, if anything this is something
that would confuse the analysis
* according to chaos theory , if a bar closes above a zone, there is a 73% chance it reaches the next zone above, so we can have a breakeven period and a logical tp using the theory of chaotic expansion of a system
META - LONG Swing Entry PlanNASDAQ:META - LONG Swing Entry Plan
E1: $247.50.00 – $741.00
→ Open initial position targeting +8% from entry level.
E2: $722.00 – $717.00
→ If price dips further, average down with a second equal-sized entry.
→ New target becomes +8% from the average of Entry 1 and Entry 2.
AD: $678.50.00 – $663.00
→ If reached, enter with double the initial size to lower the overall cost basis.
→ Profit target remains +8% from the new average across all three entries.
Risk Management:
Stop Loss:
Risk is capped at 12% below the average entry price (calculated across all executed positions including the Edit Zone).
Position Sizing Approach:
Entry 1: 1x
Entry 2: 1x
Edit Zone: 2x
→ Total exposure: 4x
→ Weighted average determines final TP and SL calculations.
______________________________________
Legal Disclaimer
The information provided in this content is intended for educational and informational purposes only and does not constitute financial, investment, or legal advice or recommendations of any kind. The provider of this content assumes no legal or financial responsibility for any investment decisions made based on this information. Users are strongly advised to conduct their own due diligence and consult with licensed financial advisors before making any financial or investment decisions.
Sharia Compliance Disclaimer: The provider makes no guarantees that the stocks or financial instruments mentioned herein comply with Islamic (Sharia) principles. It is the user’s responsibility to verify Sharia compliance, and consultation with a qualified Sharia advisor is strongly recommended before making any investment decisions

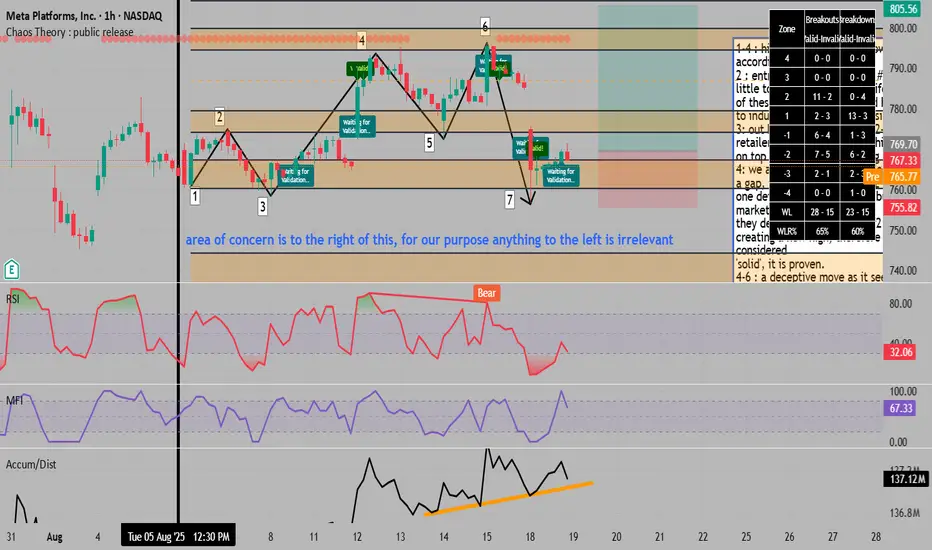
a return to solid sellers with all signs scaring buyers = BUY 1-4 : higher high and higher lows , upward structure
according to dow theory
2 : entrance of sellers to test #1, very strong sellers with
little to no resistance, the uniformity and similarity
of these bars is suspicious and hints at external intervention,
to induce people to the downside.
3: out buyers enter, with the 2-3 downtrend I could see most
retailers not thinking any of this structure is meaningful,
on top of that probably having a stop above 2
4: we are pushed to the upside with strength, even creating
a gap, the stop orders above 2 got liquidated (ouch!) ,
one detail to note is that the buyers at #3 are now in control of the market,
they defeated the sellers at #2 by taking out their orders and
creating a new high, therefore the genesis of these buyers is considered
'solid', it is proven.
4-6 : a deceptive move as it seems to be a higher high which ,
woudl maybe make people think 5 is a solid low and stronger than the sellers at 4,
but if you draw a horizontal line, it simply is not the case.
7 : a return to the solid structure at 3, high volitlity which is good
as a confluence to the upside, because after high volitlity we
normally have a nice flow establish in the opposing direction
* what do I think will happen ?
* the candle at #7 is an attempt to scare off entrance to where major
players are entering, this is a great entry with a stop loss below #3 ,
likely this is where major market movers have their stop loss and they
will defend this area unless I am wrong.
* accumulation/distribution is giving us a hidden divergence , nothing
from mfi and rsi except oversold, which I do not trust in high volitlity / strong
moves.
* over the past 2,500 candles , price has reached the next orange zone if it closes out on one side
of the zone , you can manually verify by reducing the lookback period and counting, only realtime
tradeable bars / zones are counted in stats.
* in conclusion we want a buy order.
* we will expect the next leg up here, so reach for a tp at the zone above 6,
breaking even at the 6 high in case it's just a pullback.
$META Tradespoon – Long Entry $782.13Tradespoon model generated long signal for NASDAQ:META . Predicted range: $780.41–$810.23. Trend: +1.96%. NASDAQ:META

META Eyeing $800? Double-Up Play This Week! 📈 META Weekly Swing Setup (2025-08-10) 📈
**Bias:** ✅ **Moderate Bullish** — strong options flow + favorable volatility, but daily RSI and weak volume suggest caution.
**🎯 Trade Plan**
* **Ticker:** \ NASDAQ:META
* **Type:** CALL (LONG)
* **Strike:** \$790.00
* **Entry:** \$3.30 (open)
* **Profit Target:** \$6.60 (+100%)
* **Stop Loss:** \$1.80 (-45%)
* **Expiry:** 2025-08-15
* **Size:** 2 contracts
* **Confidence:** 65%
**📊 Key Notes**
* Weekly RSI 70.7 rising → bullish trend intact 📈
* Call/put ratio 1.83 → strong institutional sentiment ✅
* VIX falling to 15.15 → low vol favors directional plays 🛡️
* Volume 0.5x previous week → lighter conviction ⚠️
* Resistance watch: \$784.75 🔍
**💡 Play Idea:**
Enter Monday open → target quick upside before Thursday → cut early if price stalls at resistance.

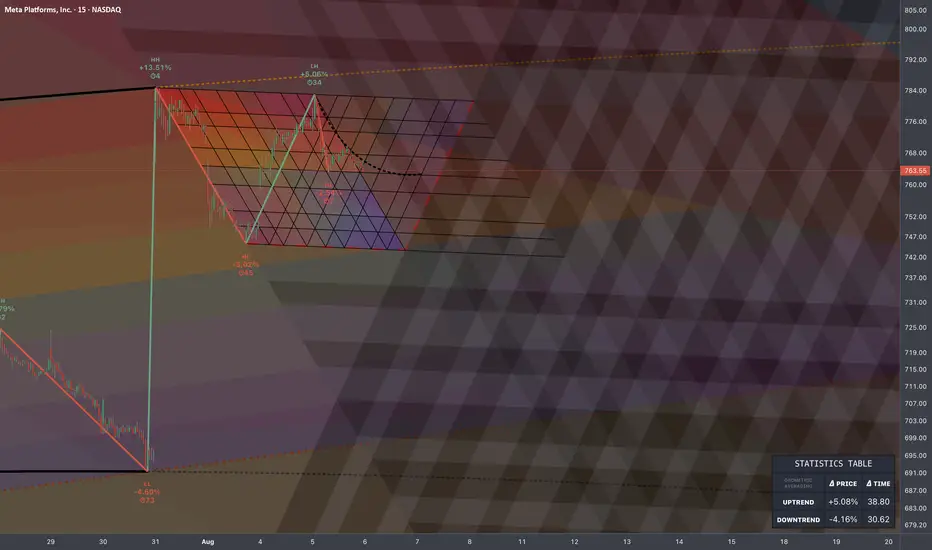
META: Price Entropy🏛️ Research Notes
Recent rejection from LH could be explained by spike out of scale, which in its turn was caused by buildup of counter force while correcting.
Those two are part of progression which was wired by longer selloff cycle.
If we scale back further, we would confirm overall structure's capacity set by growth patterns.
Those boundaries and space between them can be interpreted as supply zones, leaving us with this particular interconnection:
Though the object of observation would be the recent developments at minimal TF for publication (15m), so temporal patterns and cycle-derived levels can be thoroughly studies.
META watch $779 then 798: Dual Golden fib barrier to 800 round META earnings blew away the analyst expectations.
Surged into dual Golden fibs at $779.61 then 797.90
This "high gravity" zone will likely hold price for a bit.
.
See "Recent Publications" for previous charts ------------>>>>>>>>>
Such as this one that caught an HUGE BREAKOUT
Hit BOOST and FOLLOW for more such PRECISE and TIMELY charts.
=========================================================
.

META: Eyeing a Breakout. Aug.5META: Eyeing a Breakout — GEX Supports Upside Momentum 🚀
Technical Overview
META has been showing consistent bullish recovery off the $691–$707 demand zone, climbing back into its rising channel. Price is now approaching a critical resistance cluster between $784–$790, where prior rejection and current GEX resistance converge.
GEX Insights
Options GEX shows the highest positive NETGEX at $790 — also aligning with the 2nd CALL Wall (91.31%). This means option dealers are heavily short calls at this level, creating a potential gamma squeeze scenario if price breaks and holds above it. Additional CALL interest extends toward $800–$820, suggesting upside expansion if momentum follows through. On the downside, GEX Put Support sits near $698–$707, reinforcing the major swing low zone as strong support.
1H Price Action Structure
* Strong bounce from channel midline support.
* Higher lows and higher highs forming, signaling bullish continuation.
* Resistance test ahead at $784–$790; breakout here may trigger stop runs and call delta hedging.
15M Short-Term View
* META is coiling under resistance with minor intraday pullbacks.
* Watching for breakout above $784 for aggressive scalps toward $790+.
* Failure here could trigger a retest of $770–$775 short-term support.
Options Trade Suggestion Based on GEX
* Bullish Play: Consider call spreads targeting $790–$800 if price clears and holds above $784 with volume.
* Risk Zone: If price fails to hold $770, momentum weakens and $750 becomes the next key support.
* Bearish Hedge: Put spreads only if rejection at $784–$790 is confirmed with breakdown through $770.
My Thoughts
GEX positioning clearly favors upside into $790 as long as $770 support holds. If META triggers the gamma breakout, the move could accelerate toward $800 quickly. Keep in mind that $790 is both a magnet and a ceiling — watch the breakout volume closely.
Directional Bias: Bullish leaning — favor long setups above $784.
Disclaimer: This analysis is for educational purposes only. Always do your own research and manage risk before trading.
Microsoft, Meta, Nvidia — Lifting Off in the AI MarketThe “Big Three” are breaking new records: #Facebook (Meta) surged to $784.39 as AI-powered targeting tools pushed ad revenues higher, #Microsoft hit $551.10 by combining rapid Azure growth with new monetization from Copilot across its ecosystem, and # Nvidia climbed to a record $183.21, driven by unwavering demand for AI computing.
Key growth drivers:
#Facebook (Meta): Markets welcomed strong ad revenue projections, outweighing concerns about capex. AI tools for ad targeting significantly improved performance.
#Microsoft: Azure’s YoY growth reached ~39%, Copilot crossed 100M monthly users, and the company committed up to $30B in upcoming AI infrastructure.
#Nvidia: Persistent demand for AI GPUs and networking gear from hyperscalers, plus a $4T valuation milestone, keeps momentum strong.
What’s fueling continued upside:
#Facebook (Meta): AI tools like Advantage+ improve audience targeting and ad creatives, while Reels and recommendation feeds increase impressions and eCPM. Large-scale investment in data centers and in-house AI models open new monetization paths. Stable rate expectations also favor growth stocks like META.
#Microsoft: Growth is driven by Azure’s ongoing expansion (~39% YoY), the second wave of cloud migration, and strong monetization via Microsoft 365 and GitHub Copilot. A $30B capex plan will expand data center capacity. A broad portfolio — Windows, Office, Gaming — supports steady margins.
#Nvidia: The AI compute supercycle is in full swing. Demand for H-series GPUs and InfiniBand networks exceeds supply. The clear upgrade roadmap (H200/Blackwell) extends through 2026, while CUDA ecosystem expansion strengthens customer lock-in. Strong cash flow and record valuation support M&A, buybacks, and accelerated development.
According to FreshForex , current price levels make #Meta and #Microsoft attractive for long positions. #Nvidia offers room for both upside and pullbacks, depending on news flow.