Canopy Growth ($WEED) is a price floor finally forming?Canopy Growth, widely-considered one of the most successful public companies in the cannabis sector, has shown a pretty volatile history as traders try to set prices and speculators skew supply and demand in this nascent industry. One thing is certain, many of the traded cannabis companies will fail commercial, some are simply shell companies holding portfolios full of other shell companies in cannabis, bioceuticals, vaping and cosmetic etc. Canopy Growth, however, is definitely considered to be a company to watch and which all cannabis stock investors should hold.
Obviously, this area underwent a hype cycle where prices became hugely inflated far beyond the capacity of these companies to deliver profits at the time, but what does the future hold? The fundamentals here are good with increasing cannabis use across all demographics, however they will largely be determined by legislation. It's a case of wait and see, but cannabis bulls are optimistic here. From a technical perspective, we need to ask whether these previously high growth stocks could be in a secular bull market, that is a market displaying continuous net growth characterized by short-term and alternating bull and bear phases. If this is the case, we should expect to find the bottom for Canopy Growth around here. Technically we should see long-term support structure develop here, which tests the price floor a number of times indicative of accumulation.
For cannabis bulls none of this matters, they will be buying here anyway.
---------------------------------------------------------------------------------------------------------------------------------------------------------
weedmoon -- Pumping Weed Stocks to the Moon
All information is provided informally, without any acceptance of liability or guaranty on the part of the author "weedmoon".
All trades made by the reader are the sole responsibility of the reader.
420 Ho!
WEED trade ideas

Ascending Triangle, is Canopy trading in a hidden pattern?There's also merit for a another Inverse H&S to play out here, after a few more trading days next week we may see the shoulder continue to develop or a retest of the bottom upward sloping line of the Ascending Triangle, which would also negate the inverse H&S narrative, but the bottom of the ascending triangle could still hold & result in a bullish outcome, keep in mind these patterns have a tendency to finish roughly 70% to 80% way through the pattern in either direction frequently.
Key Takeaways
An inverse head and shoulders is similar to the standard head and shoulders pattern, but inverted: with the head and shoulders top used to predict reversals in downtrends
An inverse head and shoulders pattern, upon completion, signals a bull market
Investors typically enter into a long position when the price rises above the resistance of the neckline.
An ascending triangle is a chart pattern used in technical analysis. It is created by price moves that allow for a horizontal line to be drawn along the swing highs, and a rising trendline to be drawn along the swing lows. The two lines form a triangle. Traders often watch for breakouts from triangle patterns. The breakout can occur to the upside or downside. Ascending triangles are often called continuation patterns since the price will typically breakout in the same direction as the trend that was in place just prior to the triangle forming.
Key Takeaways
The trendlines of a triangle need to run along at least two swing highs and two swing lows.
Ascending triangles are considered a continuation pattern, as the price will typically breakout of the triangle in the price direction prevailing before the triangle. Although, this won't always occur. A breakout in any direction is noteworthy.

Is Canopy trading in a Descending Triangle?With earnings approaching next week & a new CEO that comes from STZ who also happens to be an accountant, I wouldn't be surprised if $WEED financials are becoming chaos in order.
Only time will tell, but this could end up being a giant bull flag as well. The 200 Day MA isn't that far away either, but on the RSI is looks like a H&S is forming.

Descending Triangle.This is the "exact" same chart from the other day but on a 6 month line chart; which only shows the daily "closing price" as opposed to the 1 year time frame candle chart I posted on Feb 6th which shows more trades.
Notice where the rejection point came into play on Canopy's parabolic price move on Friday? The downward sloping trendline of the descending triangle seems to be in play, and the sell volume seems incredibly bearish.
Every time Canopy's RSI gets this high we see a dump in the share price as well.
The neckline area of the Inverse Head & Shoulders pattern which called the temporary bottom seems to be holding as support for the time being, interesting.

CANOPY GROWTH TSE: WEED 1DAY Bottoming PatternPossible Bullish Reversal pattern. Potential for high % profits for Canopy Growth. (Canadian Cannabis Stock)

Forget the FAANG stocks, time to revisit the POT stocks Yes, it is like a sector rotation for equities. FAANG stocks has enjoyed unparalleled astronomical returns for as long as they were publicly listed. Now, I know many of us for whatever reasons are not in these FAANG stocks and in a way ,regretted why didn't they got into it....
Nobody knows how high they can go but since they are already so sky high, any room up there might be limited with higher possibilities of pullbacks every now and then......
Weed or POT stocks on the other hand had their glorious days too in 2016 to Q1 2019 before they plunged down badly.
10 months have passed and it looks like they deserve a 2nd chance. WEED found support at 24.14, broke out of the bearish trend line and is now hoovering at 31.71. It may retrace a little back to the support level at 28.21 (we are buying here) before it charges higher up.

CGC: Has the Sentiment Finally Changed?It finally appears the sentiment for pot stocks has changed, especially with some adequate news for some stocks, and actually some revenue surprises for other stocks.
It appears for many stocks it is now 'safe' to put small lots in, however, one must enter slowly as the short interest on pot stocks will remain absolutely immense for at-least 4-6 months.
Nonetheless, even as sentiment begins to push upward, one must expect extreme volatility, even within a days time. At this point, this is one of those sectors where you want to invest and never look at it again for a few years as the volatility could force premature panic selling.
An ETF would be a worthy bet since the sector remains far too infantile to choose a "winner".
My Favourite ETF: HMJU (BetaPro 2x Leveraged Return).
- zSplit

3rd Quarter 2020 Bullish WEED Case StudyHey there Traders,
Attached is my prediction for $WEED over the course of 2020,
There was a lot of sell pressure in 2019 that has cooled off over the past few weeks. I assume the cool off phase/re-accumulation zone will continue for the first half of 2020 followed by a bullish climb near the 2nd half of 2020

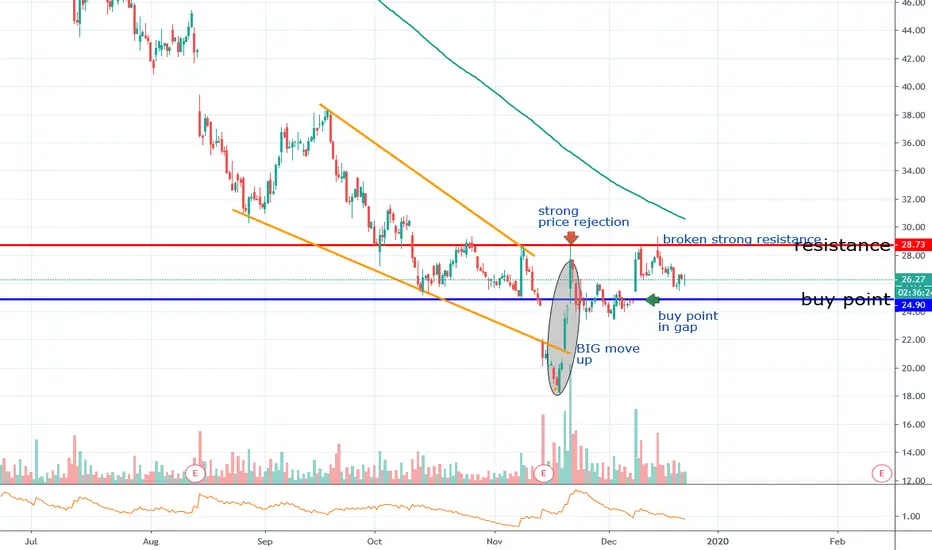
buy point on WEED, Bull Run!?!After a long downtrend on WEED there was a false breakdown out of the channel and a strong move up which saw a price rejection at the red resistance line.
The price has now broken the resistance and just needs to break the 200MA, after this resistance is broken a bull run is very probable. Buy point marked on chart.

Trend change for canopy200/50 hr sma made a cross Friday which Indicates a possible trend change. Rsi on the daily chart and the rsi cross on the weekly chart made me take a bet on canopy for a Monday bull run just a swing day I wouldn’t recommend weed stocks as a long term investment until you see a change in trend of the etfs hmmj etc.

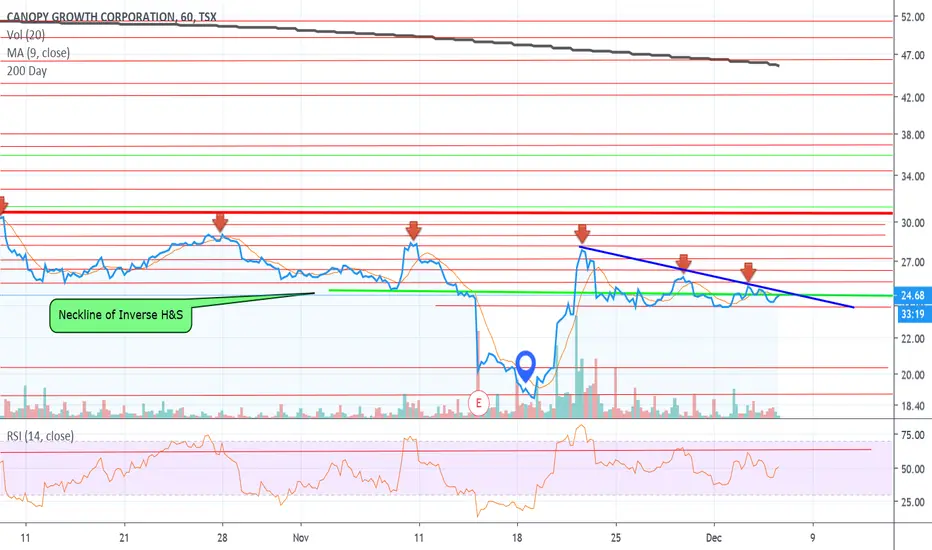
Bull Flag or Descending Triangle.Since my post several days ago linked to this chart, you'll notice $WEED is holding the neckline area of the inverse H&S, forming two additional patterns known as a bull flag & descending triangle.
Seeing how the sector has thrown under the bus for the better part of 1 year, I'm expecting to see the Bull Flag play out.. Simply to go against the bearish narrative that's becoming a bit more hysterical by the day..
Time will tell per usual.

Lower High.It appears as though the Inverse H&S may be negated. Where I've placed another arrow pointing down may become another lower high, and it may act as the left shoulder of a H&S.

Is Canopy trading in a Inverse H&S?Or was the recent move simply another lower high where i have the red arrow pointing down?
It appears as though Canopy may be ready to break the neckline of this inverse H&S.
The RSI may have double topped though, only time will tell.


Canopy Growth TSX WEED.TO.. The hype cycle. Weekly with reports.Things have definitely finally hit levels that are in line with a longer term bottoming and possibly the re-confirmation of a base support at these levels of previous highs. If not, things look grim for this entire hype based market.
Wait for the next report? Wake me up in the spring.

Drake started from the bottom, but not with Canopy?Or did he?
I mean, technically Drake could have been invested in Canopy for many years now, he's a very business savvy guy, not just rapper / icon. So who really knows what his average cost is.
Anyway, on a 3 month & 6 month chart we can clearly see lower high after lower high, and this recent move may become just that, another lower high... The rsi is very overextended & it looks like an inverse H&S already played out there... But on the actual chart, it appears as though a Inverse H&S may still be forming, only time will tell I guess.


WEED - Still lots of room to fall (20%), and a gap at $12.50?!We've already blown past the fib retracement golden ratio of 65%, and our next target is 0.786. I don't have a position in this yet, but when we confirm a reversal, I'm going to take a very large position.
SHORT TERM: Our next target is $21.69, and that correlates with another 15% drop in the HMMJ, which is def. going to happen to fill these gaps:
Not only does WEED have to fill those gaps, but so does CRONOS (which makes up the same percent of the HMMJ holding). You can see the gaps yet to be filled at $5.75 (around 30% down from where we're at now):
POTENTIAL YOLO SCENARIO: There's a gap to fill from $14 to 12.50, which is terrifying, as that's another 50% away from where we're at right now. However, considering the HMMJ sector could continue to fall to fill these gaps, I see it potentially happening.
HOW TO TRADE IT: Ladder in your buys. I'm going to put my buy order at around 80% level of the gap-fill, and play the bounce back up. Then, I'll go on shorter timeframes and make sure it doesn't reverse. Regardless, even if you're stopped out on the bounce, you're still making 5%. My stop will be 5-6% below the very bottom of the gap.
PS - Fun fact: HMMJ is comprised of the following:
CRONOS GROUP INC . 10.59%
CANOPY GROWTH CORP . 10.59%
GW PHARMACEUTICALS PLC . 9.8%
AURORA CANNABIS INC . 9.21%
APHRIA INC . 8.14%
TILRAY INC . 8.01%
SCOTTS MIRACLE-GRO CO/THE . 6.26%
CHARLOTTES WEB HOLDINGS INC . 6.04%
HEXO CORP . 3.16%
ORGANIGRAM HOLDINGS INC . 2.9%
Here's a fun call I did for HMMJ:

Canopy still short see here whyWe ware in the 5th wave, at the beginning of the 5th wave, it will still go probably not to lowest low but not far from there. i don't trade it short but im just saying is still loosing steam
