TUT/USDTKey Level Zone: 0.02700 - 0.02770
HMT v8.1 detected. The setup looks promising, supported by a previous upward/downward trend with increasing volume and momentum, presenting an excellent reward-to-risk opportunity.
HMT (High Momentum Trending):
HMT is based on trend, momentum, volume, and market structure across multiple timeframes. It highlights setups with strong potential for upward movement and higher rewards.
Whenever I spot a signal for my own trading, I’ll share it. Please note that conducting a comprehensive analysis on a single timeframe chart can be quite challenging and sometimes confusing. I appreciate your understanding of the effort involved.
Important Note :
Role of Key Levels:
- These zones are critical for analyzing price trends. If the key level zone holds, the price may continue trending in the expected direction. However, momentum may increase or decrease based on subsequent patterns.
- Breakouts: If the key level zone breaks, it signals a stop-out. For reversal traders, this presents an opportunity to consider switching direction, as the price often retests these zones, which may act as strong support-turned-resistance (or vice versa).
My Trading Rules
Risk Management
- Maximum risk per trade: 2.5%.
- Leverage: 5x.
Exit Strategy
Profit-Taking:
- Sell at least 70% on the 3rd wave up (LTF Wave 5).
- Typically, sell 50% during a high-volume spike.
- Adjust stop-loss to breakeven once the trade achieves a 1.5:1 reward-to-risk ratio.
- If the market shows signs of losing momentum or divergence, ill will exit at breakeven.
The market is highly dynamic and constantly changing. HMT signals and target profit (TP) levels are based on the current price and movement, but market conditions can shift instantly, so it is crucial to remain adaptable and follow the market's movement.
If you find this signal/analysis meaningful, kindly like and share it.
Thank you for your support~
Sharing this with love!
HMT v2.0:
- Major update to the Momentum indicator
- Reduced false signals from inaccurate momentum detection
- New screener with improved accuracy and fewer signals
HMT v3.0:
- Added liquidity factor to enhance trend continuation
- Improved potential for momentum-based plays
- Increased winning probability by reducing entries during peaks
HMT v3.1:
- Enhanced entry confirmation for improved reward-to-risk ratios
HMT v4.0:
- Incorporated buying and selling pressure in lower timeframes to enhance the probability of trending moves while optimizing entry timing and scaling
HMT v4.1:
- Enhanced take-profit (TP) target by incorporating market structure analysis
HMT v5 :
Date: 23/01/2025
- Refined wave analysis for trending conditions
- Incorporated lower timeframe (LTF) momentum to strengthen trend reliability
- Re-aligned and re-balanced entry conditions for improved accuracy
HMT v6 :
Date : 15/02/2025
- Integrated strong accumulation activity into in-depth wave analysis
HMT v7 :
Date : 20/03/2025
- Refined wave analysis along with accumulation and market sentiment
HMT v8 :
Date : 16/04/2025
- Fully restructured strategy logic
HMT v8.1 :
Date : 18/04/2025
- Refined Take Profit (TP) logic to be more conservative for improved win consistency
TUTUSDT trade ideas
TUT Analysis (2H)From the point marked as "start" on the chart, the TUT correction has begun.
It appears to be an ABC correction, and we are currently in wave B of this ABC.
Wave B seems to be a complex correction, possibly a triangle or a diametric, and we are currently in wave c of B.
Wave c of B itself appears to be forming a symmetrical pattern.
It is expected to move toward the red box while maintaining the green zone.
The targets are indicated on the chart.
A daily candle closing below the invalidation level would invalidate this analysis.
For risk management, please don't forget stop loss and capital management
Comment if you have any questions
Thank You
TUTUSDT Futures Long: Intraday Trade Setup!**Trade Setup: TUTUSDT Long (Intraday)**
Hey traders! 👋 I'm hyped to share a fast intraday long setup on TUTUSDT Futures (Binance). This idea is valid for *today only*, so don’t miss out! Let’s ride this wave! 🌊
**Why Go Long? 🔥**
- **Price Action:** Strong bounce from key support with bullish vibes on lower timeframes (15m/1H).
- **Indicators:** RSI screaming oversold—time for a potential pop! 📈
- **Sentiment:** Volume spikes show buyers stepping in hard at these levels. 💪
**Trade Details: ⚙️**
CHART IS SELF EXPLANATORY ⏰
**Risk Disclaimer: ⚠️**
Futures trading is high risk! Manage your risk wisely and only trade what you can afford to lose. This is just my analysis, not financial advice. Stay sharp! 🧠
**Final Note: ✨**
I’m pumped for this quick TUTUSDT setup. Drop your thoughts below—let’s see if we can catch this move together! Good luck, traders! 🚀
TUT/USDT – Short Opportunity Ahead?We’re spotting a potential short setup as TUT BINANCE:TUTUSDT.P approaches a key support level with increasing selling pressure.
📉 Market Recap & Why This Looks Bearish:
Strong rejection from the $0.0498 - $0.0525 resistance zone.
Price failed to hold momentum and is grinding lower.
Support at $0.0372 - $0.0369 is being tested again – multiple retests weaken the level, making a breakdown likely.
🔎 Short Setup & Targets:
🔻 Entry: Below $0.0372 (after confirmation of breakdown)
🔻 Targets:
$0.0328 (first TP)
$0.0287 (strong support)
$0.0229 - $0.0250 (final TP for full breakdown)
🔹 Stop Loss: Above $0.0400 (to avoid a liquidity grab)
🎯 Trade Scenario:
1️⃣ If $0.0372 breaks, we enter short for $0.0328+ targets.
2️⃣ If price bounces off support, we wait for a better re-entry on the next rejection.
3️⃣ Fakeouts possible! Watch for a liquidity grab before confirmation.
⚠️ Final Thoughts
Bearish Bias – Sellers are in control unless we see strong bullish reaction.
Patience is Key – Wait for a clear breakdown before entering.
Manage Risk! – Use proper stop-loss & don’t overleverage.
📊 Follow for more setups!
💬 Are you shorting this? Drop your thoughts below! 👇
#TUTUSDT.P | Is the Drop Deepening?#TUTUSDT.P
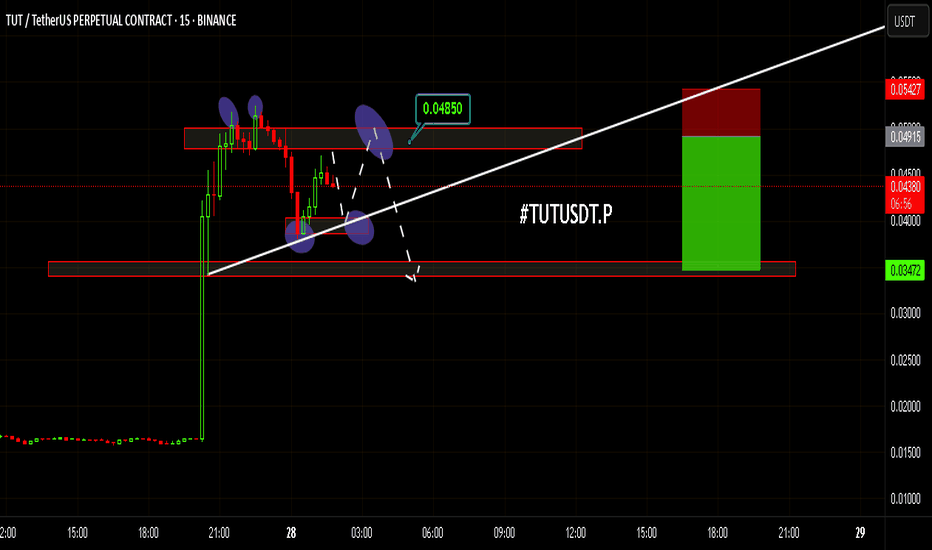
Looking at the chart, I expect the price to hover within a range for a while before making sharp downward moves. As shown in the visual, I anticipate the price to fluctuate between $0.043 - $0.038, then break the $0.037 - $0.037 levels and quickly test $0.032 and $0.027 levels.
However, before the major drop, I believe the price will give us another opportunity to enter a short position. Therefore, I have set my short position target at $0.038 after opening it at $0.043.
May our trades be profitable, friends! 🚀📊💰🔍⚡⏳
Manage your risk, stay in the game! 🎯🔥
#AlyAnaliz #TradeSmart #CryptoVision #TUTUSDT #Binanciega
TUTUSDT CHART ANALYSİS - EDUCATIONAL POSTHow NFT Technology Developed
NFT technology was created in 2017 based on Ethereum smart contracts. Since then, we have witnessed many successful NFT projects and deals. Stories like these perfectly describe the current and future possibilities of the technology.
The development of blockchain technology and the emergence of NFT services coincided with other processes in society and the economy. Many new players appeared in the stock markets, including non-professional traders and amateur investors.
The democratization of financial markets coincided with the pandemic: being in self-isolation, alone with their devices, many people began to pay attention to new financial instruments.
The information that arose around them also played a specific role in the “revival” of NFTs. The big names in the news headlines supporting NFTs couldn’t help but draw attention to them.
That is one of the reasons why the success of the technology was inevitable.
Will the Classic Formation Repeat ?Hey friends, here's the next analysis for today on #TUTUSDT.P. Lately, I believe this classic pattern we’re familiar with will repeat itself, just like it has with other coins. 🚀📊
The price initially makes a sharp correction, pulling back to the Fibo 0.382 level 🔄. At this point, it finds strong buyers and pushes itself back up. During the decline, it tests the lower point of a small double top it broke earlier, then rebounds and, as it approaches the 0.382 level, it finds strong buyers again, preventing the price from dropping further. It creates the impression of a double bottom during the drop and rise. Then, the price breaks the neckline of the double bottom pattern and hangs around there for a while before the inevitable sharp drop with large bearish candles. 📉🔥
We’ve pretty much memorized this formation by now, right? 😅 I’ll leave you with that, and now I’m off to sleep! 😴
#TUTUSDT.P is looking like it's following the same path again. Therefore, I recommend getting into positions gradually. The price should first reach around the $0.040 level, then push towards $0.048-0.049, where it will likely make a final stop loss hunt 🔪. I think it’s a great position with a 1:3 risk ratio! 💰
By the way, due to the Funding Rate situation, I recommend not opening a short position and going to sleep 💤. Also, keep leverage at a minimum and pay attention to the Funding Rate "tax hours." ⏳
Stay green, friends! 🍀💚
Manage your risk, stay in the game! 🎯🔥
#AlyAnaliz #TradeSmart #CryptoVision #TUTUSDT #Binanciega
TUTUSDT: support and resistance!!Join our community and start your crypto journey today for:
In-depth market analysis
Accurate trade setups
Early access to trending altcoins
Life-changing profit potential
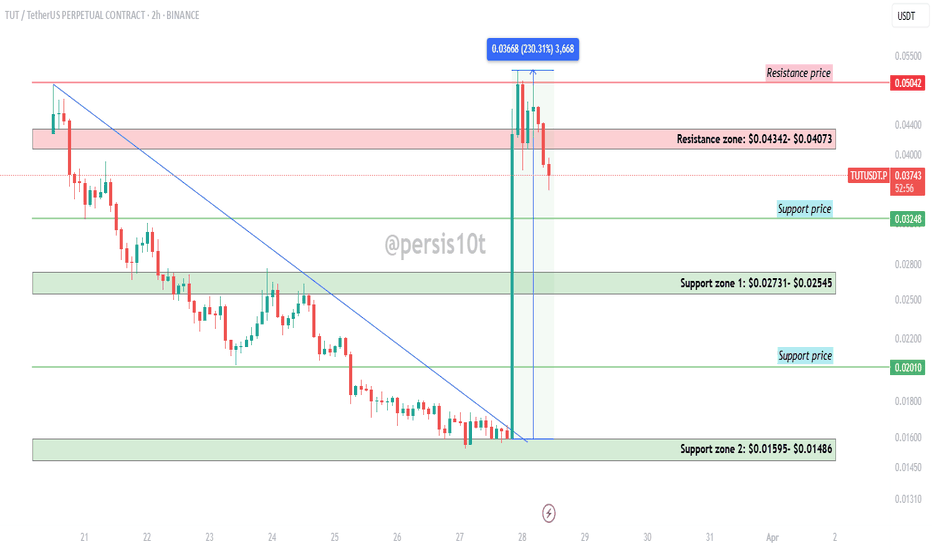
$TUT's impressive 230% surge from $0.01592 faces a pullback after hitting $0.04073-$0.04342 resistance. Now, it's heading towards crucial $0.03248 support. A bounce here is vital. A break above $0.04073-$0.04342 targets $0.05042 resistance. Watch $0.03248 for support; $0.05042 if resistance breaks.
Resistance zone: $0.04342- $0.04073
Support price: $0.03248
Support zone 1: $0.02731- $0.02545
Support zone 2: $0.01595- $0.01486
If you find this analysis helpful, please hit the like button to support my content! Share your thoughts in the comments and feel free to request any specific chart analysis you’d like to see.
Happy Trading!!
TUT ANALYSIS (1H)It seems that wave A has completed, and this token has entered wave B, which is bearish. The wave B structure appears to be symmetrical.
In the green zone, the price may sweep the liquidity pool and bounce upward.
Targets are marked on the chart. A 4-hour candle closing below the invalidation level will invalidate this analysis.
invalidation level: 0.015680$
For risk management, please don't forget stop loss and capital management
When we reach the first target, save some profit and then change the stop to entry
Comment if you have any questions
Thank You


