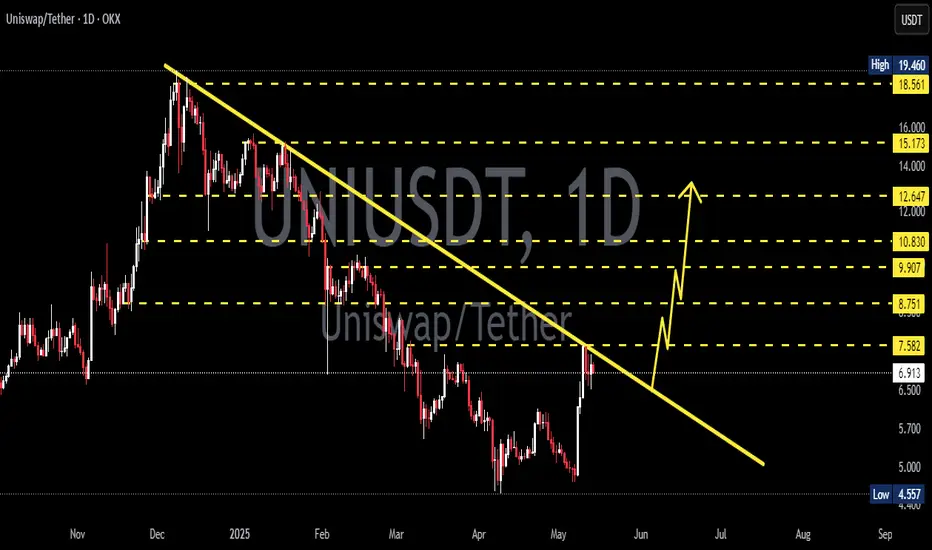
UNIUSDT 1D Analysis UNI ~ 1D Analysis
#UNI Buy gradually after successfully breaking through this resistance line with a short-term target of at least 10%++
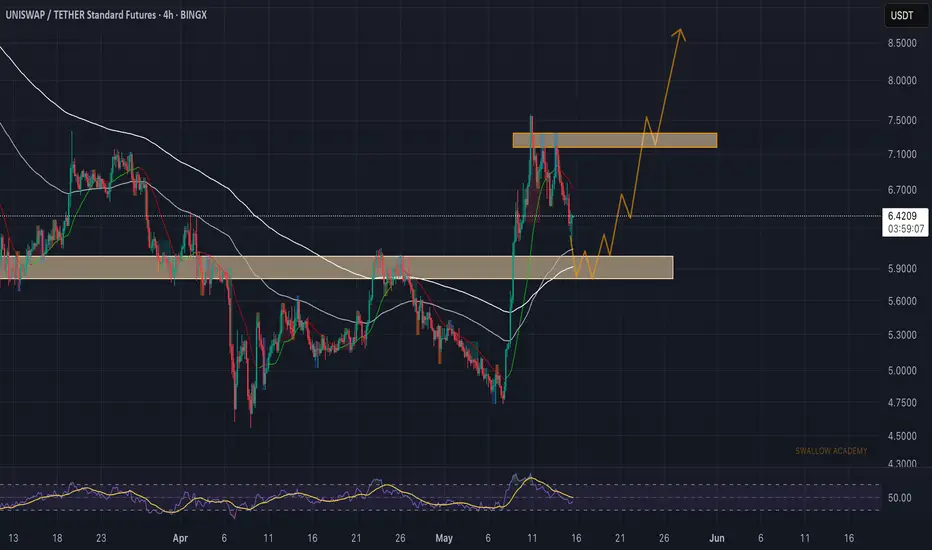
Uniswap (UNI): Looking For Successful Re-Test | Bullish MovementUNI coin is approaching the local support zone near the 200EMA, where we had a nice breakout but lacked the proper retest of that zone. We are looking for a successful retest of that zone, which would then open us an opportunity to move back to upper zones, towards the smaller resistance zone (for a
UNIUSDT | Long Bias | Altseason Play | (May 12, 2025)UNIUSDT | Long Bias | Altseason Play + Pullback Entry Setup | (May 12, 2025)
1️⃣ Short Insight Summary:
Uniswap is showing signs of broader correlation with the altcoin season rotation. While short-term money is flowing out, the macro structure remains bullish—making this dip a potential long oppor

UNI pullback at support zoneBuy gradually from here or wait for breaking through this resistance line with a short-term target of at least 20%

UNIUNI shows strong continuation potential after a classic liquidity sweep. As long as price holds above the retested area, the target zone remains in play.

UNIUSDT 1D#UNI is currently trading within a descending channel on the daily timeframe, but it's holding above the Ichimoku cloud, which is a bullish sign. If the price successfully bounces from the Ichimoku support and breaks above the channel resistance, it could lead to a bullish rally.
Upside targets on

Uniswap Perfect Bullish Chart With New ATH Potential Late 2025Uniswap has a chart with perfect symmetry. It is a beautiful chart, well organized, and it shows a very strong potential for a new All-Time High to be hit later this year or in early 2026.
The market bottom happened in November 2020 for UNIUSDT. This bottom low marked the start of the 2021 bull mar


UNI Double Bottom Confirmed ?UNI push back with long green candle in support, maybe we can see double bottom here ? if yes, we can go to 5.8 or higher to 6.9

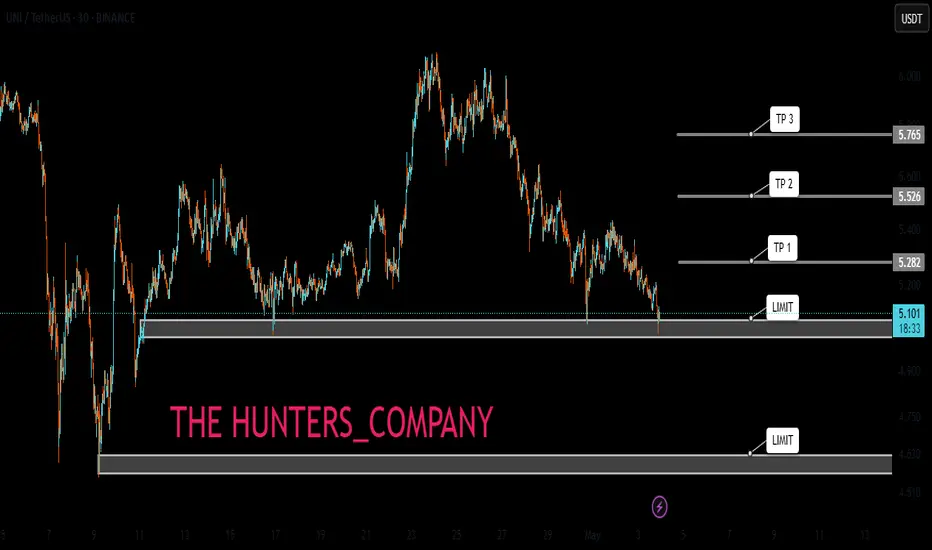
UNI:LIMIT FOR BUY(FREE)Hello friends
Due to the price drop, we can buy on the drop within the specified limits and move with it to the specified targets, of course with capital and risk management.
*Trade safely with us*
See all ideas
Summarizing what the indicators are suggesting.
Oscillators
Neutral
SellBuy
Strong sellStrong buy
Strong sellSellNeutralBuyStrong buy
Oscillators
Neutral
SellBuy
Strong sellStrong buy
Strong sellSellNeutralBuyStrong buy
Summary
Neutral
SellBuy
Strong sellStrong buy
Strong sellSellNeutralBuyStrong buy
Summary
Neutral
SellBuy
Strong sellStrong buy
Strong sellSellNeutralBuyStrong buy
Summary
Neutral
SellBuy
Strong sellStrong buy
Strong sellSellNeutralBuyStrong buy
Moving Averages
Neutral
SellBuy
Strong sellStrong buy
Strong sellSellNeutralBuyStrong buy
Moving Averages
Neutral
SellBuy
Strong sellStrong buy
Strong sellSellNeutralBuyStrong buy
Displays a symbol's price movements over previous years to identify recurring trends.