UNIThe price is moving in a rising wedge. The nearest strong resistance is at the level of $6.66. 100/200 MAs - support. I think the price will continue to rise to the nearest resistance or the upper border of the wedge
UNIUSDT.P trade ideas

uniuniswap Technical analysis basically on elliott waves analysis basically on elliott waves Principles and priceaction Strategy
uni can be grow fastly
wait and watch.

Uniswap New CycleViewing these inverted H&S patterns we can see that they are the same, just oppositely oriented, meaning we are entering an upward phase similar to that seen in the initial cycles beginning
Very bullish signal as we touch this Fibonacci level

Best unicorn - Dead unicorn🦄 Reasons to take long:
⭐️ Volume appeared
⭐️ Trendline is 24 days old
⭐️ Trendline is clean
⭐️ We are in the end of formation
⭐️ Slowly squeezing local level
⭐️ Volume entered the coin
⭐️ 46 ATR
⭐️ Under VWAP
Scenario will be invalidated if coin squeezes to trendline. Then it would be wise take short
Will enter when price squeezes to the trendline on 5m timeframe, the base will form and the tape will get faster.
If you don't understand the previous sentence, just use swing stop-loss 3-5%
Fix profit by parts:
1% - 1/3
2% - 1/3, stoploss to breakeven
What's left, hold to the maximum
What do you think of this idea? What is your opinion? Share it in the comments📄🖌
If you like the idea, please give it a like. This is the best "Thank you!" for the author 😊
P.S. Always do your own analysis before a trade. Put a stop loss. Fix profit in parts. Withdraw profits in fiat and reward yourself and your loved ones

UNIUSDTPRICE ACTION:
• Price action finds first resistance (1), where it reverses direction and goes upwards till finding first support (2).
• Price action reverse direction from support (2) and goes downwards, till finding the second resistance (3) which must be higher than the first resistance (1).
• Price action reverse direction from resistance (3) and goes upwards, till finding the second support (4), which must be higher than the first support (2).
• The pattern is completed when price action reverse direction from (4) and goes downwards till it breaks the wedge's lower border at point (5).
Trade setup:
Trade entry: at the closing rate of the candle after breaking the lower border at point (5)

uniUni in A rising chanel in 4 hour time fram
right now it got rejcted from resistance zone
if we can see more rejection so we should wait for long in trendline area
if we got break out of resistance so its easy to take a llong order

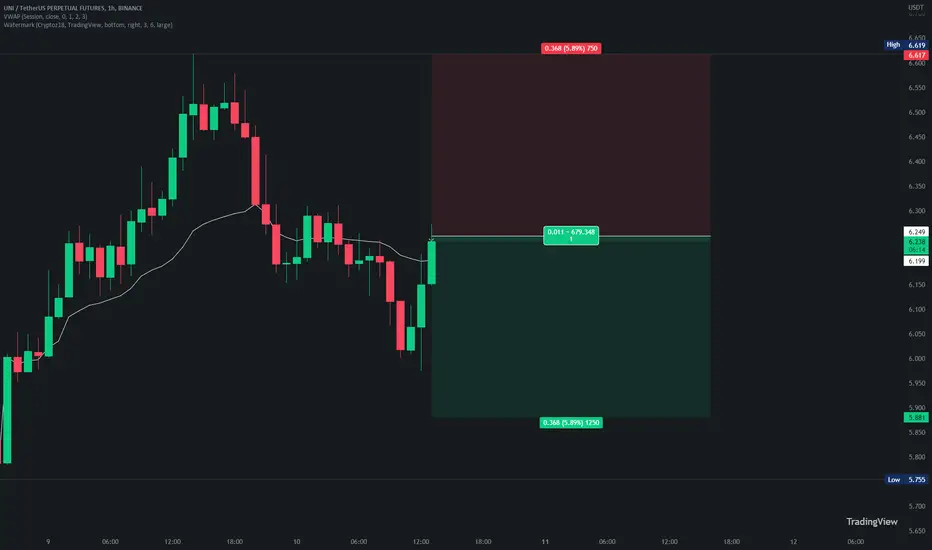
UNI could have a little bearish momentum - Cryptoz18█ Operation Information
I expect a small bearish pullback in UNI. I directly put the SL at the top since these assets are usually quite volatile due to the little marketcap.
█ Operation data
• Entry price: 6.249
• StopLoss: 6.617 (Loss 5.89%)
• TakeProfit Minimum: 5.881 (Win 5.89%)
• Recommended margin: 5% of the Futures account
• Recommended leverage: 1x.
• Temporality: 15Min - 4H
✔️ Data: The user is recommended to move the StopLoss to entry once we reach the TPM or also known as the Minimum TakeProfit.
In this way, if the trend is good for a longer timeframe, it will never touch the StopLoss placed on our entry. We will only have to pay the commissions in case we get the SL at the entrance.
Being a 15-minute trade looking to take a 4H trend it is likely to have a fairly low Winrate due to the tight StopLoss however this offers us better risk management. We try to take a 4H trend using SL and TPM of 15 minutes.
This way, we seek to obtain a profit of 100% between all operations. Only 5% of the account per operation could achieve our objective and thus obtain a return of 5-7% per month of the total account. This will be reflected at the top of our profile.
]█ Explanation of how the operations work:
Here you can find a brief explanation of how the operations work in case you are interested in following them.
█ Warning
✔️ Blockchain or FX operations represent a high risk. Therefore, this operation should not be taken as an investment recommendation. All I do is share my trade ideas publicly for the viewer to do their own analysis and decide to enter based on her own decision making. The viewer is recommended to have good risk management in their operations. To do this, take into account the fundamental data of Asset Volume, Market Capitalization, Supply, Percentage Change Price, Current Volatility, Perpetual Data, and lastly, proper Margin and Leverage management. Be careful, you can lose all your money in the future if they have poor risk management. Nothing more to say thank you very much.
UNI UNISWAP LONG 20220711UNISWAP is in Demand Zone
Risk Reward: 3
UNI, UNISWAP, UNIUSD, UNIUSDT, CRYPTO,CRYPTOCURRENCY
DISCLAIMER
This is only a personal opinion and does NOT serve as investing NOR trading advice.
Please make your own decisions and be responsible for your own investing and trading Activities.

UNIThe price moves to the lower border of the big wedge and 200 MA and forms a falling channel. I think this channel could be a bullish flag and the price will continue the uptrend.

UNI As long as we above 4.6 level we might hit the targets in 4-6 months
good luck everyone
peace :)

UNIUSDT SHARK FORMATIONShark
The Shark pattern is a distinct 5-point reversal structure that was discovered by Scott Carney in 2011. It is similar to the Bat Pattern, except for the C point exceeding the BC leg. It can point to a strong counter-trend move. The potential Reversal Zone (PRZ) is defined by the following harmonic levels: the 0.886 retracement of initial leg and the 1.13 reciprocal ratio of the initial leg. Targets can be various retracements of the CD leg, all the way up to C itself. There are different methods of determining where the stop would go. Some put it beyond the next structure level after the D point, others choose the 1.41 extension of XA.
Conservative traders look for additional confirmation before entering a trade based on an indicator value, a specific candlestick pointing at a reversal or confluence with other methods. The Shark pattern can be either bullish or bearish. It is as effective as other harmonic patterns and a common variation on trading this pattern is to trade the last leg to completion. TradingView has a smart drawing tool that allows users to visually identify this price pattern on a chart.

UNI Quick scalpTrying out this scalp, TA based on bounce from POC in consolidation.
Possible continuation to upside. will see when price reach to target where to from there.


UNI/USDTopen Long position
UNIUSDT formed head and shoulder pattern
buy : under $6.23
sell : $7.09
stp : $5.54

Update on our uni it gave 29.37% profitUpdate on our uni it gave us 29.37% profit on spot now assuming u long it with any leverage u are rich
Tho my target is 10$ to 50$ maximum in the next few months let's see what happens before then enjoy happy Sunday

UNI on the verge of breakoutUNI / USDT
Price is forming a massive falling wedge
And reached old accumulation zone where the price made over 2000% in 2021 bullrun year
A breakout from this pattern can produce strong bullish rally
Keep an eye on it !
