Giveaway 2025: Merry Christmas & Happy Holidays!Another year, another stack of charts, lessons learned the hard way, and moments where the market reminded us who’s really in charge.
As 2025 winds down, we want to say a genuine thank you. Your ideas, comments, chart screenshots, hot takes, and valuable feedback are what make TradingView what it i
Related indices

Gold % Gain vs SPX Since 1971Debt wasn’t the problem in 1971 or 1980. It became the system after 2000.
In 1980, the U.S. owed ~30% of its GDP.
In 2000, ~55%. In 2025, ~125%.
This isn’t inflation theory. It’s arithmetic!
I have long been a critic of MMT (Modern Monetary Theory)
Or, as I like to call it more accurately, OC

S&P 500 Index Approaches the 7,000-Point LevelOver the past five trading sessions, the U.S. equity index S&P 500 (SPX) has maintained a consistent bullish bias, posting gains of more than 2% in the short term and moving closer to the psychological 7,000-point level. For now, the index has managed to sustain firm buying pressure, supported by op

S&P500 rejection can cause a very bearish start to 2026.The S&P500 index (SPX) hit last Friday its Higher Highs trend-line and got rejected, so far not aggressively.
The 1D RSI rejection though on a Lower Highs trend-line that goes as back as the September 22 High, illustrates a massive Bearish Divergence (Lower Highs against price's Higher Highs), has

S&P 500 Daily Structure: Rising Wedge & Rare RSI Divergence
This chart highlights a rising wedge formation developing after a strong uptrend
on the S&P 500 Daily timeframe.
Price structure continues to print higher highs and higher lows,
while the market compresses within a narrowing range.
What makes this structure particularly interesting is the presenc

Will you be dumping all your holding before Christmas?Just wondering, how many of you will be selling all the holding position before the Christmas holidays, and re-enter again when the Christmas + New Year Holidays is over.
Despite SP500 breaking all time high yesterday, can notice the volume is reducing these few days, and in the past few years see

S&P500 breakout retest ?US equities remain in a constructive near-term setup. The S&P 500 rose another 0.64% yesterday, extending its winning streak to three sessions and leaving the index less than 0.5% below its record high. December has now turned positive again, keeping the S&P on track for an eighth consecutive monthl

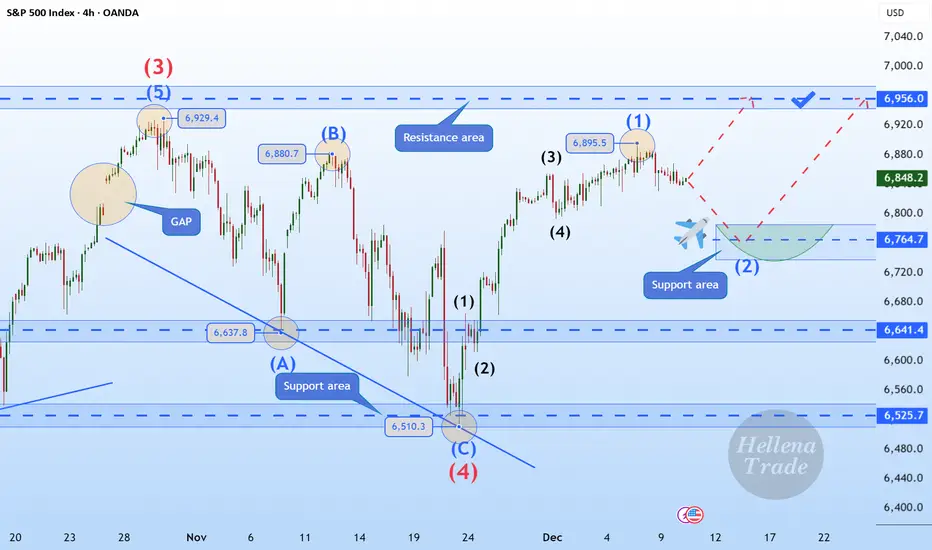
Hellena | SPX500 (4H): LONG to the area of 6956.Hello, colleagues!
I previously published a forecast for an upward movement, and I believe it is time to update the plan slightly. The direction of movement remains the same, but wave “1” has lengthened, which means that the correction in wave “2” may occur slightly higher than previously.
I expec
The S&P 500 Index Trades Near Its All-Time HighThe S&P 500 Index Trades Near Its All-Time High
As indicated by the S&P 500 index chart:
→ After breaking above the resistance line (shown in red) in the third week of December, the equity market formed an upward trend, consistent with the typical characteristics of the Santa Claus Rally.
→ At t

Ascending Wedges Mean CorrectionBig ascending wedge on the S&P coming tp a head soon. This could signal a larger drop of 20% to 30%. Several previous wedges have played out. The 200 SMA has been supportive on the 5 day chart. 5,000 to 5,300 seems reasonable.

See all ideas
Displays a symbol's value movements over previous years to identify recurring trends.
Frequently Asked Questions
US 500 reached its highest quote on Dec 26, 2025 — 6,944.0 USD. See more data on the US 500 chart.
The lowest ever quote of US 500 is 666.8 USD. It was reached on Mar 6, 2009. See more data on the US 500 chart.
US 500 is just a number that lets you track performance of the instruments comprising the index, so you can't invest in it directly. But you can buy US 500 futures or funds or invest in its components.