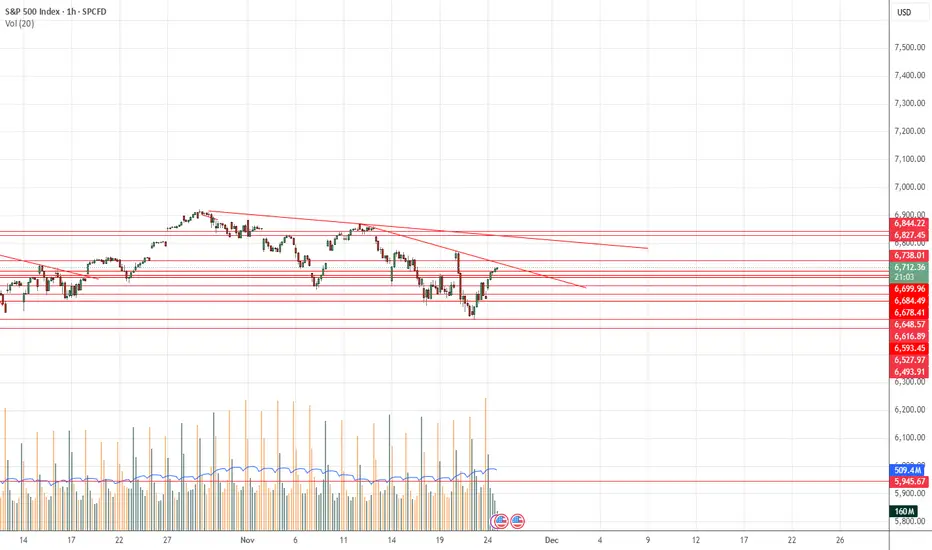
Hindenburg Omen Is Flashing AgainThe Hindenburg Omen has triggered, and it’s lining up with what the market breadth data has been whispering for months. If you look at the bottom pane, you’ll see the percentage of stocks above their major moving averages has been sliding for about six months.
So even though the index has kept pushing to new highs, fewer stocks are moving with it. A small group of mega-caps is doing all the heavy lifting, while the broader market slowly weakens underneath.
Historically, that’s exactly the kind of environment where the Hindenburg Omen becomes relevant. It doesn’t promise a crash, but it flags when internal conditions have deteriorated enough to allow one. Several past signals have occurred before meaningful corrections.
Why This Matters Now
The next couple of weeks are important. CPI, PPI and labour data between now and 10 December will shape expectations heading into the FOMC meeting. If the Fed changes tone on monetary policy, liquidity, or the path of rates, it will feed directly into sector rotation and capital flows.
That’s why I’m not committing to any major trades right now. The signals are mixed, breadth is weakening, leadership is narrow and policy risk is rising. Capital preservation comes first until we get a clear direction from the data and the Fed.
Sometimes the smartest move is patience. Let the data confirm the story. The market isn’t going anywhere.
Market insights

Sell US500 – Clear Signs of Bearish Smart-Money Flow1. Bearish structure confirmed
The previous bullish Order Block has been completely broken with a sharp displacement and high volume.
When an OB fails this decisively, it signals a clear shift in market structure from bullish to bearish as buyers lose control.
2. New Bearish Order Block formed at the break of structure
After the breakdown, price retraced back into the zone above the break and created a new VNShark-OB:
Strong breakout volume → footprint of Smart Money stepping in
Wide Imbalance (IMB) → liquidity gap left unfilled
Initial reaction from the zone → sellers defending the area
This is a typical smart-money pattern before the next bearish leg.
3. Trade Plan – Two Sell Limits
Sell Limit 1
First touch of the new OB
50% position size
Sell Limit 2
Higher liquidity sweep
100% position size
Expectation: Smart Money may push price higher to hunt liquidity before sending it lower.
4. Risk Management & Notes
No chasing if price drops without a retest
Position size according to strict risk management
Avoid trading near major news releases
Setup becomes invalid if price closes above the entire OB zone
Do not hold trades over the weekend
Signature
Follow VNShark to understand how Smart Money leaves footprints — and how you can follow them with precision.


US500How to become successful in forex and stock trading: 1.Master fundamentals and technical analysis. 2,Build and follow a solid trading plan. 3.Apply strict risk management (1–2% rule). 4.Stay disciplined—control fear and greed. 5.Record and analyze every trade. 6.Focus on high-quality setups only. 7.Diversify across assets and markets. 8.Keep evolving—study, adapt, and grow daily.

Will SPX Make New All Time Highs? We dive into the recent technical setup of the S&P500.
We are on the verge of triggering a new massive bullish patterns.
The backdrop of soft commodities. soft yields, softer dollar and the December 10 rate cute.
We have the tailwinds in place for higher price.
I would like to see some sideways chop to make this rally more sustainable, but bull market bounces are very fierce especially when they come from failed bearish patterns.

The S&P 500: The Last Stand Into Year-EndThe 2025 bull market has culminated as presented in my previous post.
The major structure topped on October 28th, with a secondary, weaker high on November 12th. What remains now is the distribution phase into the final weeks of the year—where the market decides whether it will stabilize and potentially from a double top or begin its descent into 2026.
1. Location in Structure
Price is currently trading beneath the declining angle drawn from the October and November tops.
This angle declines at $4 per day, and has acted as the defining rhythm of the post-top decline.
Top of the year: October 28
Lower high: November 12
Current position: Beneath the angle → inside potential distribution
2. The Two Paths
The market has two paths from here:
A. Bullish Path — December Rally Trigger
To challenge the November 12th high, the S&P must close above the angle.
A confirmed break of the angle → opens the path to
📈 6,860 in the first week of December
This would represent a counter-trend rally back into the underside of the broader 2025 cycle structure.
B. Bearish Path — Rejection = Lower Prices
If price rejects at the angle, it signals:
distribution is underway
momentum remains weak
the November highs are secure as the final secondary top
In this case, lower prices into December follow naturally.
3. The Message of the Structure (And more Charts to keep up on)
The larger cycle has already ended.
We are now watching the small-scale geometry that governs how the year will close:
beneath the angle → distribution
above the angle → December rally
SUMMARY
What remains now is the micro-geometry that will determine how the year closes:
Beneath the declining angle → distribution continues
Above the angle → a December rally opens toward 6,860
While the market could attempt to press toward new highs, the probability is very low — and would be surprising given the current economic backdrop and the clear contraction emerging from a dominant sector of the market.
The structure, motion, and fundamentals all argue that the 2025 peak is already in.

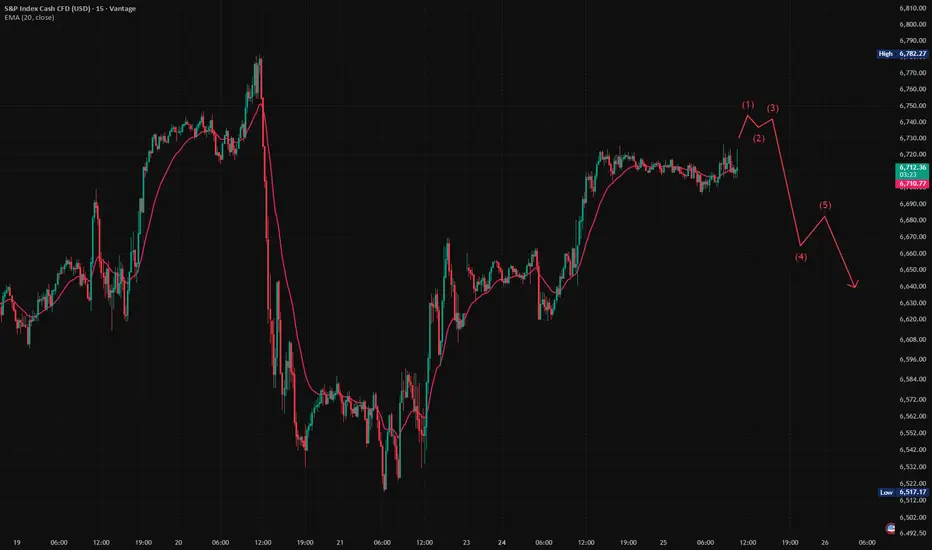
S&P 500 Roadmap: Correction Rally Ending—Another Drop Is ComingAs I expected in the previous idea , the S&P 500 index( SP:SPX ) moved toward the broken Support lines and completed its pullback, reaching its targets.
Given that the S&P 500 index nowadays shows a significant correlation with the cryptocurrency market and Bitcoin( BINANCE:BTCUSDT ), it’s wise to pay even more attention to this index, as it can help us gauge the crypto market trends.
The S&P 500 is approaching a Resistance zone($6,675_$6,637), and considering the momentum of last weekend’s decline, it appears that this recent upward movement is merely a correction. Therefore, we should expect another decline in the S&P 500.
Since the U.S. dollar index( TVC:DXY ) is also likely to maintain an upward trend, the rise in the dollar can lead to more capital flowing into safer assets, potentially impacting the S&P 500 negatively.
The S&P 500 is also influenced by the US 10-Year Government Bond Yield( TVC:US10 ). If the US 10-Year Government Bond Yield trends upwards , then riskier assets like cryptocurrencies might go down more, and this, in turn, could also impact the S&P 500.
Considering all the above, I expect that the S&P 500 will at least test its Support zone($6,580_$6,490) again and, if that Support zone($6,580_$6,490) is broken, we could anticipate further declines in the U.S. stock market and the S&P 500.
First Target: $6,526
Second Target: $6,413
Stop Los(SL): $6,731
💡 Please respect each other's opinions and express agreement or disagreement politely.
📌S&P 500 Index Analyze (SPX500USD), 4-hour time frame.
🛑 Always set a Stop Loss(SL) for every position you open.
✅ This is just my idea; I’d love to see your thoughts too!
🔥 If you find it helpful, please BOOST this post and share it with your friends.

Watch the banksKRE (regional banks) is looking like it's setting up a potential C wave down. If so, there's something wrong in that sector and it will drag the market down with it, especially IWM.
AAPL probably a false breakout here and I expect a large move down.

$SPY Bullish structure on lower time frames looks dangerousAMEX:SPY Bullish structure on lower time frames looks dangerous.
Expect to retrace most of it today or tomorrow.
SPX500 Short
Deep crab pattern completes on M15, mapping a potential reversal zone.
Multiple tops formed on M15 and M30 at the same area, reinforcing overhead supply from the prior day’s high that price could not break.
RSI reached overbought on M15 and M30, indicating crowded long positioning.
Approximately 20 points of RSI bearish divergence across M15 and M30, consistent with a weakening advance.
H4 has turned down after last week’s rebound and now aligns with a downside continuation view.
Daily slope is flattening and price is trading beneath it, suggesting the early stages of a broader reversal can develop if sellers follow through.
Bias is short of the reversal zone identified by the deep crab and repeated tops.
Stop loss set at 50 pips to cap risk if resistance fails.
First target at 6,600, which is 100 pips from entry, with room to manage partials at nearby structure if momentum confirms.
Several US indices and other global indices are printing similar topping behavior and momentum fades, adding intermarket confluence to the short idea.

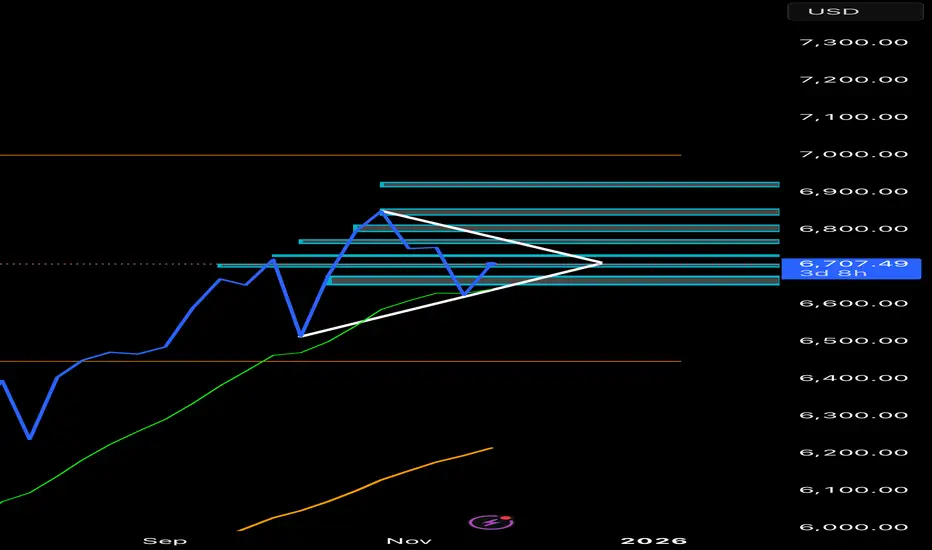
Weekly Bullish PennantPossible Bullish pennant forming on weekly.
Looking for price to keep forming pennant.
Could see a possible breakout December or January.
S&P500 rally to continue? The S&P 500 extended its rebound yesterday, rising +1.55% for its best session in six weeks and +2.54% over two days, helped by growing expectations of a Fed rate cut in two weeks. Sentiment was also lifted by renewed tech optimism and headlines suggesting progress in Ukraine ceasefire talks, which supported equities, credit, and bonds.
In tech, Nvidia fell on reports Meta may shift billions in AI-chip spending toward Google, while Alphabet gained on stronger AI momentum. Geopolitical risk remains elevated as Russia and Ukraine traded heavy fire despite diplomatic activity, but markets are focusing on the possibility of de-escalation.
Overall: Momentum remains constructive for the S&P today, with supportive macro drivers, but tech dispersion and geopolitics could create intraday volatility.
Key Support and Resistance Levels
Resistance Level 1: 6770
Resistance Level 2: 6800
Resistance Level 3: 6823
Support Level 1: 6660
Support Level 2: 6640
Support Level 3: 6613
This communication is for informational purposes only and should not be viewed as any form of recommendation as to a particular course of action or as investment advice. It is not intended as an offer or solicitation for the purchase or sale of any financial instrument or as an official confirmation of any transaction. Opinions, estimates and assumptions expressed herein are made as of the date of this communication and are subject to change without notice. This communication has been prepared based upon information, including market prices, data and other information, believed to be reliable; however, Trade Nation does not warrant its completeness or accuracy. All market prices and market data contained in or attached to this communication are indicative and subject to change without notice.

S&P500 Final rally to 6925, then sell-off to 1D MA200?The S&P500 index (SPX) had a massive Friday rebound on its 1D MA100 (green trend-line) and yesterday touched again its 1D MA50 (blue trend-line), this time as a Resistance.
If it manages to break and close a 1D candle above it, we expect the current rebound to continue and evolve into the end-of-year rally and test at least the ATH Resistance at 6925.
The 1D RSI sequence suggests that we may be currently inside a same pattern as the December 2024 - January 2025 fractal, which after a 1D MA100 rebound it hit the ATH Resistance again and then got heavily rejected back to the 1D MA200 (orange trend-line) and beyond.
As a result, after the rally, our medium-term Target is 6300 (expected contact with the 1D MA200).
---
** Please LIKE 👍, FOLLOW ✅, SHARE 🙌 and COMMENT ✍ if you enjoy this idea! Also share your ideas and charts in the comments section below! This is best way to keep it relevant, support us, keep the content here free and allow the idea to reach as many people as possible. **
---
💸💸💸💸💸💸
👇 👇 👇 👇 👇 👇

S&P500 H1 | Bearish Reaction Off Key ResistanceMomentum: Bearish
Price is currently below the ichimoku cloud.
Sell entry: 6,711.35
- Strong pullback resistance
- 78.6% Fib retracement
- 100% Fib projection
Stop Loss: 6,785.20
- Overlap resistance
Take Profit: 6,641.93
- Overlap support
High Risk Investment Warning
Stratos Markets Limited (tradu.com/uk ), Stratos Europe Ltd (tradu.com/eu ):
CFDs are complex instruments and come with a high risk of losing money rapidly due to leverage. 70% of retail investor accounts lose money when trading CFDs with this provider. You should consider whether you understand how CFDs work and whether you can afford to take the high risk of losing your money.
Stratos Global LLC (tradu.com/en ): Losses can exceed deposits.
Please be advised that the information presented on TradingView is provided to Tradu (‘Company’, ‘we’) by a third-party provider (‘TFA Global Pte Ltd’). Please be reminded that you are solely responsible for the trading decisions on your account. Any information and/or content is intended entirely for research, educational and informational purposes only and does not constitute investment or consultation advice or investment strategy. The information is not tailored to the investment needs of any specific person and therefore does not involve a consideration of any of the investment objectives, financial situation or needs of any viewer that may receive it. Past performance is not a reliable indicator of future results. Actual results may differ materially from those anticipated in forward-looking or past performance statements. We assume no liability as to the accuracy or completeness of any of the information and/or content provided herein and the Company cannot be held responsible for any omission, mistake nor for any loss or damage including without limitation to any loss of profit which may arise from reliance on any information supplied by TFA Global Pte Ltd.

Currency Peg Rates and Their Role in the Global Market1. What Are Currency Pegs?
A currency peg is an agreement by a government or central bank to maintain its currency at a fixed exchange rate relative to another currency. Common anchors include:
US Dollar (USD) – most dominant
Euro (EUR) – used by countries in Europe or those influenced by EU trade
A basket of currencies – used by nations wanting diversified stability
Examples include:
Hong Kong dollar peg to USD
Saudi riyal peg to USD
Danish krone peg to Euro
In a pegged system, the central bank must intervene in the forex market—buying or selling foreign reserves—to maintain the peg.
2. Why Countries Use Currency Pegs
A. To Promote Trade Stability
Trade depends heavily on predictable currency values. When a country pegs its currency to that of a major trading partner, exporters and importers face fewer exchange-rate risks. This stability helps:
Boost long-term trade agreements
Encourage foreign direct investment (FDI)
Reduce transaction costs
For example, Gulf countries selling oil in USD benefit from a USD peg since their export revenues stay stable.
B. To Control Inflation
Countries with historically volatile monetary systems use pegs to “import stability” from stronger economies. Pegging to a disciplined currency forces domestic monetary policy to align with the anchor country’s stability. This helps:
Reduce hyperinflation
Maintain price stability
Build investor trust
Argentina, for instance, used a USD peg in the 1990s to curb runaway inflation.
C. To Attract Foreign Investment
Foreign investors prefer stable exchange rates. Pegs give clarity and reduce forex risk, which is appealing for:
Portfolio investors
Foreign companies setting up factories
Global banks
Stable currencies reduce uncertainty and encourage long-term investment.
D. To Protect Small or Open Economies
Small economies with limited export diversity or unstable political environments benefit greatly from a fixed currency. Pegs help maintain:
Financial order
Market confidence
Predictable business conditions
This is why many island nations and resource-dependent economies use fixed exchange rates.
3. How Currency Pegs Work in the Global Market
A. Central Bank Intervention
To maintain the peg, the central bank must buy or sell foreign reserves.
If the domestic currency weakens, the central bank sells foreign reserves to support it.
If it strengthens, the central bank buys foreign currency to prevent appreciation.
This mechanism keeps the domestic currency within a defined band.
B. The Role of Foreign Exchange Reserves
Countries with pegs must maintain large forex reserves. These reserves act as a buffer to defend the peg during market volatility.
China, Saudi Arabia, and Hong Kong maintain significant reserves for this reason.
C. Impact on Global Capital Flows
Pegs influence how money moves across borders. A stable peg can attract capital inflows, while a weak or unsustainable peg can trigger:
Speculative attacks
Rapid capital outflows
Market panic
The 1997 Asian Financial Crisis is a classic example where unsustainable fixed rates caused speculative attacks.
4. Advantages of Currency Pegs in the Global Market
A. Stability for Trade and Investment
Currency pegs reduce exchange-rate volatility, supporting international trade and long-term contracts.
B. Confidence Building
Investors and trading partners trust economies whose currencies behave predictably.
C. Lower Inflation
Pegs can anchor domestic prices to those of more stable economies.
D. Strategic Trade Advantages
Countries can peg at undervalued levels to maintain export competitiveness. China historically used a partially managed peg for this purpose.
5. Challenges and Risks Associated with Currency Pegs
A. Loss of Monetary Policy Independence
The biggest drawback is that a country cannot freely decide its interest rates. It must follow the monetary policy of the anchor country to maintain the peg.
This can be problematic during domestic recessions or inflationary pressures.
B. Requirement of Large Forex Reserves
Defending a peg requires massive reserves, which is costly. Without sufficient reserves, the peg becomes vulnerable.
C. Vulnerability to Speculative Attacks
If traders believe a peg is unsustainable, they can short the currency. This can collapse the peg, as seen in:
Thailand (1997)
Mexico (1994)
Argentina (2001)
D. Economic Distortions
A peg can create artificial stability. If the currency is pegged too high or too low, it can misrepresent true economic conditions, leading to:
Trade imbalances
Over-reliance on imports
Asset bubbles
6. Currency Pegs and Global Economic Events
A. During Oil Price Shocks
Oil-exporting countries with USD pegs remain stable because oil is traded globally in dollars. Pegs help smooth revenue fluctuations.
B. During Financial Crises
Some countries break their pegs during crises to regain monetary control, while others defend their pegs to maintain confidence.
C. During Global Inflation Waves
When the anchor currency experiences inflation (e.g., USD inflation cycles), countries pegged to it import inflation as well. This can create stress on domestic economies.
7. How Pegs Influence Global Trade Dynamics
Currency pegs can make countries more competitive in global markets. For example:
If a currency is pegged at a lower level, exports become cheaper.
If pegged too high, imports become cheaper but exports suffer.
This can trigger global reactions, including tariff threats or currency war accusations.
8. The Future of Currency Pegs
Even as digital currencies and floating rates dominate modern finance, currency pegs continue to play a vital role. Many countries rely on them for stability, while some use hybrid systems:
Managed float with a peg band
Basket-based pegging
Pegged but adjustable systems
With growing geopolitical tensions, shifts in trade alliances, and rising interest-rate cycles, pegs will remain influential tools in shaping global markets.
Conclusion
Currency peg rates are powerful tools that shape global economic behaviour. By tying a currency to a stable or strategically chosen anchor, countries can enhance trade stability, control inflation, and attract investment. However, they also face challenges such as loss of monetary independence, speculative risks, and heavy reliance on foreign reserves.
In the global market, currency pegs are both stabilizers and potential sources of volatility—depending on how well they are maintained. Their importance will continue as countries navigate an increasingly interconnected and uncertain economic environment.
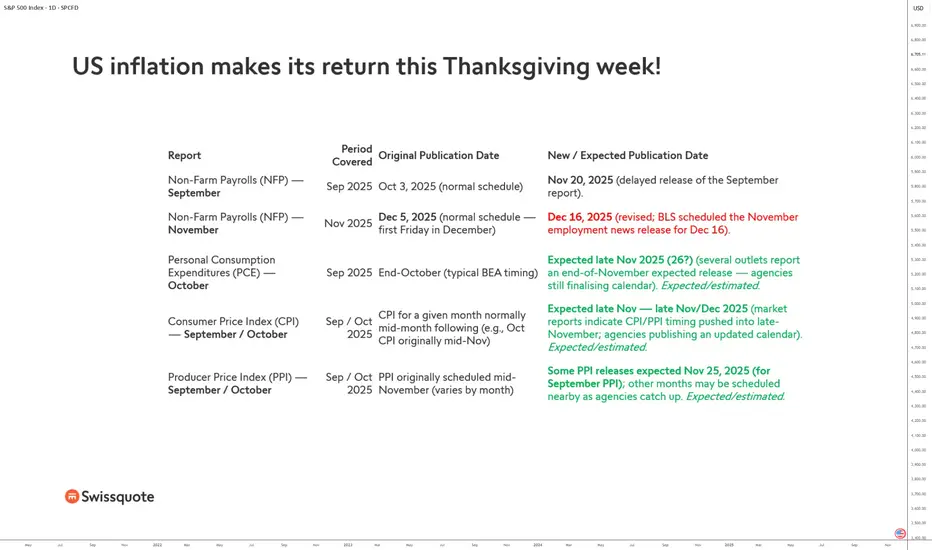
US inflation makes its return this Thanksgiving week!For several weeks, financial markets have been operating with reduced visibility. The reason: the latest U.S. shutdown, which paralyzed part of the federal administration and caused an exceptional delay in the publication of numerous major macroeconomic statistics. Yet these figures, usually released according to a precise schedule, form the analytical backbone for investors and for the Federal Reserve (Fed). The situation should finally normalize during this Thanksgiving week, with a long-awaited catch-up, particularly regarding PCE inflation, the Fed’s preferred inflation indicator.
One of the most notable delays concerns the Non-Farm Payrolls (NFP) series. The September report, originally scheduled for October 3, was only released last Thursday. The November report, normally published in early December, will not appear until December 16—after the Fed’s December 10 meeting. These delays are due to the need for U.S. statistical agencies to rebuild their data and validation processes after several weeks of forced shutdown.
But the central focus of market attention remains the PCE (Personal Consumption Expenditures) index for October, a key figure for anticipating the Fed’s monetary stance at its December 10 meeting. This report was expected at the end of October under the standard Bureau of Economic Analysis (BEA) timeline. Now, several converging sources indicate a release expected this week, likely on November 25 and 26, as agencies finalize their revised calendar. It is therefore during Thanksgiving week that investors will finally receive these crucial numbers.
The uncertainty does not end there. Consumer Price Index (CPI) and Producer Price Index (PPI) reports for September and October have also been delayed. Markets now anticipate publication “late November to early December,” giving agencies time to fully adjust their distribution processes.
Some components of the PPI, particularly for September, may be released as soon as November 25, with remaining figures following shortly after.
This major catch-up comes at a decisive moment. With the Fed set to decide on December 10 about a potential adjustment to its monetary policy, every inflation data point carries considerable weight. The PCE numbers, in particular, will provide a clearer snapshot of price dynamics during the autumn, and therefore of the central bank’s room for maneuver should it consider a 0.25% rate cut.
DISCLAIMER:
This content is intended for individuals who are familiar with financial markets and instruments and is for information purposes only. The presented idea (including market commentary, market data and observations) is not a work product of any research department of Swissquote or its affiliates. This material is intended to highlight market action and does not constitute investment, legal or tax advice. If you are a retail investor or lack experience in trading complex financial products, it is advisable to seek professional advice from licensed advisor before making any financial decisions.
This content is not intended to manipulate the market or encourage any specific financial behavior.
Swissquote makes no representation or warranty as to the quality, completeness, accuracy, comprehensiveness or non-infringement of such content. The views expressed are those of the consultant and are provided for educational purposes only. Any information provided relating to a product or market should not be construed as recommending an investment strategy or transaction. Past performance is not a guarantee of future results.
Swissquote and its employees and representatives shall in no event be held liable for any damages or losses arising directly or indirectly from decisions made on the basis of this content.
The use of any third-party brands or trademarks is for information only and does not imply endorsement by Swissquote, or that the trademark owner has authorised Swissquote to promote its products or services.
Swissquote is the marketing brand for the activities of Swissquote Bank Ltd (Switzerland) regulated by FINMA, Swissquote Capital Markets Limited regulated by CySEC (Cyprus), Swissquote Bank Europe SA (Luxembourg) regulated by the CSSF, Swissquote Ltd (UK) regulated by the FCA, Swissquote Financial Services (Malta) Ltd regulated by the Malta Financial Services Authority, Swissquote MEA Ltd. (UAE) regulated by the Dubai Financial Services Authority, Swissquote Pte Ltd (Singapore) regulated by the Monetary Authority of Singapore, Swissquote Asia Limited (Hong Kong) licensed by the Hong Kong Securities and Futures Commission (SFC) and Swissquote South Africa (Pty) Ltd supervised by the FSCA.
Products and services of Swissquote are only intended for those permitted to receive them under local law.
All investments carry a degree of risk. The risk of loss in trading or holding financial instruments can be substantial. The value of financial instruments, including but not limited to stocks, bonds, cryptocurrencies, and other assets, can fluctuate both upwards and downwards. There is a significant risk of financial loss when buying, selling, holding, staking, or investing in these instruments. SQBE makes no recommendations regarding any specific investment, transaction, or the use of any particular investment strategy.
CFDs are complex instruments and come with a high risk of losing money rapidly due to leverage. The vast majority of retail client accounts suffer capital losses when trading in CFDs. You should consider whether you understand how CFDs work and whether you can afford to take the high risk of losing your money.
Digital Assets are unregulated in most countries and consumer protection rules may not apply. As highly volatile speculative investments, Digital Assets are not suitable for investors without a high-risk tolerance. Make sure you understand each Digital Asset before you trade.
Cryptocurrencies are not considered legal tender in some jurisdictions and are subject to regulatory uncertainties.
The use of Internet-based systems can involve high risks, including, but not limited to, fraud, cyber-attacks, network and communication failures, as well as identity theft and phishing attacks related to crypto-assets.
SnP500 channelSnp performance over the years covering lows and highs and drops along the way. I am bearish because BTC has corrected but the SnP has not yet.

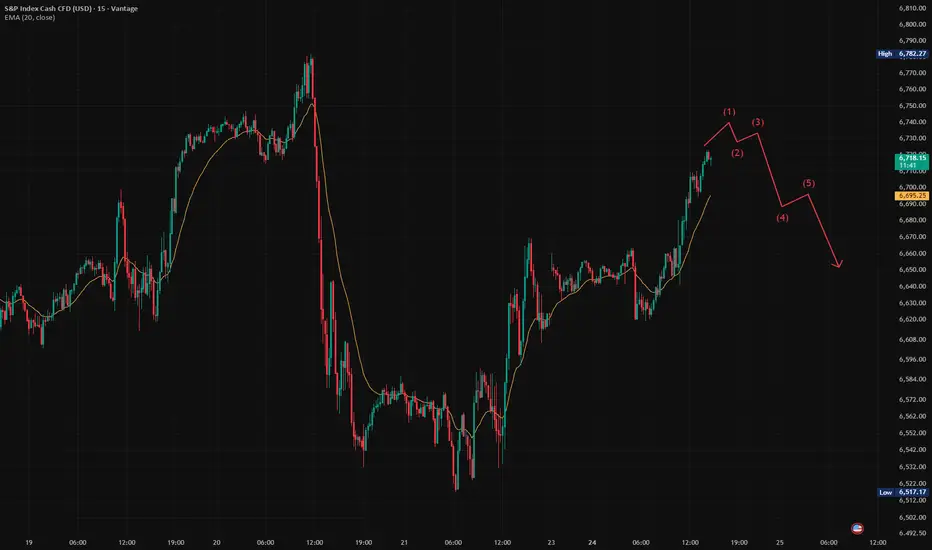
$SPX - Turkey WeekI made this turkey with my strong hand:
Bulls seek to close >6700
Bears seek to contain <6700, IDEALLY <6600
OUTLOOK = choppy, bumpy, and fun - keep it small, keep it tight like a tiger
Feel free to comment or add input 💪
Inside modified pitchfork anchors on macro
cyan trend line = .618
fusia = median
LARGER TF POSTED BELOW

spx levels for this weekright now it's making lower lows, break above 6771 level bulls will catch the run
$SPY bullishness today is not looking goodThis is a clear trading range. Trading ranges always have on thing in common and that is that they are usually keep going back to the middle.
S&P 500 May Be Finding SupportThe S&P 500 has been under pressure since late October, but some traders may think the index is trying to stabilize.
The first pattern on today’s chart is the October 10 low of 6,551. Prices probed and held the level last week with another bounce today. That may suggest it’s become support.
Interestingly, S&P Global data shows index members’ combined earnings up about 2 percent since the last test of the zone.
Third, the pullback since October 28 may be interpreted as a completed A-B-C correction.
Fourth, SPX may be trying to bounce at its rising 100-day simple moving average.
Next, stochastics are turning up from an oversold condition.
Finally, last week’s low represents a 50 percent retracement of the advance above February’s high. Staying above it may confirm an upward direction.
TradeStation has, for decades, advanced the trading industry, providing access to stocks, options and futures. If you're born to trade, we could be for you. See our Overview for more.
Past performance, whether actual or indicated by historical tests of strategies, is no guarantee of future performance or success. There is a possibility that you may sustain a loss equal to or greater than your entire investment regardless of which asset class you trade (equities, options or futures); therefore, you should not invest or risk money that you cannot afford to lose. Online trading is not suitable for all investors. View the document titled Characteristics and Risks of Standardized Options at www.TradeStation.com . Before trading any asset class, customers must read the relevant risk disclosure statements on www.TradeStation.com . System access and trade placement and execution may be delayed or fail due to market volatility and volume, quote delays, system and software errors, Internet traffic, outages and other factors.
Securities and futures trading is offered to self-directed customers by TradeStation Securities, Inc., a broker-dealer registered with the Securities and Exchange Commission and a futures commission merchant licensed with the Commodity Futures Trading Commission). TradeStation Securities is a member of the Financial Industry Regulatory Authority, the National Futures Association, and a number of exchanges.
TradeStation Securities, Inc. and TradeStation Technologies, Inc. are each wholly owned subsidiaries of TradeStation Group, Inc., both operating, and providing products and services, under the TradeStation brand and trademark. When applying for, or purchasing, accounts, subscriptions, products and services, it is important that you know which company you will be dealing with. Visit www.TradeStation.com for further important information explaining what this means.

S&P 500 Surges to Pivotal Resistance- Decision time for BullsThe S&P 500 has rallied nearly 3% off the monthly low and is approaching the first major test of the late-October downtrend. Resistance is eyed at 50% retracement of the decline at 6715 and is backed closely by the 61.8% retracement at 6764. A breach / daily close above the August trendline is needed to suggest a more significant low is in place with subsequent objectives eyed at the monthly open at 6842. Key resistance remains unchanged at 6911/986.
Support rests with the October low at 6500 and losses below this threshold would threaten resumption of the near-term downtrend with the next major technical consideration seen at 6408/21- a region defined by the 1.618% extension of the October decline and the 23.6% retracement of he yearly range. Look for a larger reaction there IF reached.
Bottom line: The S&P 500 is approaching downtrend resistance early in the week and the outlook remains tilted to the downside while within this formation. Look for a reaction into 6715 for guidance in the days ahead. From a trading standpoint, losses would need to be limited to the monthly low-day close / weekly open at 6574 IF price is heading for a breakout here with a breach above 6764 needed to fuel the next leg.

S&P 500 – Upside TargetDow Jones & S&P 500 – Testing Key Support After a One-Month Decline
Both the Dow Jones and the S&P 500 have pulled back over the past month and are now approaching a significant support area. This zone continues to attract the attention of investors, indicating that demand remains strong despite recent weakness.
Based on the current order flow and buying interest seen in the market, the broader long-term trend for both indices still appears bullish.
S&P 500 – Upside Target
For the S&P 500, the first major upside target is located near 7000, and there is a strong possibility that price could reach this level within the next month if buying pressure continues.
Sasha Charkhchian
