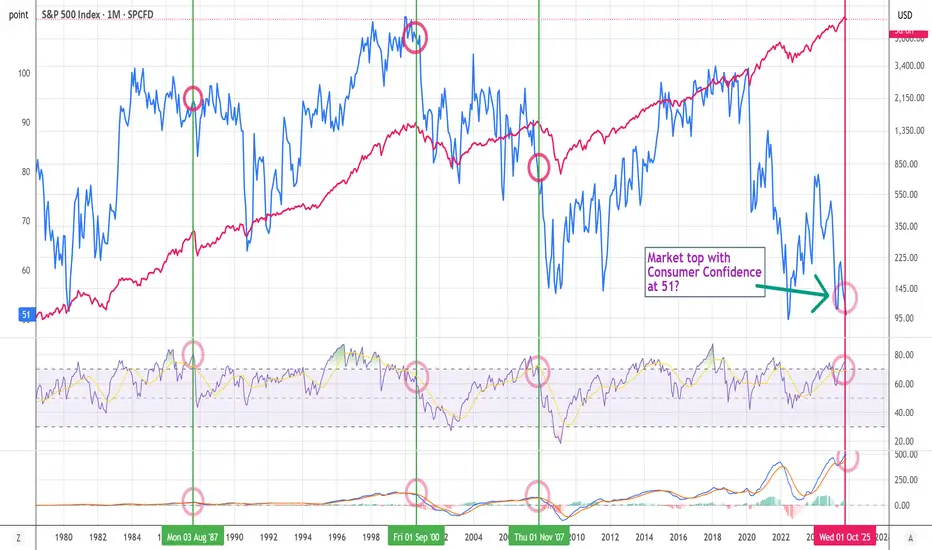
Consumer sentiment vs SPX - Is this the top?🧠 Historically, market tops happen when optimism peaks — not when consumers feel miserable.
Today, the U.S. Consumer Confidence Index sits at just 51, near recessionary levels.
Hard to call this a “market top” when sentiment is this low.
#SPX #Macro #MarketCycle #Investing
Market insights
Bear Case for DecemberBear Case for December.
Looking for the sell off to continue.
Decent R/R with a clear "stop" level above us.

sp500 4h🔹 Overall Outlook and Potential Price Movements
In the charts above, we have outlined the overall outlook and possible price movement paths.
As shown, each analysis highlights a key support or resistance zone near the current market price. The market’s reaction to these zones — whether a breakout or rejection — will likely determine the next direction of the price toward the specified levels.
⚠️ Important Note:
The purpose of these trading perspectives is to identify key upcoming price levels and assess potential market reactions. The provided analyses are not trading signals in any way.
✅ Recommendation for Use:
To make effective use of these analyses, it is advised to manually draw the marked zones on your chart. Then, on the 15-minute time frame, monitor the candlestick behavior and look for valid entry triggers before making any trading decisions.

$SPX: dead cat bounce SP:SPX : Following the unexpected downturn on Thursday, SP:SPX stabilized last Friday after an intraday decline below the horizontal support at 6,550, which aligns with the 100-day simple moving average (SMA). The candlestick wicks on the daily chart suggest a potential short-term pause in the prevailing selling pressure. Monday will probably see a continuation of the rebound from Friday’s lows; however, it remains unclear whether Friday’s low marks the end of the current pullback. The RSI14 is approaching, but not yet within, oversold territory, and does not exhibit positive divergence. For the upside scenario, retracement levels from Friday’s high have been identified. Bulls must first reclaim the 6,530 resistance to maintain momentum; nevertheless, unless the key resistance at 6,770—168 points above Friday’s close—is breached, the probability of another downward move remains elevated, targeting the 6,360–6,340 region.
SP500 to 5700It was not the AI bubble, it was Venezuela.
This is an idea linked to a possible intervention of US military in Venezuela, provided some airlines (Iberia, Tap,...) have cancelled their flights to the country on Nov 22nd.
If this happens, we can see Oil going up, affecting the whole stock market.
We can see what happened during Ukraine War, also linked to energy prices.

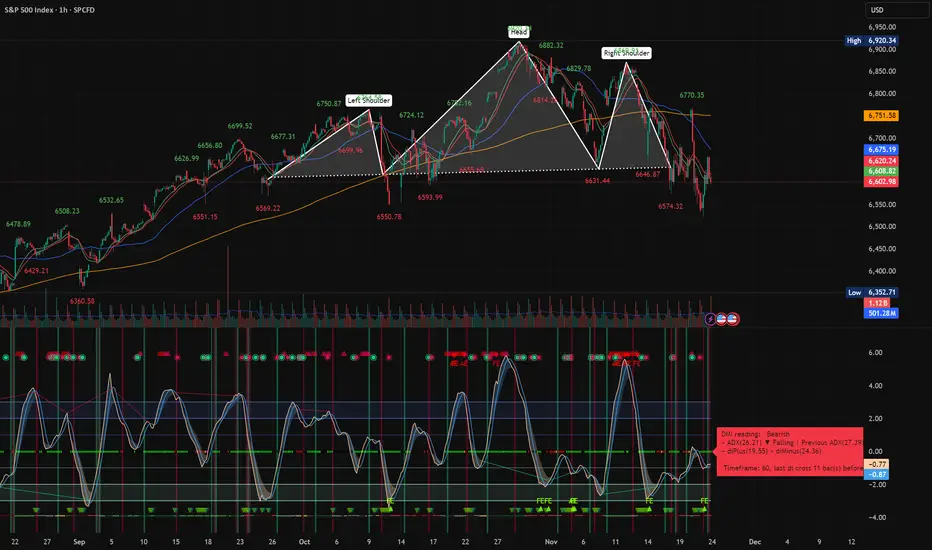
Head and Shoulders on SPXAt the core of the current setup is a fully formed Head and Shoulders pattern, which has already broken its neckline and is now in the process of playing out its measured-move target. The left shoulder formed around 6750, the head extended to roughly 6882, and the right shoulder peaked near 6829. The neckline, positioned around 6590–6630, was decisively broken. This is crucial because a neckline break with momentum and no immediate reclaim typically confirms that a bearish trend has begun. The measured downside projection, based on subtracting the pattern height from the neckline, lands near 6350, which is also a visible structural level on the chart—adding confluence to the target.
Trend structure reinforces this bearish posture. Price is trading below both the 50 EMA and the 200 EMA, creating a dual timeframe downtrend. The 50 EMA has curled downward, illustrating a clear loss in short-term strength, while the 200 EMA has acted as resistance rather than support—another hallmark of a shift in momentum. Attempts to rally back above the neckline have been weak and short-lived, showing that buyers lack control. Until price can reclaim the neckline and hold above it, the path of least resistance remains to the downside.
Volume behavior also strengthens the bearish case. Downward moves are accompanied by heavier volume, while bounce attempts show declining volume and little enthusiasm. Frequent cluster WVF signals—AE, FE, and other markers—concentrated before the breakdown. Clusters that appear before structural breaks often signal distribution. Since no capitulation spike has appeared yet, it is likely that the move is not finished. VIX is above 26, as well and curling upwards.
On the lower panel, the Momentum Oscillator is oversold, but importantly, it has not produced a strong upward reversal. Historically, similar deep dips with hesitation tend to precede an additional flush lower before the next meaningful bounce. Meanwhile, the DMI (Directional Movement Index) gives a clear bearish reading. The displayed values show ADX falling from a higher level and –DI outperforming +DI. A falling ADX during a bearish configuration suggests that although the trend is bearish, the strength of acceleration is cooling slightly—often a pause before continuation. The “last DI cross 11 bars ago” informs us that this downtrend is still young; past cycles in this chart tend to run significantly longer, suggesting more room for follow-through.
Altogether, the evidence points to a strong bearish bias. The breakdown from the Head and Shoulders pattern, rejection from both EMAs, confirming volume, bearish DMI, and lack of bullish divergence collectively support a continued decline toward the 6350 region. A rally could occur, but unless it recaptures the 50 EMA and the neckline, any bounce is likely to be corrective rather than trend-changing. For now, the most probable direction remains downward, with the measured move target representing a logical destination before any larger reversal attempt emerges.
SPX Gann boxSPX is currently turning bearish and its second motive wave of maximum 3 or 4 motive ways down according to wave count. We finished 1st wave of second bigger wave and its consolidation and are now in 2nd wave of 2nd bigger wave. Gann Box gives us time and price targets relative to length and duration of the first wave for SPX second wave down.
i highlited upcoming fibs and strong horizontal resistance. Astonishingly they fit perfectly together.

Bullish continuation of US500Looks like a pullback on the downtrend of the US500, may potentially move upto 6750 in the coming week(s).

US500 - Oversold at Triple Confluence… Bounce Incoming?US500 is approaching a major oversold zone, where three powerful elements intersect at the same point:
• The lower bound of the falling red channel
• The blue long-term trendline
• The orange structure zone acting as demand
⚔️This alignment creates a strong confluence area, a spot where buyers usually step in to absorb selling pressure and trigger corrective moves.
As long as the index holds above this zone, we can expect the possibility of a bullish correction toward the upper trendlines. But if this area fails, the structure would weaken and open the door for deeper downside.
Right now, all eyes are on this confluence… will the US500 bounce from the oversold zone, or break through it? 🤔
⚠️ Disclaimer: This is not financial advice. Always do your own research and manage risk properly.
📚 Stick to your trading plan regarding entries, risk, and management.
Good luck! 🍀
All Strategies Are Good; If Managed Properly!
~Richard Nasr.

Last chance for SPX500USD to go upHi traders,
Last week SPX500USD dropped, went corrective up and dropped again.
The pattern changed. Now it could become an (orange) wave 4 Triangle (if it doesn't break the grey arrow) or it finished a Zigzag.
So next week we could see more (corrective or impulsive) upside for this pair.
Let's see what the market does and react.
Trade idea: Wait for a small correction down on a lower timeframe. After a change in orderflow to bullish you could trade longs.
This shared post is only my point of view on what could be the next move in this pair based on my technical analysis.
But I react and trade on what I see in the chart, not what I've predicted or expect.
Don't be emotional, just trade your plan!
Eduwave

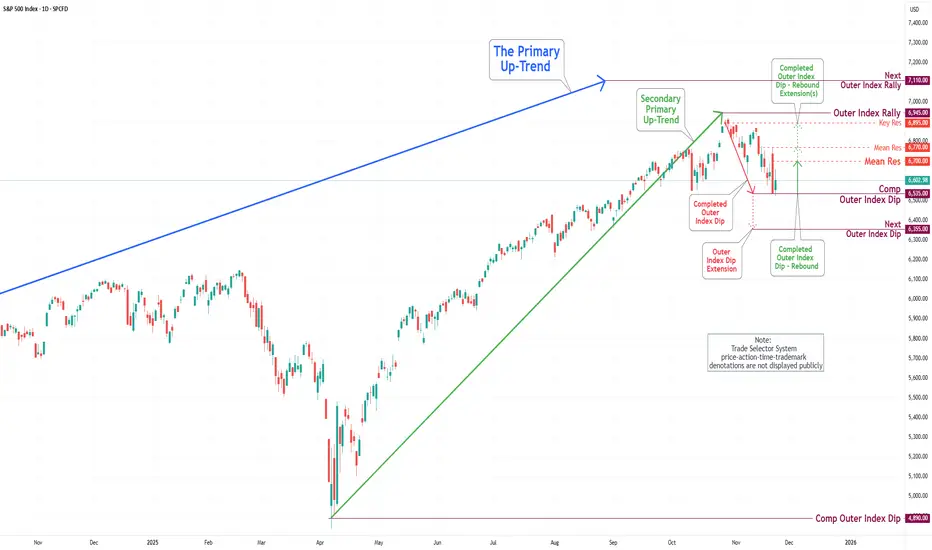
S&P 500 Daily Chart Analysis For Week of Nov 21, 2025Technical Analysis and Outlook:
In the last trading session, the S&P 500 Index exhibited significant gyrations, implying a pump-and-dump scenario and highlighting the significance of our completed Outer Index Dip at 6,535.
At present, this position suggests the possibility of further upward movement, with the primary targets established at the Mean Resistance levels of 6,700 and possibly 6,770. Furthermore, there exists a well-defined extension towards the Key Resistance level of 6,895, with an ultimate target for the Outer Index Rally set at 6,945.
Nonetheless, it is imperative to acknowledge the risk of a potential drawdown in the forthcoming trading session. Such an event could result in prices retesting the completed Outer Index Rally at 6,535, as well as the expansion towards the next Outer Index Rally at 6,355.
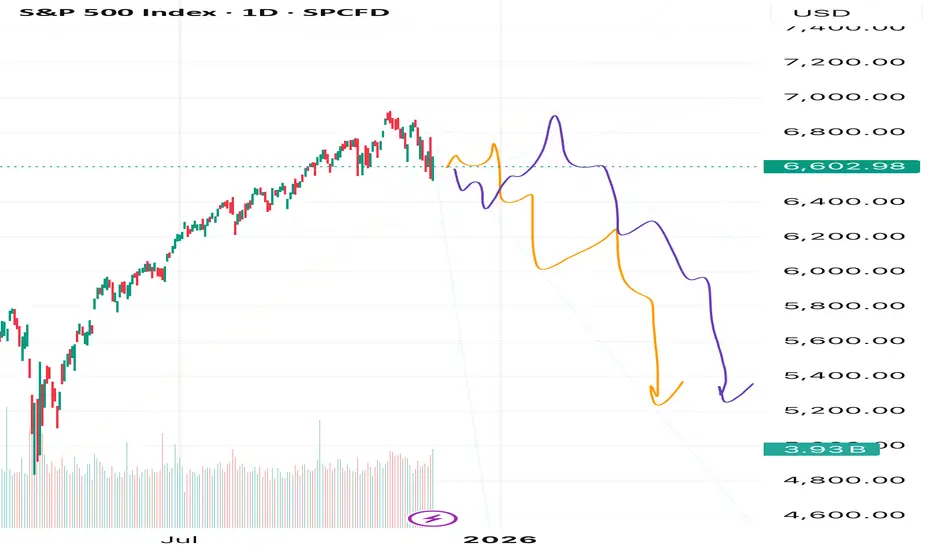
A Historic Shift in the S&P 500 Is BeginningFriends, in my view, the unstoppable rally in the S&P 500 has finally come to an end. The market has completed a massive five-wave structure with an extended fifth wave — and now we’re witnessing a historic moment as an exceptionally large correction begins.
As always, I’m watching two possible scenarios: the orange path and the purple path. But despite their differences, both point to the same outcome — my target at 5200. And that’s only the first target out of several.
Make sure to follow and subscribe, so you don’t miss the upcoming updates and deeper breakdowns.
This is just my personal market outlook — not financial advice. More updates coming soon.

SPY - likely lower into next weekCorrection of yesterday's strong down move is likely close to being over here. Gold also looks like it will drop and probably hard. Oil, probably lower. BTC lower.

SPX - Hours Of Work To Buy 1 ShareHours of work needed to buy just one share of the S&P 500 just hit a new all-time high: 187 hours.
That’s:
150% more work than 2007
60% more than pre-COVID (2019)
10% more than “Liberation Day”
As I tell my kids:
Don’t look at the price tag.
Look at how many hours of your life — your blood, sweat, and effort — it takes to buy the thing.
Then decide if it’s actually worth it.
When the amount of work required keeps rising while what you get keeps shrinking, that’s not “innovation” or “AI magic.”
That’s over-speculation.
Buffett said it best:
Price is what you pay. VALUE is what you get.
Everyone screams about the price going up…
but nobody asks whether the VALUE justifies the hours of work required to own it.
That’s the truth — not the narratives.
THANK YOU for getting me to 5,000 followers! 🙏🔥
Let’s keep climbing.
If you enjoy the work:
👉 Boost
👉 Follow
👉 Drop a solid comment
Let’s push it to 6,000 and keep building a community grounded in truth, not hype.

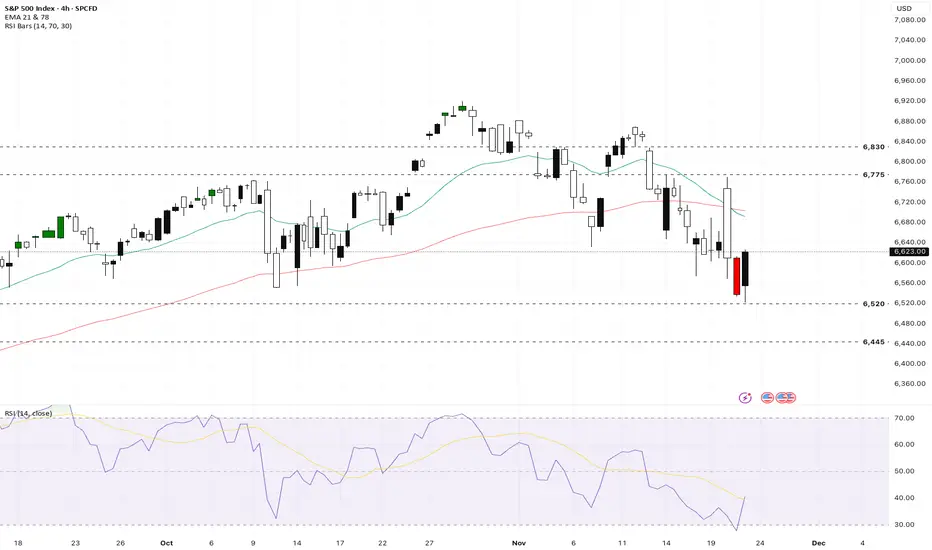
US500 remains under pressure as technology sector momentum coolsThe US500 moved lower after a volatile session marked by fading momentum in technology stocks and renewed macroeconomic uncertainty. Despite short-term weakness, the index remains up almost 10% year-on-year compared to this period in 2024.
Fundamental analysis
The US Federal Reserve policy is now in sharp focus, with remarks from policymakers supporting expectations for a possible interest rate cut in Dec, which is inspiring a slight rebound and giving traders hope for year-end support. Fed New York President Williams said the central bank has room to cut rates again soon as the labor market softens, which improved sentiment. Recent strong US earnings, including from key US 500 members, have offered some relief but have not reversed the current downward trend as AI-driven enthusiasm cools. Renewed fiscal uncertainties, increasing debt issuance, and mixed economic data have weighed on sentiment.
Technical analysis
The index charted a bearish engulfing candlestick below its EMA21, suggesting sellers still control price action in the short term. Key resistance is observed near 6775 and 6830, while immediate support is now at 6520 and a major support at 6445. The volatility index (VIX) jumped by nearly 12% to 26.42, signaling rising market stress and a defensive posture by portfolio managers. In a technical warning that sellers have seized control, charts show Thursday’s losses fully erased the previous session’s advance. The Bearish Engulfing pattern was unusually large and swift and echoed a similar setup in early Mar that preceded a 5% drop in the index. The US500 broke below both its EMA21 and EMA78, levels that many traders view as key lines of support.
Sentiment and outlook
A $5 tln slide in global equities has left investors questioning how much further the tech-led pullback can go. US stock futures swung between gains and losses in volatile trading amid a sustained retreat from the market’s riskier corners. However, seasonality is historically positive heading into Thanksgiving week, and many market participants expect a rebound into year-end, especially with the Fed likely leaning dovish and volatility peaking. Risk appetite remains subdued, but technical and macro catalysts point toward possible stabilization and recovery if central bank signals remain supportive.
Analysis is by Terence Hove, Senior Financial Markets Strategist at Exness
SPY in consolidationNothing to report as yet. Looks like a correction, nothing telling me it's a bottom. We could have some drop and pop type moves, so be careful. Gold looks like it will go higher so far. Oil probably goes lower to test it's lows. BTC hit 82k target but could easily fall to 73k. MJ stocks look interesting around here, so I'm wondering if there will be news to legalize soon.

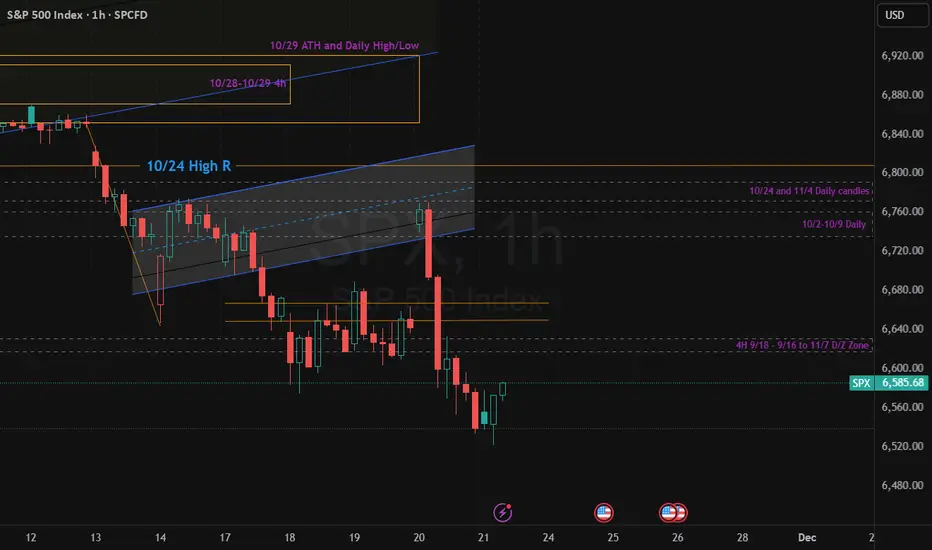
$SP:SPX $SPX 1H update Nov 21Check Bear-flag thesis from Nov 17 played out cleanly. We got the rising parallel channel after the late-Oct dump, then a decisive 1H breakdown + failure retest on Nov 20 — classic continuation, not a fakeout. Since then, structure is still bearish (lower highs/lows), and today’s candles are impulsive enough to treat bounces as corrective until proven otherwise.
Key levels: (For Macro Check daily and weekly charts as well.)
• Overhead 1H supply / retest area sits ~6600–6620 (from the Nov 20 breakdown). Price is NOT there yet — we’re ~654x. If we mean-revert into this zone and stall, it’s a high-quality short-reaction area.
• Near-term resistance ~6640–6670 (prior base). Bulls need a reclaim + hold here to even argue structure shift.
• Current lows ~6540s are extension territory — expect bounce attempts, but one green candle doesn’t equal reversal unless we break/hold a 1H lower high.
Bias: bearish under 6600–6620. Watching for either (a) corrective bounce into supply to sell, or (b) true structure reclaim above 6640–6670 to invalidate. #SPX #SP500 #BearFlag #SupplyDemand SP:SPX SP:SPX
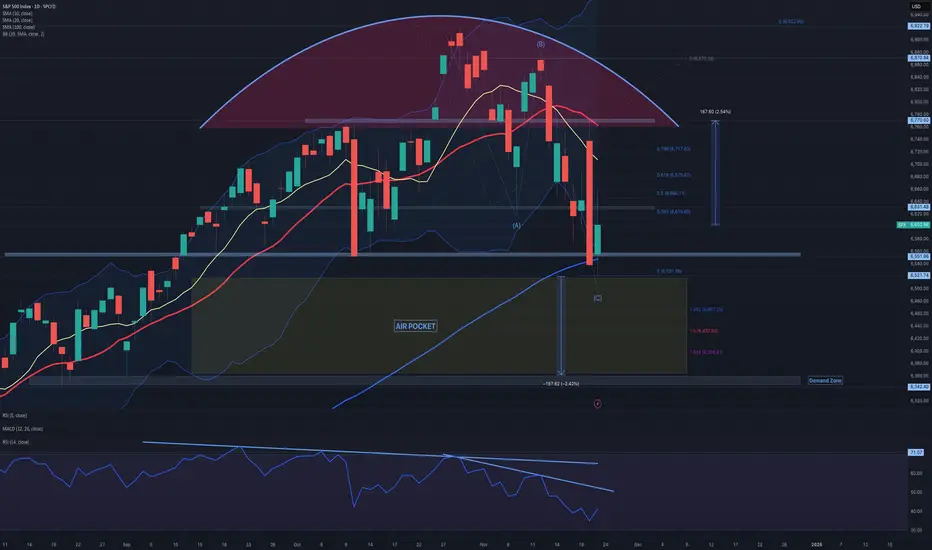
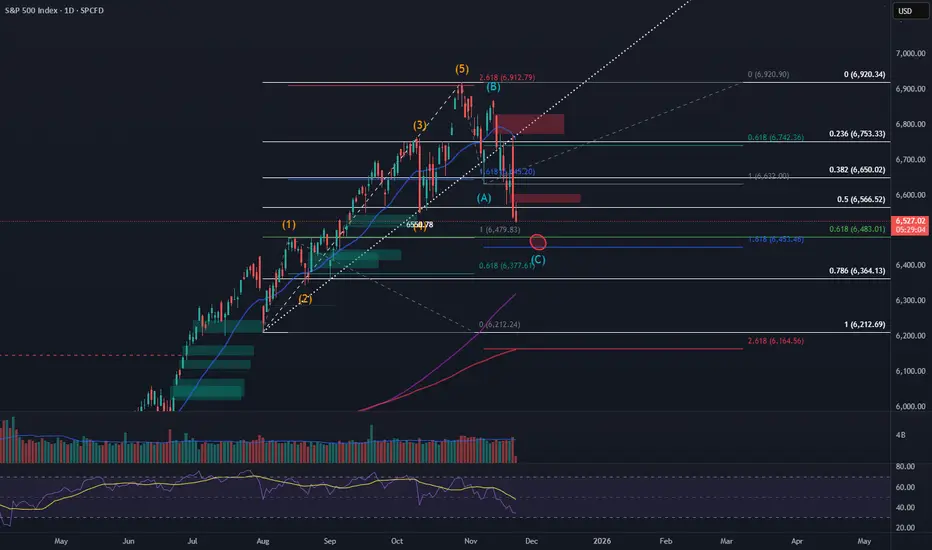
SPX Corrective Wave C Approaching Key Fibonacci ConfluenceThe S&P 500 appears to be completing an A–B–C corrective structure following the recent top. Price is currently breaking below wave (A) and moving toward a strong confluence zone at the 0.618–1.618 Fibonacci levels. This area aligns with prior demand, trendline support, and measured targets, making it a potential reversal zone for wave (C). Watching for bullish reaction or confirmation before considering upside continuation.
S&P 500 Wave Analysis – 21 November 2025
- S&P 500 index reversed from strong support level 6555.00
- Likely to rise to resistance level 6800.00
S&P 500 index recently reversed from support area between the strong support level 6555.00, lower daily Bollinger Band and the 50% Fibonacci correction of the upward impulse from August.
The upward reversal from the support level 6555.00 stopped the previous minor ABC correction 2 from the end of October.
Given the clear daily uptrend, S&P 500 index can be expected to rise to the next resistance level 6800.00 (former top of wave (3) from October).

S&P500 H4 | Bearish Reaction off Key ResistanceMomentum: Bearish
Price is currently below the ichimoku cloud.
Sell entry: 6,706.19
- Strong pullback resistance
- 61.8% Fib retracement
- 100% Fib projection
Stop Loss: 6,790.06
- Swing high resistance
Take Profit: 6,602.91
- Swing low support
High Risk Investment Warning
Stratos Markets Limited (tradu.com/uk ), Stratos Europe Ltd (tradu.com/eu ):
CFDs are complex instruments and come with a high risk of losing money rapidly due to leverage. 70% of retail investor accounts lose money when trading CFDs with this provider. You should consider whether you understand how CFDs work and whether you can afford to take the high risk of losing your money.
Stratos Global LLC (tradu.com/en ): Losses can exceed deposits.
Please be advised that the information presented on TradingView is provided to Tradu (‘Company’, ‘we’) by a third-party provider (‘TFA Global Pte Ltd’). Please be reminded that you are solely responsible for the trading decisions on your account. Any information and/or content is intended entirely for research, educational and informational purposes only and does not constitute investment or consultation advice or investment strategy. The information is not tailored to the investment needs of any specific person and therefore does not involve a consideration of any of the investment objectives, financial situation or needs of any viewer that may receive it. Past performance is not a reliable indicator of future results. Actual results may differ materially from those anticipated in forward-looking or past performance statements. We assume no liability as to the accuracy or completeness of any of the information and/or content provided herein and the Company cannot be held responsible for any omission, mistake nor for any loss or damage including without limitation to any loss of profit which may arise from reliance on any information supplied by TFA Global Pte Ltd.

SPX500 – Key Levels After 3.5% Drop | Bearish Below 6578SPX500 | OVERVIEW
U.S. index futures declined as Nasdaq and S&P500 faced renewed selling pressure, with tech names — including Nvidia — continuing to weaken after Thursday’s sharp drop.
Concerns over stretched valuations remain a key driver of the pullback.
SPX500 – Market Outlook | Bearish Below 6578
SPX500 and Nasdaq futures fell again as tech stocks remain under pressure following Thursday’s selloff. Market sentiment continues to weaken due to concerns over stretched valuations.
Below 6578: Bearish continuation toward 6510 → 6425
Above 6578 (1H close): Short-term correction toward 6610 → 6635
Pivot: 6578
Support: 6510 · 6425
Resistance: 6610 · 6635
SPX500 stays bearish as long as price remains below the pivot. A break above 6578 would only allow a short correction, not a trend reversal.
previous idea:

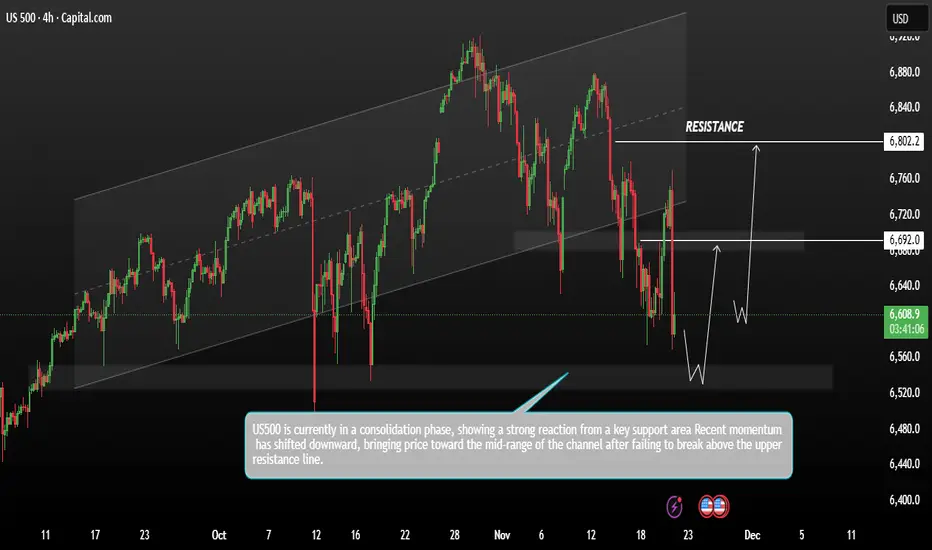
US500 Price Showing Bullish forming a reversal patternUS500 price action moving within a broad ascending channel, with multiple touches on both the upper and lower trend boundaries. Recent momentum has shifted downward, bringing price toward the mid-range of the channel after failing to break above the upper resistance line.
A key support zone sits around 6,550–6,500, highlighted by a shaded region where previous buyers stepped in. The projection on the chart suggests a potential dip into this support area, forming a reversal pattern before pushing higher.
If a bullish rebound occurs from this support, the next critical level is the mid-range supply zone around 6,690 / 6,720. A successful breakout above this zone could open the path toward the major resistance area near 6,802, which is clearly marked as the upper target.
You may find more details in the chart.
Trade wisely best of luck buddies,
Ps; Support with like and comments for better analysis Thanks for Supporting.