S&P 500 — Technical QE vs. Classic QEThe US Federal Reserve (FED) unveiled yesterday its final monetary policy decision of the year with an interest rate cut on the federal funds rate to 3.75%. Jerome Powell held a press conference and the FED updated its macroeconomic projections for 2026.
There is now a complete balance between the unemployment-rate objective and the inflation objective. Let us also keep in mind that the Quantitative Tightening (QT) program has been halted since Monday, December 1st, and that the FED stands ready to use the balance-sheet monetary tool to reduce any emerging tension in the interbank and money markets and to ensure that bond yields do not exert pressure on the State and on companies.
While the S&P 500 index is evolving at record levels and one must justify a valuation level at a historic high, would a “technical QE” from the FED during 2026 be sufficient to contain long-term interest rates and support the equity market?
It is essential to understand that a “technical QE” is not a classic Quantitative Easing (QE) program and that its impact on long-term interest rates remains limited. In that sense, a technical QE does provide short-term liquidity, but it does not constitute a structural liquidity support.
Concretely, a technical QE mainly aims at stabilizing the functioning of the money market: repo operations, temporary balance-sheet adjustments, targeted interventions in case of stress. This prevents short-term rates from suddenly spiking, but it does not mean that the FED is entering a large-scale easing cycle. Investors should therefore avoid overinterpreting the term “QE.” Here, the objective is operational, not macroeconomic.
Where a classic QE compresses the entire yield curve, stimulates credit and fuels a genuine cycle of risk appetite, a technical QE acts more like a “shock absorber” than an engine. It prevents a liquidity crisis, but it does not create a new structural momentum. For an equity market already at historical highs, the nuance is essential.
Should it be minimized for all that? Not really. In an environment where valuations are very high in the US market and where the slightest stress on rates can trigger sharp profit-taking, the simple ability of the FED to intervene surgically to calm markets can be enough to maintain a climate of confidence. A technical QE is not fuel for a new bullish leg, but it can prevent turbulences that could weaken US indices.
In summary, while a classic QE creates an expansionary environment, a technical QE mostly creates a stable one. And for an S&P 500 sitting at record highs, stability may already represent a meaningful form of support.
DISCLAIMER:
This content is intended for individuals who are familiar with financial markets and instruments and is for information purposes only. The presented idea (including market commentary, market data and observations) is not a work product of any research department of Swissquote or its affiliates. This material is intended to highlight market action and does not constitute investment, legal or tax advice. If you are a retail investor or lack experience in trading complex financial products, it is advisable to seek professional advice from licensed advisor before making any financial decisions.
This content is not intended to manipulate the market or encourage any specific financial behavior.
Swissquote makes no representation or warranty as to the quality, completeness, accuracy, comprehensiveness or non-infringement of such content. The views expressed are those of the consultant and are provided for educational purposes only. Any information provided relating to a product or market should not be construed as recommending an investment strategy or transaction. Past performance is not a guarantee of future results.
Swissquote and its employees and representatives shall in no event be held liable for any damages or losses arising directly or indirectly from decisions made on the basis of this content.
The use of any third-party brands or trademarks is for information only and does not imply endorsement by Swissquote, or that the trademark owner has authorised Swissquote to promote its products or services.
Swissquote is the marketing brand for the activities of Swissquote Bank Ltd (Switzerland) regulated by FINMA, Swissquote Capital Markets Limited regulated by CySEC (Cyprus), Swissquote Bank Europe SA (Luxembourg) regulated by the CSSF, Swissquote Ltd (UK) regulated by the FCA, Swissquote Financial Services (Malta) Ltd regulated by the Malta Financial Services Authority, Swissquote MEA Ltd. (UAE) regulated by the Dubai Financial Services Authority, Swissquote Pte Ltd (Singapore) regulated by the Monetary Authority of Singapore, Swissquote Asia Limited (Hong Kong) licensed by the Hong Kong Securities and Futures Commission (SFC) and Swissquote South Africa (Pty) Ltd supervised by the FSCA.
Products and services of Swissquote are only intended for those permitted to receive them under local law.
All investments carry a degree of risk. The risk of loss in trading or holding financial instruments can be substantial. The value of financial instruments, including but not limited to stocks, bonds, cryptocurrencies, and other assets, can fluctuate both upwards and downwards. There is a significant risk of financial loss when buying, selling, holding, staking, or investing in these instruments. SQBE makes no recommendations regarding any specific investment, transaction, or the use of any particular investment strategy.
CFDs are complex instruments and come with a high risk of losing money rapidly due to leverage. The vast majority of retail client accounts suffer capital losses when trading in CFDs. You should consider whether you understand how CFDs work and whether you can afford to take the high risk of losing your money.
Digital Assets are unregulated in most countries and consumer protection rules may not apply. As highly volatile speculative investments, Digital Assets are not suitable for investors without a high-risk tolerance. Make sure you understand each Digital Asset before you trade.
Cryptocurrencies are not considered legal tender in some jurisdictions and are subject to regulatory uncertainties.
The use of Internet-based systems can involve high risks, including, but not limited to, fraud, cyber-attacks, network and communication failures, as well as identity theft and phishing attacks related to crypto-assets.
Market insights


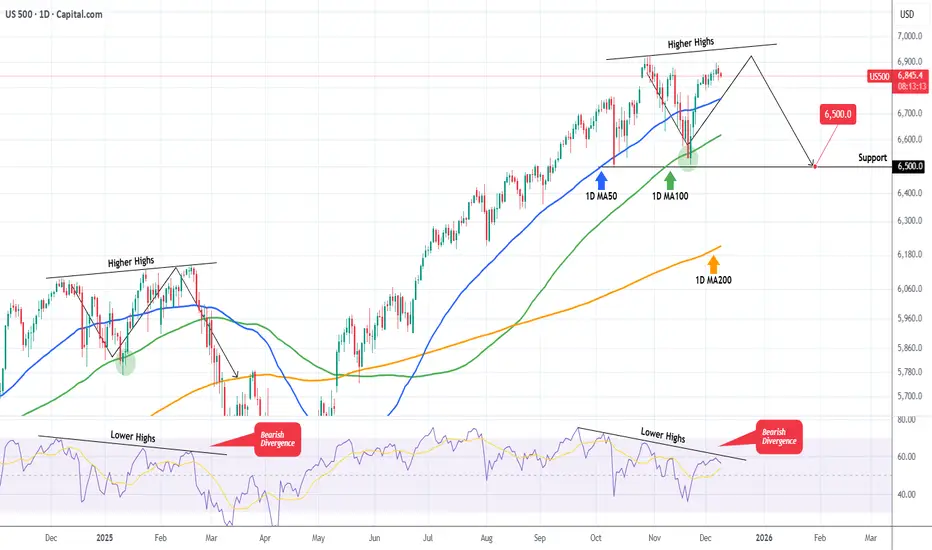
S&P500 The Bearish Divergence that may spoil the party.S&P500 (SPX) is extending a strong rally following the rebound on its 1D MA100 (green trend-line) almost 3 weeks ago. As we pointed out in a previous analysis, the price action of the past 2 months has been identical to the pattern after November 19 2024.
We are currently on the same 1D MA100 rebound towards the Higher Highs trend-line but the key development is that the 1D RSI on both fractals shows a huge Bearish Divergence, being on Lower Highs.
In February 2025 that led to the start of a strong correction in the stock markets. So as long as the 1D RSI Bearish Divergence holds, the S&P500 currently risks a technical correction towards at least the first Support level of 6500.
---
** Please LIKE 👍, FOLLOW ✅, SHARE 🙌 and COMMENT ✍ if you enjoy this idea! Also share your ideas and charts in the comments section below! This is best way to keep it relevant, support us, keep the content here free and allow the idea to reach as many people as possible. **
---
💸💸💸💸💸💸
👇 👇 👇 👇 👇 👇
$SPX Cautiously BullishI have been calling for a long for SP:SPX since Black Friday at 5570 (), then at 5700 () and at 5810 () for ATH. We missed ATH by a few points before a strong sell down on Friday.
Very bearish down move on Friday I would say, but price bounced off my algo level bias zone at 5800 for SPX (also for NDX). Price is now at my algo support zone. Cautiously bullish for a reversal and a move higher.

S&P 500 Daily Chart Analysis For Week of Dec 12, 2025Technical Analysis and Outlook:
In the course of the recent weekly trading session, the S&P 500 Index exhibited significant gyrational volatility, reaching a Key Resistance level at 6,895 before retracting to the Major Mean Support level delineated at 6,816.
At present, this market positioning indicates strong potential for continued downward movement, with the primary objective focused on targeting the Mean Support level at 6,755 via heavily traded Mean Support at 6,816.
Nevertheless, it is crucial to recognize that, given current market dynamics, there is a substantial probability of a robust price surge to retest the critical Key Resistance at 6,900, which may be accompanied by a strong rebound to the Outer Index Rally target at 6,945.

SP500 Price consolidating in a bullish structureSP500 is currently consolidating in a bullish structure after successfully holding key support. This stabilization suggests that price may be preparing for another move to the upside.
Technically Wall Street’s main index is expected to remain relatively steady ahead of the closely watched Federal Reserve decision. The Fed is widely expected to deliver a rate cut, although uncertainty remains regarding the extent and pace of potential rate reductions going into 2026.
During the announcement, price may experience temporary volatility—especially upward spikes driven by liquidity grabs. However, the sustained direction will depend entirely on Powell’s tone and forward guidance.
If the market maintains its bullish structure following the Fed release, we could see the SP500 extend higher toward new highs in the 6,924.50 – 7,000.35 zone.
You may find more details in the chart,
Trade wisely best of luck buddies.
Ps; Support with like and comments for better analysis thanks for supporting.

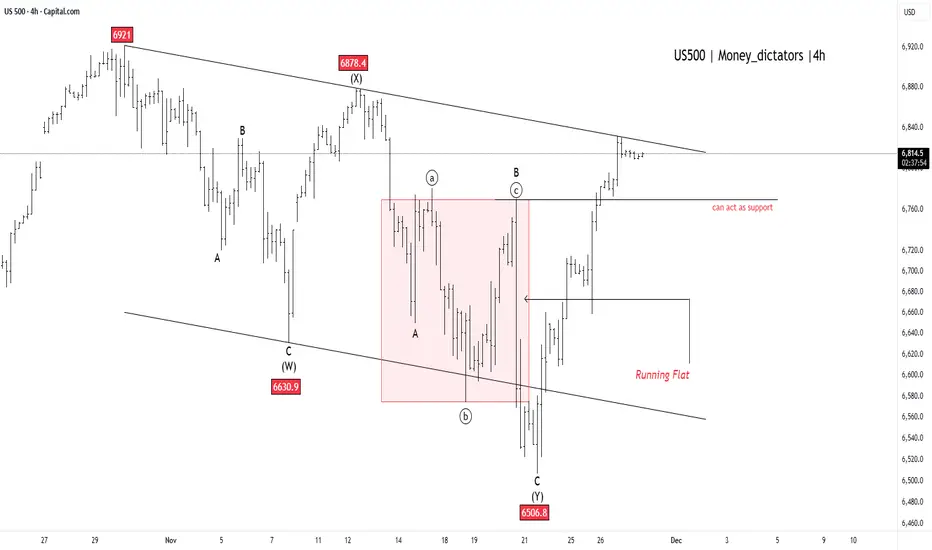
SP500: Ready to Break Out and Forge New All-Time Highs S&P 500 indicates that the recent complex downward correction is complete, having bottomed at 6501.7.
The market is currently rallying and is testing the major upper trendline resistance. The analysis projects a minor, temporary pullback to gather momentum, potentially to the 6775.0 area. Following this consolidation, a decisive breakout above the trendline is anticipated. This will confirm the launch of a major new upward wave, expected to drive the S&P 500 to new all-time highs above 6928.
Stay Tuned :)
@Money_Dictators

The Wall of Worry That Climbed 70% This chart should be framed and hung in every investor’s office.
From 2021 → late 2025 the S&P 500 went from ~4,000 → 6,886 (+70%+), while the entire way up we were bombarded with:
“SELL” – Michael Burry
“Worst crash since 1929” – John Hussman
“86% drop coming” – Harry Dent
“Biggest crash in history has started” – Robert Kiyosaki
“Third most expensive market ever, recession imminent” – David Rosenberg
…and literally dozens more “100% certain” doomsday calls
Every single red bubble on this chart = a famous expert screaming that the sky was falling.
And every time the market just… kept climbing.
Here's what's important to understand: "experts" produce lots of noise.
Waiting on the sidelines for the “all-clear” from the gurus is the riskiest move of all.
The opportunity cost is brutal.
Missing the best days (which usually come right after the scariest headlines) destroys returns more than any crash ever could.
Stay invested is much better than trying to time the experts.
Time in the market still beats timing the market.
You better save this chart the next time someone sends you another “crash is coming” article!

Support under 6800 likely holdsI don't think the market is acting bearish enough for a further move down under 6750 right now. We are most likely in a trading range for a while. Oil testing it's lows. BTC looks bearish. Gold looks bullish.

SPX500 H4 | Bullish Bounce Off Pullback SupportMomentum: Bullish
Price is currently above the ichimoku cloud.
Buy entry: 6,773.15
- Pullback support
- 38.2% Fib retracement
- 127.2% Fib extension
Stop Loss: 6,714.17
- Pullback support
Take Profit: 6,832.14
- Pullback resistance
High Risk Investment Warning
Stratos Markets Limited (tradu.com/uk ), Stratos Europe Ltd (tradu.com/eu ):
CFDs are complex instruments and come with a high risk of losing money rapidly due to leverage. 70% of retail investor accounts lose money when trading CFDs with this provider. You should consider whether you understand how CFDs work and whether you can afford to take the high risk of losing your money.
Stratos Global LLC (tradu.com/en ): Losses can exceed deposits.
Please be advised that the information presented on TradingView is provided to Tradu (‘Company’, ‘we’) by a third-party provider (‘TFA Global Pte Ltd’). Please be reminded that you are solely responsible for the trading decisions on your account. Any information and/or content is intended entirely for research, educational and informational purposes only and does not constitute investment or consultation advice or investment strategy. The information is not tailored to the investment needs of any specific person and therefore does not involve a consideration of any of the investment objectives, financial situation or needs of any viewer that may receive it. Past performance is not a reliable indicator of future results. Actual results may differ materially from those anticipated in forward-looking or past performance statements. We assume no liability as to the accuracy or completeness of any of the information and/or content provided herein and the Company cannot be held responsible for any omission, mistake nor for any loss or damage including without limitation to any loss of profit which may arise from reliance on any information supplied by TFA Global Pte Ltd.

SPX500 | Bulls Target 6957 as Breadth Improves Beyond AISPX500 – Technical Overview
The S&P 500 has reached a new record high, notably without support from AI-related stocks.
Despite underwhelming earnings from Oracle and Broadcom, the broader market continued to rally—an encouraging sign that sector leadership may be broadening rather than relying solely on AI momentum.
Technical Analysis
SPX500 maintains a bullish momentum while trading above 6873–6888, with upside targets at:
→ 6918
→ 6957
→ 6991
A continuation toward 6957 is favored as long as price holds above 6888.
However, a 1H close below 6873 will signal a bearish correction, opening the path toward:
→ 6852
→ 6815
Further downside pressure may extend the move into the 6771 support zone if risk sentiment weakens.
Pivot Line: 6888
Resistance: 6918 · 6957 · 6991
Support: 6852 · 6815 · 6771

US500 - Breakout to New All-Time Highs!US500 suggests the market has put a definitive end to its recent downward movement, signaling that a major bullish trend is set to continue. This complex correction, which the chart labels as complete at the 6506.8 low, looks resolved. The index has since staged a powerful rebound and is currently pressing right up against the major upper trendline resistance, which defined the limits of the entire corrective phase.
A clear and sustained move above this key trendline will provide final confirmation that the correction is over and that a significant new upward wave has begun. The previous area of congestion around 6760 is now expected to act as strong support for the index, preventing any minor pullbacks from turning into a deeper decline. With the current price around 6,812.61 and the all-time high at 6,920.34 , the index is technically well-positioned to challenge and surpass this record high soon.
SPX500 H4 | Bullish ContinuationMomentum: Bullish
Price has bounced off the buy entry, acting as pullback support, and is currently trading above the Ichimoku cloud.
Buy Entry: 6,872.80
Pullback support
Stop Loss: 6,806.30
Pullback support
Take Profit: 6,922.49
Swing-high resistance
High Risk Investment Warning
Stratos Markets Limited (tradu.com ), Stratos Europe Ltd (tradu.com ):
CFDs are complex instruments and come with a high risk of losing money rapidly due to leverage. 70% of retail investor accounts lose money when trading CFDs with this provider. You should consider whether you understand how CFDs work and whether you can afford to take the high risk of losing your money.
Stratos Global LLC (tradu.com ): Losses can exceed deposits.
Please be advised that the information presented on TradingView is provided to Tradu (‘Company’, ‘we’) by a third-party provider (‘TFA Global Pte Ltd’). Please be reminded that you are solely responsible for the trading decisions on your account. Any information and/or content is intended entirely for research, educational and informational purposes only and does not constitute investment or consultation advice or investment strategy. The information is not tailored to the investment needs of any specific person and therefore does not involve a consideration of any of the investment objectives, financial situation or needs of any viewer that may receive it. Past performance is not a reliable indicator of future results. Actual results may differ materially from those anticipated in forward-looking or past performance statements. We assume no liability as to the accuracy or completeness of any of the information and/or content provided herein and the Company cannot be held responsible for any omission, mistake nor for any loss or damage including without limitation to any loss of profit which may arise from reliance on any information supplied by TFA Global Pte Ltd.

S&P500 Key Trading Levels
Key Support and Resistance Levels
Resistance Level 1: 6898
Resistance Level 2: 6922
Resistance Level 3: 6958
Support Level 1: 6809
Support Level 2: 6790
Support Level 3: 6768
This communication is for informational purposes only and should not be viewed as any form of recommendation as to a particular course of action or as investment advice. It is not intended as an offer or solicitation for the purchase or sale of any financial instrument or as an official confirmation of any transaction. Opinions, estimates and assumptions expressed herein are made as of the date of this communication and are subject to change without notice. This communication has been prepared based upon information, including market prices, data and other information, believed to be reliable; however, Trade Nation does not warrant its completeness or accuracy. All market prices and market data contained in or attached to this communication are indicative and subject to change without notice.


S&P500 idea of how the market might move the coming months.After creating a double top, I expected a head & shoulder pattern to form but we got a double top instead and due to macro situations and debt problems world wide after pumping so hard I expect huge corrections in the markets.
Most likely a everything bubble that will burst due to high leverage trades over many years.
We will also see a huge bank crisis start when all this unfolds.
Better buckle up!

SPX Is going up...time to buySPX 500 is in a clear upwards channel and has broken the last bit of resistance (white trendline line shown) - this is a clear confirmation that the next target will be the next resistance zone to the upside shown above (this is a great buy trade opportunity) - buy the SPX 500 now

S & P 500 occupies a bearish pattern!Price swept lower in the Asia Thursday session, buy orders that did not trigger are waiting for price to retest and trigger their orders to buy in.
It’s a Double Top on high time frames and a triple top intraday.
About a week ago a CHoCH bullish occurs and price has since gone to new highs.
Watch for continued strength in EURUSD after it made a corrective move down yesterday .

SPX500 | Markets Brace for Powell as Breakout Levels TightenSPX500 – Technical Overview
Markets are entering high-alert mode as traders brace for the most divided
Federal Reserve meeting in years. Futures, bonds, and FX markets are tightening positioning ahead of the announcement, while earnings from NYSE:ORCL and NASDAQ:AVGO Broadcom
will test whether AI valuations can continue to stretch higher.
The futures market is pricing an 89% probability of a quarter-point rate cut to the 3.50–3.75% range, but also expects hawkish guidance, with only a 21% chance of a January cut.
The outcome will heavily depend on the updated dot plot and the communication strategy of
Jerome Powell, especially as uncertainty grows around who will lead the Fed in 2026.
Geopolitical risk is also rising: U.S. sanctions against Russian oil majors RUS:LKOH and RUS:ROSN may reshape the global oil market and energy flows over the coming year.
Technical Analysis
SPX500 is experiencing a bearish push ahead of the Fed decision, targeting 6815 as long as the price remains below 6852.
During the Fed announcement, prices may temporarily spike upward due to volatility and liquidity hunting, but the actual direction will depend entirely on Powell’s tone and guidance.
A shift to bullish momentum requires stability and a confirmed close above 6852, which would open the path toward a new all-time high around 6918.
Pivot Line: 6852
Support: 6815 · 6771
Resistance: 6888 · 6918


ABC or C?We reached the 18ma. I'm not sure if we just corrected the large upmove or if we will continue to drop. It looks a lot like a smaller ABC as of now. The 18ma and horizontal line at 6780 area are both strong support. The VIX is at resistance here, but a break above 18 and especially 20 would be significant. I talk about a few trades as well.

Trading Seasonality: When the Calendar Matters More Than NewsTrading Seasonality: When the Calendar Matters More Than News
Markets move not just on news and macroeconomics. There are patterns that repeat year after year at the same time. Traders call this seasonality, and ignoring it is like trading blindfolded.
Seasonality works across all markets. Stocks, commodities, currencies, and even cryptocurrencies. The reasons vary: tax cycles, weather conditions, financial reporting, mass psychology. But the result is the same — predictable price movements in specific months.
January Effect: New Year, New Money
January often brings growth to stock markets. Especially for small-cap stocks.
The mechanics are simple. In December, investors lock in losses for tax optimization. They sell losing positions to write off losses. Selling pressure pushes prices down. In January, these same stocks get bought back. Money returns to the market, prices rise.
Statistics confirm the pattern. Since the 1950s, January shows positive returns more often than other months. The Russell 2000 index outperforms the S&P 500 by an average of 0.8% in January. Not a huge difference, but consistent.
There's a catch. The January effect is weakening. Too many people know about it. The market prices in the pattern early, spreading the movement across December and January. But it doesn't disappear completely.
Sell in May and Go Away
An old market saying. Sell in May, come back in September. Or October, depending on the version.
Summer months are traditionally weaker for stocks. From May to October, the average return of the US market is around 2%. From November to April — over 7%. Nearly four times higher.
There are several reasons. Trading volumes drop in summer. Traders take vacations, institutional investors reduce activity. Low liquidity amplifies volatility. The market gets nervous.
Plus psychology. Summer brings a relaxed mood. Less attention to portfolios, fewer purchases. Autumn brings business activity. Companies publish reports, investors return, money flows back.
The pattern doesn't work every year. There are exceptions. But over the past 70 years, the statistics are stubborn — winter months are more profitable than summer.
Santa Claus Rally
The last week of December often pleases the bulls. Prices rise without obvious reasons.
The effect is called the Santa Claus Rally. The US market shows growth during these days in 79% of cases since 1950. The average gain is small, about 1.3%, but stable.
There are many explanations. Pre-holiday optimism, low trading volumes, purchases from year-end bonuses. Institutional investors go on vacation, retail traders take the initiative. The mood is festive, no one wants to sell.
There's interesting statistics. If there's no Santa Claus rally, the next year often starts poorly. Traders perceive the absence of growth as a warning signal.
Commodities and Weather
Here seasonality works harder. Nature dictates the rules.
Grain crops depend on planting and harvest. Corn prices usually rise in spring, before planting. Uncertainty is high — what will the weather be like, how much will be planted. In summer, volatility peaks, any drought or flood moves prices. In autumn, after harvest, supply increases, prices fall.
Natural gas follows the temperature cycle. In winter, heating demand drives prices up. In summer, demand falls, gas storage fills, prices decline. August-September often give a local minimum. October-November — growth before the heating season.
Oil is more complex. But patterns exist here too. In summer, gasoline demand rises during vacation season and road trips. Oil prices usually strengthen in the second quarter. In autumn, after the summer peak, correction often follows.
Currency Market and Quarter-End
Forex is less seasonal than commodities or stocks. But patterns exist.
Quarter-end brings volatility. Companies repatriate profits, hedge funds close positions for reporting. Currency conversion volumes surge. The dollar often strengthens in the last days of March, June, September, and December.
January is interesting for the yen. Japanese companies start their new fiscal year, repatriate profits. Demand for yen grows, USD/JPY often declines.
Australian and New Zealand dollars are tied to commodities. Their seasonality mirrors commodity market patterns.
Cryptocurrencies: New Market, Old Patterns
The crypto market is young, but seasonality is already emerging.
November and December are often bullish for Bitcoin. Since 2013, these months show growth in 73% of cases. Average return is about 40% over two months.
September is traditionally weak. Over the past 10 years, Bitcoin fell in September 8 times. Average loss is about 6%.
Explanations vary. Tax cycles, quarterly closings of institutional funds, psychological anchors. The market is young, patterns may change. But statistics work for now.
Why Seasonality Works
Three main reasons.
First — institutional cycles. Reporting, taxes, bonuses, portfolio rebalancing. Everything is tied to the calendar. When billions move on schedule, prices follow the money.
Second — psychology. People think in cycles. New year, new goals. Summer, time to rest. Winter, time to take stock. These patterns influence trading decisions.
Third — self-fulfilling prophecy. When enough traders believe in seasonality, it starts working on its own. Everyone buys in December expecting a rally — the rally happens.
How to Use Seasonality
Seasonality is not a strategy, it's a filter.
You don't need to buy stocks just because January arrives. But if you have a long position, seasonal tailwind adds confidence. If you plan to open a short in December, seasonal statistics are against you — worth waiting or looking for another idea.
Seasonality works better on broad indices. ETFs on the S&P 500 or Russell 2000 follow patterns more reliably than individual stocks. A single company can shoot up or crash in any month. An index is more predictable.
Combine with technical analysis. If January is historically bullish but the chart shows a breakdown — trust the chart. Seasonality gives probability, not guarantee.
Account for changes. Patterns weaken when everyone knows about them. The January effect today isn't as bright as 30 years ago. Markets adapt, arbitrage narrows.
Seasonality Traps
The main mistake is relying only on the calendar.
2020 broke all seasonal patterns. The pandemic turned markets upside down, past statistics didn't work. Extreme events are stronger than seasonality.
Don't average. "On average, January grows by 2%" sounds good. But if 6 out of 10 years saw 8% growth and 4 years saw 10% decline, the average is useless. Look at median and frequency, not just average.
Commissions eat up the advantage. If a seasonal effect gives 1-2% profit and you pay 0.5% for entry and exit, little remains. Seasonal strategies work better for long-term investors.
Tools for Work
Historical data is the foundation. Without it, seasonality is just rumors.
Backtests show whether a pattern worked in the past. But past doesn't guarantee future. Markets change, structure changes.
Economic event calendars help understand the causes of seasonality. When quarterly reports are published, when dividends are paid, when tax periods close.
Many traders use indicators to track seasonal patterns or simply find it convenient to have historical data visualization right on the chart.

US500 Price Map. Will Buyers Defend Key Layers Toward 7000?📊 US500/SPX500 Bullish Swing Trade Strategy | Professional Analysis 🚀
Current Price: $6,870.40 | Status: Bullish Momentum Building 🔥
🎯 TRADE OVERVIEW
Asset: US500 / SPX500 Index
Timeframe: DAY/SWING TRADE (Perfect for Active Traders)
Market Condition: BULLISH 📈
Risk Level: Calculated & Managed ✅
💡 WHY THIS SETUP WORKS
The SPX500 is trading near 52-week highs ($6,920.34), with technical indicators showing Strong Buy signals on daily timeframes. Market sentiment remains constructive with potential for mean reversion plays and breakout opportunities. The index has strong institutional support and is consolidating before the next leg up.
🎲 ENTRY STRATEGY: LAYERED APPROACH (THIEF STRATEGY)
Best Practice Approach: Use MULTIPLE LIMIT ORDERS at different price levels for optimal risk management.
Entry Layers - Place These Simultaneously:
Layer 1 - 6,800 (Low Risk Entry)
This is your first position entry at the strong support zone. This layer captures traders looking for early bounces and reduces your average entry cost significantly. Perfect for conservative traders who want maximum confirmation before committing capital.
Layer 2 - 6,825 (Medium Risk Entry)
This second layer adds confirmation as price moves higher. This is where momentum traders jump in. By staggering entries here, you're catching the middle ground between aggressive and conservative positions, giving you excellent risk-reward setup.
Layer 3 - 6,850 (Aggressive Breakout Entry)
This final layer targets breakout traders who wait for price confirmation. Use this only if you have capital left and see strong volume confirmation. This is your most aggressive entry but has the strongest conviction signal.
✅ Pro Tip: You can add MORE layers based on your risk tolerance & account size. Start small, build positions gradually. Never go all-in on one layer!
Why Layering Works 🎯
Layering is the professional way to build positions because it reduces average entry cost, protects against sudden whipsaws, captures multiple entry opportunities, and significantly increases your overall success probability. Instead of being wrong on one entry, you have three chances to be right!
🛑 STOP LOSS (SL): THIEF OG PROTECTION
SL Level: 6,750
Risk Zone: Below support level
This stop loss level protects you from breaking below a critical support zone. If price closes below 6,750, the bullish thesis is broken and you should exit to preserve capital.
📌 IMPORTANT DISCLAIMER:
⚠️ You are NOT required to use our suggested SL
⚠️ Adjust based on YOUR strategy & risk management rules
⚠️ YOUR MONEY = YOUR RULES | Trade with capital you can afford to lose
SL Management Tips:
Place your stop loss below key support levels that make sense with your trading strategy. Once you're in profit (usually +2% on SPX), consider moving your stop to breakeven so you're trading with house money. After solid confirmation and +3-5% profit, use trailing stops to let winners run. Most importantly, never risk more than 2-3% of your total account on a single trade.
🎁 PROFIT TARGET (TP): RESISTANCE CONFLUENCE
Primary Target: 7,000
Reasoning: Strong Resistance + Overbought Zone + Technical Trap Pattern
The 7,000 level represents a major psychological resistance and technical confluence where multiple indicators suggest profit-taking is likely. This is where smart money typically exits positions. The confluence of strong resistance levels, overbought RSI readings, and technical trap pattern all converge at this critical level, making it the ideal exit point for capturing the full move while protecting profits.
📌 CRITICAL NOTICE:
⚠️ Use YOUR OWN profit targets based on risk/reward ratio
⚠️ This is a SUGGESTED level only
⚠️ Protect Your Profits: Lock in gains before pullbacks
Exit Strategy:
Watch for volume divergence signals where price moves higher but volume decreases - this is a classic warning sign. Monitor RSI levels above 70, which indicate overbought conditions and potential reversals. Track support and resistance breaks throughout the move. Most importantly, don't be greedy. If you've hit your profit target, take it and move on. The best traders know when to say "I'm done for the day."
📍 RELATED PAIRS TO MONITOR (CORRELATION ANALYSIS)
Strong Positive Correlation 🔗
NASDAQ-100 (NQ100/COMP) - Correlation: +0.92
This is your tech-heavy index and moves almost in lockstep with US500. Why watch this? Because tech drives the market. If NASDAQ is weak while SPX is strong, watch out for sector rotation. The NASDAQ-100 currently sits at 25,692. If SPX breaks 7,000, expect NASDAQ targets of 26,500+ based on historical correlation patterns. This pair move confirms the strength of the rally.
DJIA (US30/Dow Jones) - Correlation: +0.89
The Dow Jones is your large-cap indicator. These are the blue-chip stocks. At 47,955, the Dow tends to lag SPX on rallies but confirms the trend strength. If Dow is not participating in SPX strength, it signals rotation OUT of mega-caps into mid-caps. Watch for this divergence as a warning signal.
Russell 2000 (RUT) - Correlation: +0.78
Small-cap participation is crucial. A weak Russell 2000 during SPX strength means only mega-caps are rallying. This is a RED FLAG for sustainability. If Russell is strong with SPX, the rally is broad-based and likely to continue. If Russell is weak, we're in a narrow rally that can reverse quickly.
Inverse Correlation (Risk Hedge) 🛡️
VIX (Volatility Index) - Correlation: -0.85
Currently at 15.41, this low volatility reading screams "risk-on" environment. Traders are comfortable, fear is low. But remember, VIX can spike suddenly. If VIX jumps above 20, consider taking profits and reducing exposure. A VIX spike signals institutional selling and risk-off sentiment.
US DOLLAR (DXY) - Correlation: -0.72
Trading at 98.97, a weak dollar SUPPORTS equities because US companies make more money when the dollar is weak (exports become cheaper). If the dollar strengthens suddenly, expect SPX pressure. Monitor Fed policy announcements that impact currency valuations - they directly impact your equity trades!
Sector Rotations to Track 💼
Tech Giants Matter:
NVIDIA (NVDA) at $182.41 is down -0.53% but still critical. This is THE stock to watch. If NVDA collapses, the entire rally is in question. NVIDIA is your AI barometer.
Meta Platforms (META) at $673.42 is up +1.80% and showing strength. This mega-cap strength confirms institutional confidence in the rally. When META leads, the market is feeling risk-on.
Microsoft (MSFT) at $483.16 is stable at +0.48%. This is your stability indicator. If MSFT can't go higher with SPX, it's a divergence warning.
Apple (AAPL) should be monitored for consumer health signals. Any weakness in AAPL suggests consumer spending concerns ahead.
🔍 TECHNICAL CONFIRMATION CHECKLIST
✅ Daily Chart: STRONG BUY - Moving Averages perfectly aligned in uptrend
✅ Weekly Chart: STRONG BUY - Macro uptrend completely intact, higher lows confirmed
✅ RSI: Not Yet Overbought - Means room to run before pullback expected
✅ MACD: Bullish Crossover Confirmed - Momentum indicator flashing green light
✅ Volume Profile: Good Distribution - Buying happening at higher price levels, not just sharp spikes
✅ Sentiment: Institutional Buying - Big money is flowing into SPX, not retail FOMO
This checklist confirms the setup is solid for the bullish premise. All signals are aligned, which means the probability is in your favor.
⚡ TRADER RULES & DISCLAIMERS
🎯 Golden Rules for This Trade:
Rule 1 - Only Risk What You Can Afford to Lose 💰
Don't use your rent money. Don't risk your emergency fund. Only trade capital that won't hurt your life if you lose it. This removes emotion from decision-making.
Rule 2 - Respect Your Stop Loss
No exceptions. Ever. A stop loss is not a suggestion - it's your insurance policy. Hit it and move on without hesitation. The traders who don't respect stops are the traders who blow up their accounts.
Rule 3 - Scale In and Out
Don't FOMO all-in on one entry. Build positions gradually with the three layers. Exit gradually with the three targets. This removes emotion and improves results dramatically.
Rule 4 - Lock Profits Before Pullbacks
Let winners run but protect gains. Your first 30% profit at 6,900 is EARNED. Take it. You only regret profits you didn't take.
Rule 5 - Track Correlations
Watch related pairs for divergence. If SPX goes up but NASDAQ goes down, something is wrong. Exit first, ask questions later.
Rule 6 - Use Alerts - Don't Stare at Screens 24/7
Set price alerts on TradingView. Let technology do the work. You have a life outside trading. Check alerts a few times per day.
Important Notices ⚠️
📋 This is TECHNICAL ANALYSIS ONLY - Not financial advice
🔒 NOT a recommendation to buy or sell
💡 Use this framework with YOUR OWN analysis - Don't blindly follow
🎓 Paper trade first if you're testing this strategy - Practice before risking real money
📊 Past performance ≠ Future results - Markets change constantly
💪 TRADER PSYCHOLOGY EDGE
Set your entries BEFORE market opens. Don't make emotional decisions when the market is moving fast. Your exit plan matters more than your entry plan. Where you exit determines your profit, not where you enter. Profits are made on discipline, not on aggression. The patient traders dominate the impatient ones.
One good trade beats ten desperate ones. Never try to "make back" losses with revenge trading. The best traders know when to step away from the market and recharge their minds.
🚀 ENGAGEMENT BOOSTERS FOR LIKES & VIEWS
If This Resonates:
👍 Like if you trade US500 index regularly
💬 Comment your entry price and targets
⭐ Bookmark this for your personal watchlist
🔔 Follow for daily swing trade setups and analysis
Share Your Thoughts:
"What's YOUR target on SPX? Comment below! 👇 Are you taking this trade or waiting for confirmation?"
"Have you tried the layered entry method? Tell me your experience in the comments!"
