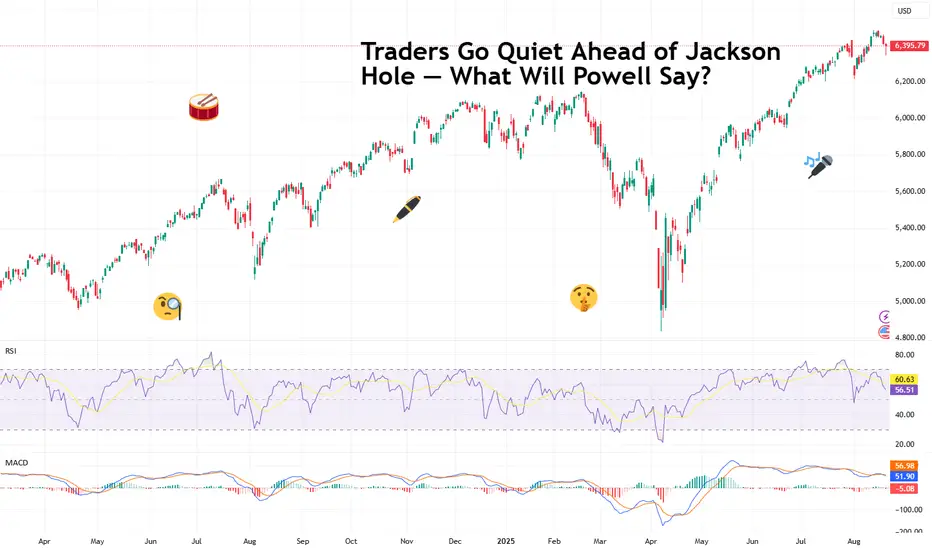
Traders Go Quiet Ahead of Jackson Hole — What Will Powell Say?Markets have been eerily quiet this week. Not because traders suddenly discovered meditation, but because everyone is waiting for one man in Wyoming to make things move.
Federal Reserve Chair Jerome Powell, the man who moves markets with a simple “Good afternoon,” is about to step onto the stage at the annual Jackson Hole Economic Symposium. And when he does, markets will hang on every word — because it’s his final speech as Fed boss at the premium event.
⛰️ Jackson Hole: Where Hiking Boots Meet Basis Points
The Jackson Hole conference isn’t your average PowerPoint snoozefest. Each year, central bankers from around the world swap suits for Patagonia fleeces and gather in Wyoming’s Grand Teton National Park. Think Davos, but with more elk.
This year’s theme? “Labor Markets in Transition.” Translation: the Fed wants to talk demographics, productivity, and immigration — the forces shaping how Americans work and how the economy grows. But make no mistake: nobody’s tuning in for a TED Talk on labor force participation rates. They want Powell’s take on interest rates.
🎯 Powell’s Big Moment
Powell’s speech may only run about 15 minutes (he’s not known for monologues), but the stakes couldn’t be higher. His term as Fed chair ends in May, and President Donald Trump has spent most of this year taking swings at him — calling him a “major LOSER” and grumbling that the Fed is moving “Too Late” on rate cuts.
Trump has even floated the idea of firing Powell early, which, technically speaking, isn’t supposed to happen. But this is 2025, and “not supposed to happen” has lost most of its meaning.
So, Jackson Hole could be Powell’s last best chance to lock in a legacy: defending the Fed’s independence while signaling where rates are headed next.
⛅️ Markets Already Have a Guess
Wall Street isn’t exactly sitting in suspense. Interest-rate swaps are pricing in an 80% chance of a 25-basis-point cut in September, with two full cuts baked in before the year is out.
Why? Because the data leaves Powell little wiggle room:
Jobs market: Recent revisions show weaker-than-thought employment growth . Maximum employment? Not quite.
Inflation: July’s consumer price index came in at 2.7% year-on-year — stable, but not scary enough to justify keeping rates where they are forever.
Tariffs: Trump’s sweeping duties could pressure inflation further, but they’re also weighing on growth. Powell’s challenge is threading the needle between those forces.
Translation: the Fed looks ready to flip from “higher for longer” to “cutting season.”
🧘♂️ Traders on Mute
If you think markets look a little sleepy, you’re not wrong. On Monday, the S&P 500 basically took a nap , slipping 0.01% as traders sat on their hands. Tuesday was even worse with big tech nosediving all day long.
It’s not just Powell they’re waiting for. Roughly 95% of S&P 500 companies have now reported earnings, (mandatory note: catch all earnings dates in the Earnings Calendar ) with more than 80% beating expectations.
Companies have been surprisingly nimble, offsetting tariffs and riding the weaker dollar . Yet despite the blowout earnings season, nobody wants to make big moves until Powell clears the air.
Call it the pre-Jackson Hole silence — the calm before the potential volatility storm.
🥊 Powell vs. Trump
There’s also political theater baked into this. Trump has made no secret of his desire for lower rates to juice growth and pump markets. Powell, however, has tried to keep the Fed above the political fray.
But that balancing act has been messy. Lower too quickly, and Powell risks stoking more inflation. Hold too high, and he risks slowing the labor market just as it’s showing cracks. Either way, he’ll be accused of playing politics.
This isn’t just about economics. It’s about central bank independence — a fancy way of asking: Can Powell make decisions without getting steamrolled by the White House?
🔮 What to Watch For
Here’s what traders will parse in his speech:
Tone: Does Powell sound more dovish (hinting at cuts) or still hawkish (concerned about tariffs fueling inflation)?
Framework: Will he unveil a new policy strategy for inflation and jobs?
Forward guidance: Any nods to September’s meeting or beyond will be amplified a thousand times on trading desks worldwide.
In other words, the market doesn’t just want Powell’s words. It wants the subtext and the context.
🚀 Why It Matters for Traders
For traders (yes, you), Powell’s Jackson Hole moment has real portfolio consequences:
Equities: A dovish Powell could extend the market’s record run — the S&P 500 and Nasdaq already logged new all-time highs this summer.
Bonds: Rate cuts could mean yields falling, bond prices rising. Treasuries might not be the snooze trade they’ve been.
Dollar: Lower rates could push the greenback down, offering a boost to commodities and emerging markets. Lower rates = lower deposit yields = less appeal to hold greenback.
Crypto: Yes, even Bitcoin BITSTAMP:BTCUSD cares. A dovish Fed means more liquidity sloshing around — which historically finds its way into risk assets.
🏁 The Takeaway
Markets are quiet now, but don’t expect them to stay that way. Powell’s Jackson Hole speech is shaping up as one of the most important of his career — maybe his swan song as Fed chair.
Off to you : Here’s a question (or two). Will he go dovish, handing traders the rate cuts they crave? Or will he stand firm, reminding everyone that the Fed won’t be bullied by politics? Share your thoughts in the comments!
US500 trade ideas
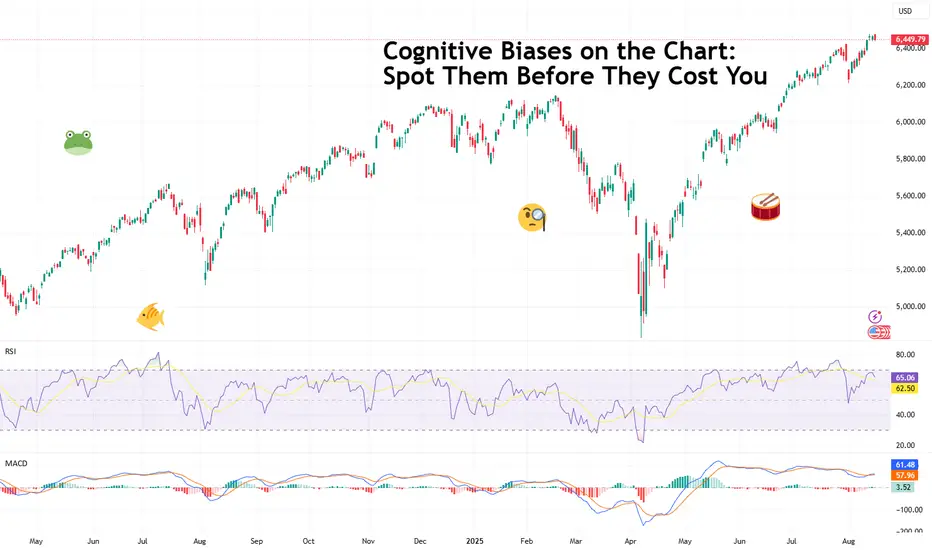
Cognitive Biases on the Chart: Spot Them Before They Cost YouMarkets have enough enemies: central banks, unexpected earnings misses, rogue tweets from billionaires. The last thing you need is your own brain quietly kneecapping your trades.
Yet, that’s exactly what happens every day — traders falling prey to cognitive biases, those sneaky mental shortcuts that can distort judgment, inflate confidence, and drain your account.
Let’s pull back the curtain on the biggest culprits.
💍 Anchoring Bias: Marrying a Trade
Ever fall in love with a number? Traders do this all the time. Anchoring bias happens when you fixate on a past price and let it lead your present decisions.
Example: You bought C3 AI NYSE:AI at $45 a pop. Now it’s under $20, and you refuse to sell because “it’ll get back to $50 and beyond.” Newsflash: the market doesn’t care about your entry. Anchoring keeps you tethered to arbitrary price points while the trend moves on without you.
👉 How to counter it : Use hard data, not nostalgia. If the chart screams breakdown, like the recent drop in NYSE:AI thanks to a sales disaster , stop waiting for a magical return to your anchor. Trade the price action, not the ghost of your buy button.
😌 Loss Aversion: Pain > Pleasure
Behavioral economists tell us that losing $100 feels about twice as bad as winning $100 feels good. Traders know this instinctively — which is why they often let losers run and cut winners short.
Think of it: you close a trade that’s up 5% because you “don’t want to lose the gains.” Meanwhile, you let the -20% red candle sit there because “it’s only a loss if I sell.”
👉 How to counter it : Flip the script. Place stop-losses and honor them religiously, especially in peak earnings season . Train your brain to view losses as part of the game — like paying rent to the market for playing on its field. Or tuition fee for your hands-on education.
🔊 Confirmation Bias: The Echo Chamber Trade
You think Ethereum BITSTAMP:ETHUSD is going to $5,000. So, naturally, you seek out influencers, news, and even memes that validate your thesis, while conveniently ignoring that pesky Fed statement hinting at liquidity tightening.
This is confirmation bias: curating your information diet to make yourself feel smart, secure, and validated.
👉 How to counter it : Actively hunt for disconfirming evidence. If you’re long, force yourself to read the bear case. If it rattles you, that’s a sign your conviction might be built on shaky ground. Also, Ethereum has indeed been on a pump so strong , you’d believe it’s almost unstoppable.
💫 Recency Bias: Yesterday = Forever
Markets swing, sometimes violently. Recency bias tricks you into believing that whatever just happened will keep happening. The FX:GBPUSD advanced last Thursday ? Must keep climbing further.
Traders caught in this loop over-leverage into recent patterns, forgetting that markets are professional curveball pitchers.
👉 How to counter it : Zoom out. Intraday candles may trick you into seeing things that aren’t there in the long run. Daily, weekly and monthly charts often tell a different story.
💪 Gambler’s Fallacy: “I’m Due” Syndrome
Every roulette player knows this one: if red’s hit five times in a row, black must be next. Traders fall for the same illusion. If FX:EURUSD has surged for eight straight sessions , surely it must drop… right?
Wrong. The market doesn’t know it “owes anything.” Trends can persist longer than your margin account can survive. Reminder time: John Maynard Keynes' famously said, "Markets can remain irrational longer than you can remain solvent."
👉 How to counter it : Respect momentum. Use indicators like RSI or moving averages to spot genuine exhaustion, not just wishful thinking.
😎 Overconfidence Bias: I’m Smarter Than Them
This one’s pretty widespread. After a few wins, traders start believing they’ve cracked the code. Suddenly, leverage dials up, position sizes balloon, and risk management gets left on read.
Markets love humbling overconfident traders. That “can’t miss” setup? It misses. That oversized bet? Blown up. Overconfidence is why many promising traders don’t survive past year one.
👉 How to counter it : Journal your trades . Cold, hard data has a way of deflating ego bubbles. And size positions consistently — the market doesn’t care if you “feel” more confident this time.
🐑 Herd Mentality: Everyone Can’t Be Wrong… Right?
If all of Reddit says “buy the dip,” surely they can’t be wrong. But if you’re hearing it from everyone, odds are the move already happened. Herd mentality gives comfort but rarely alpha.
It explains bubbles, FOMO runs, and why traders pile into a hot stock minutes before it tanks.
👉 How to counter it : If you’re chasing a move because everyone else is, pause. Ask: what’s my actual edge here? If the answer is “none,” step away.
💯 The Meta-Bias: Thinking You Have None
The cruel twist? Once you know about these biases, you might think you’ve conquered them. But that may not be the case. Awareness helps, but biases are hardwired into human behavior.
That’s why risk management exists. Stop-losses, adequate leverage, proper diversification — they’re not just tools, they’re counter-bias survival kits.
🙌 Final Word: Outsmarting Yourself
The market isn’t your enemy (unless you view BlackRock, Ken Griffin, the hedge fund bros, and other retail traders as enemies). Anchors, overconfidence, herds, recency — these are real chart criminals draining accounts in broad daylight.
Smart traders don’t try to eliminate biases. They build guardrails to minimize the damage. Because at the end of the day, you can’t reprogram human psychology. But you can protect your portfolio from it.
👉 Off to you : Are you tempted to “average down because it’s due” or “let it ride because I’m on fire?” Share your thoughts in the comment section!
US500: Bulls Pause as Pullback Risks GrowUS500 has been riding an impressive uptrend, with buyers pushing the index to fresh highs above 6,440, but the recent stalling near resistance suggests that momentum may be losing steam. With growth concerns, central bank caution, and a round of key economic data on deck, the risk of a corrective pullback is building. This setup highlights the importance of watching whether support levels hold or if sellers gain the upper hand.
Current Bias
Bearish (Short Term) – While the broader trend remains bullish, near-term technicals and macro uncertainty point toward a corrective pullback.
Key Fundamental Drivers
US Earnings Season: Mixed corporate earnings, with strength in tech offset by weakness in cyclicals.
Fed Policy: Markets are still weighing timing of potential rate cuts, but sticky inflation data and cautious Fed commentary keep rates elevated.
Bond Yields: US yields remain relatively high, pressuring equities when safe-haven flows emerge.
Macro Context
Interest Rates: The Fed is in a “wait-and-see” mode, balancing sticky services inflation against slowing growth. Rate cuts are still priced for later this year, but not aggressively.
Economic Growth: US economy shows signs of slowing, with softer retail sales and housing data, though labor markets remain resilient.
Commodities/Flows: Energy costs are stabilizing, but higher oil prices in recent weeks could add inflationary pressure.
Geopolitics: Trade tensions, tariffs, and Middle East instability add layers of risk, supporting defensive positioning.
Primary Risk to the Trend
A surprise dovish shift from the Fed or stronger-than-expected US earnings could quickly reignite bullish momentum and push US500 higher, invalidating the pullback scenario.
Most Critical Upcoming News/Event
FOMC Minutes & Powell Speeches – Markets will look for clarity on rate cut timing.
US CPI & PPI Data – Any upside surprises could weigh heavily on equities.
Leader/Lagger Dynamics
The US500 is a leader, often dictating global equity sentiment. Movements in US500 ripple into NASDAQ, DAX, FTSE, and risk-sensitive FX pairs such as AUD/JPY. Its role as a global risk benchmark makes it highly influential.
Key Levels
Support Levels: 6,370, 6,231, 5,920
Resistance Levels: 6,447 (recent high), 6,500 psychological barrier
Stop Loss (SL): 6,480 (above recent highs)
Take Profit (TP):
TP1: 6,370
TP2: 6,231
TP3: 5,920
Summary: Bias and Watchpoints
US500 bias is shifting to neutral-to-bearish, with the index showing signs of fatigue at highs around 6,440–6,450. A pullback toward 6,370 → 6,231 is possible, with 5,920 as an extended target if risk sentiment deteriorates. A protective stop at 6,480 is key in case bulls regain momentum. Traders should keep a close eye on Fed communication and US inflation data, as these remain the most powerful catalysts for near-term direction. With the US500 acting as a leader for global equities, its moves will likely shape broader market sentiment across stocks, indices, and even risk-sensitive currencies.

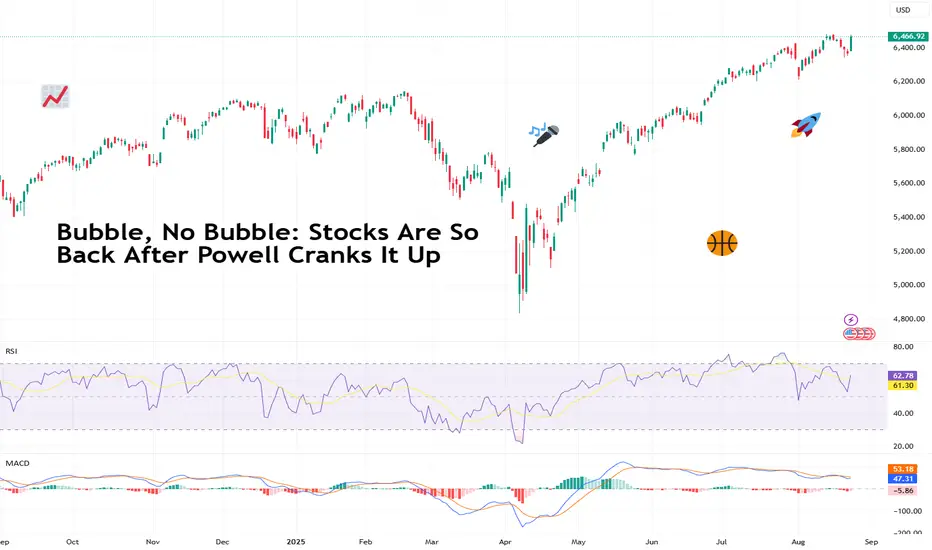
Bubble, No Bubble: Stocks Are So Back After Powell Cranks It UpStretched valuations, talks of froth, and overall market fatigue. That’s what investors were saying for stocks (especially those AI plays) up until Powell brought up the vibe that rekindled the animal spirits. Let’s talk about that.
📈 Powell Drops the Mic
Markets started last week exhausted. The S&P 500 SP:SPX was wobbling, the Nasdaq NASDAQ:IXIC was shedding like your beautiful ragdoll cat, and traders were probably looking up vacation getaways instead of technical patterns.
But then on Friday we all came together to hear one man speak . It was the same neutral, laid back tone, but this one time something was different. As if… a bolder man was on the stage, unafraid to crank it up. Or was it more of an elderly man finally giving the kids what they wanted?
In his speech at Jackson Hole, Fed boss Jay Powell acknowledged what markets had been hoping to hear: “The risk of rising prices has diminished.” Translation? The Fed finally sees inflation cooling down. And the labor market might need some help, too.
That was all it took. Risk appetite flipped, sending equities way higher into Friday’s close (even though Monday's futures dipped a bit ).
The S&P 500 SP:SPX booked a solid 1.5% pop, the Dow Jones TVC:DJI surged 1.9% to a fresh all-time high, and the Nasdaq NASDAQ:IXIC managed to erase much of its weekly losses after a strong 2% increase. Powell didn’t cut rates yet — he just gave markets a few reasons to believe cuts are coming.
🚧 The Job Market Pivot
Before Powell spoke, traders were bracing for maybe one rate cut this year, if any. Sticky inflation had the Fed cornered. But Powell flipped the narrative, shifting attention to the labor market instead.
The US unemployment rate has climbed nearly a full percentage point over the past year, and job growth is slowing fast, averaging just 35,000 new positions per month over the past three months. Even worse, revisions stripped 258,000 jobs from May and June’s data.
For traders, this was the lightbulb moment: a weakening labor market gives Powell the green light to pivot.
🔥 Inflation Still Isn’t Dead
Here’s the awkward part: while Powell’s tone eased market fears, the inflation problem hasn’t magically vanished. Core CPI is still running 3% year-over-year, well above the Fed’s 2% target, even as the headline CPI ECONOMICS:USCPI stood at 2.7% for July .
Meanwhile, wholesale prices ECONOMICS:USPPI — often a precursor to consumer price trends — surged 0.9% last month , marking their fastest monthly jump in three years.
Powell is walking a tightrope: move too quickly on cuts, and inflation could flare up again; wait too long, and the job market weakens further. The stakes are high, and the balance fragile.
🎈 Bubble Talk, Again
Every time stocks rip higher, the “bubble” debate resurfaces. And honestly? It’s hard to ignore it this time. AI stocks are priced like they’ve already rewired how the world works, and the Nasdaq’s relentless rally looks almost too clean.
But here’s a reality check. We’ve never had a big market crisis for the past 16 years. March 2020? Recovered in a few months. April’s mini-crash? Erased in weeks.
Markets seem determined to brush off every scare and buy the dip. Powell’s pivot only reinforced that attitude: traders don’t care about stretched valuations if the Fed is hinting at cheaper money ahead.
🤖 Nvidia’s Market, Nvidia’s Rules
That’s how we move forward to what’s next. Nvidia NASDAQ:NVDA drops earnings on August 27 ( Earnings Calendar for reference). And because this is Nvidia’s market and we all live in it, expectations are sky-high.
Analysts are projecting just under $46 billion in revenue and $1 per share in earnings . But the real focus? Forward guidance.
If Nvidia signals a blockbuster Q3 — something in the ballpark of $54 billion in sales — it could keep fueling the AI mania and push the Nasdaq and the S&P 500 to fresh highs. But if the numbers disappoint, this entire rally could wobble.
Considering Nvidia has added more than $3 trillion in market cap since 2023, it’s no exaggeration to say the stock’s earnings could set the tone for everything else.
🦁 Animal Spirits Are Back
Powell’s softer tone and the Nvidia hype machine have combined to reawaken animal spirits across Wall Street. That makes for a good example on how you can shift from doom-posting about stagflation to refreshing the ATH charts in less than 48 hours.
The S&P and the Dow are at or near record highs, the Nasdaq is eyeing another breakout. What’s not to like? The rally isn’t bulletproof.
It’s being driven as much by vibes as fundamentals right now. Rate cuts haven’t happened yet, the labor market is fragile, and inflation hasn’t fully cooled. The market appears to be trading on optimism — and optimism can turn fast.
🏁 The Bottom Line
Jerome Powell didn’t announce a rate cut, but he did something almost better: he opened the door a bit wider. By acknowledging softer labor data and reduced inflation risks, he revived traders’ appetite and gave permission to believe the rally has legs.
But this story has two big hinges: Nvidia has to deliver, and inflation has to behave. One earnings miss or a hot CPI print, and this animal spirit revival could fade as quickly as it started.
Off to you : Are you long and excited about the outlook? Or you’re in the bear camp and looking for your chance to short this market? Share your views in the comments!
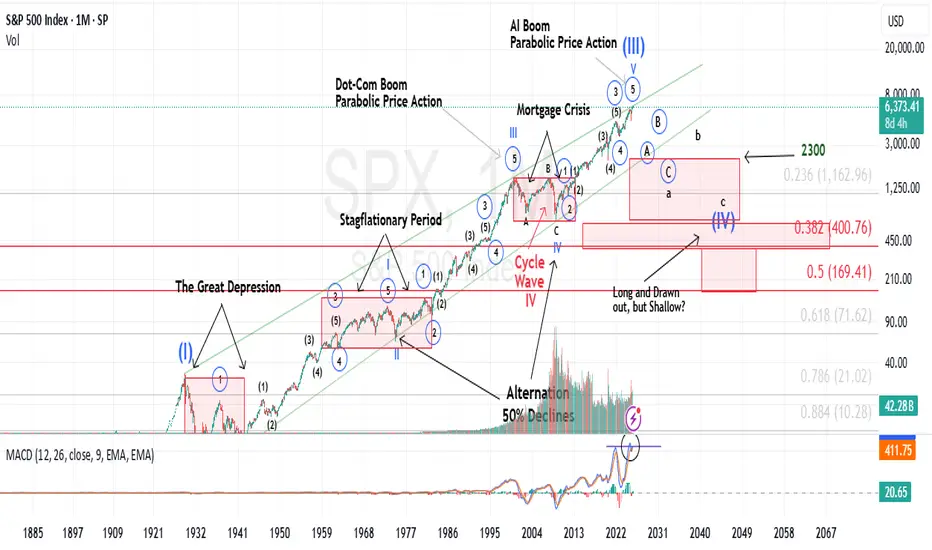
Are Longterm Interest Rates Telling Us Something?I rarely cite financial news in my market updates.
My reasoning is simple: all perspectives, bullish or bearish, are ultimately reflected in price action. That price action forms patterns, and those patterns can be analyzed to produce reasonable forecasts. After years of applying Elliott Wave theory, this approach has consistently stood the test of time.
That said, I’ll break from tradition today, as I believe the following excerpt is particularly relevant to my latest Trading View update. It comes from Barbara Kollmeyer’s article, “There’s a slow-motion crisis in bonds — and this bearish strategist thinks it will hit stocks.”
For context, I regularly track multiple market indices, futures contracts, single stocks, and notably, the yield on the 30-year U.S. Treasury Bond. For the past year, I’ve highlighted the counterintuitive rise in long-term yields that ironically began when the Fed started cutting its benchmark rate in September 2024. While brief divergences between long-term yields and Fed policy aren’t unusual, this persistent uptrend is different. The yield has been carving out a clear pattern of higher highs and higher lows, appearing now on the verge of a breakout—not just toward incremental new highs, but potentially into a runaway scenario for long-term rates.
This is why Albert Edwards’ recent comments caught my attention:
“There is a slow-motion crisis unfolding in the government bond markets that equity investors continue to ignore at their peril. The upward grind for long bond yields has been relentless, yet investors keep ignoring that to focus instead on more bullish metrics such as the latest reporting season driven by the mega-cap IT stocks, that promises a pot of gold at the end of the AI rainbow.”
His perspective resonated with me.
Having lived through the dot-com boom and bust, I recall how new technologies can fuel outsized market optimism. AI undoubtedly carries transformational potential, much like the Internet. But just as it took nearly two decades for the Internet to fully translate from speculative boom to tangible economic value, AI’s payoff will likely follow a similarly extended trajectory. It’s not an immediate catalyst.
What I am certain of is this: the cost of long-term money is rising, with implications far beyond bond charts. Higher yields directly affect mortgage rates and other long-term financing costs. More importantly, sustained upward pressure in long-term rates has the potential to weigh heavily on equities, broader markets, and asset valuations for far longer than many currently expect.
I think this bubble will popWelcome fellow traders and investors.
As you might have noticed… a lot of markets are topping at this moment. I think there will be a time that this market corrects to its true value. At this moment i’m looking at a 25% dip… If might sound horrible but we we’re at this point in april.
Im watching the S&P 500 for levels around $4800 and $4500.
I hope you can get the conversations started with my opinion ;-) Good luck and enjoy the ride down… or up

Greatest buyback opportunity on SPX @ 3,958$!SPX should see an increase to 6,860$ and then see a financial crash like drop to 4,817$ at the least. Thereafter, to drive other asset classes even lower such as BTC, SPX will drop even lower to 3,958$!
That's the price action I expect to see over the next few weeks, months etc.

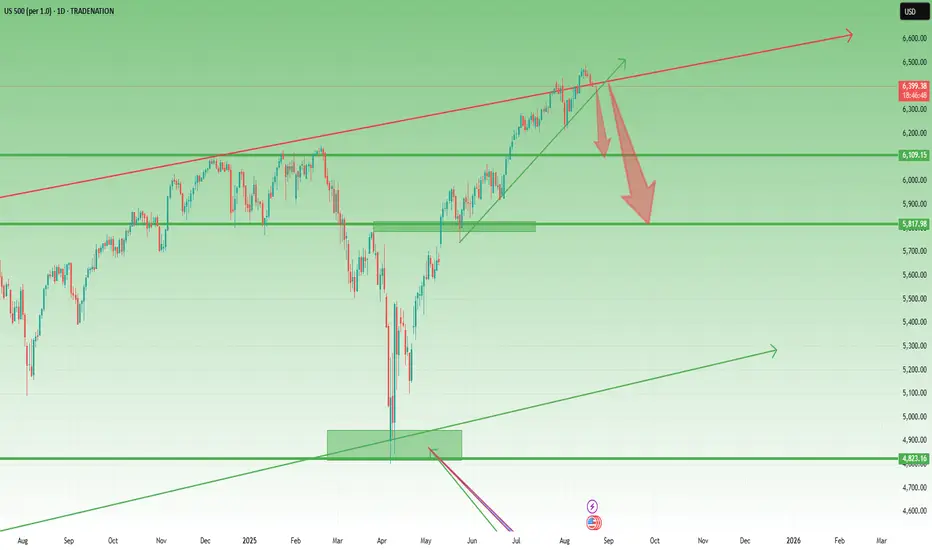
US500 – Has the Correction Started?1. What Happened Yesterday
Yesterday, US500 dropped around 1%, signaling that a meaningful correction could be starting. Unlike Nasdaq, which already broke under two key support levels, here the price is still above the trendline that began back at the end of May, when the index broke through the important 5800 resistance.
The rise since April has been huge and not fundamentally justified, making the index vulnerable to a reversal towards more sustainable levels.
________________________________________
2. Key Question
Has the correction really started, or will we first see another spike before the drop?
________________________________________
3. Why More Downside is Likely
• Trendline vulnerability: A break under 6380 could trigger acceleration to the downside.
• First bear target: 6100, the old ATH.
• Bigger picture: A move under 6000 remains likely, with 5800 as a longer-term destination.
• Risk/reward setup: Any spike higher should be seen as a selling opportunity. Around 6500 would be ideal to short.
________________________________________
4. Trading Plan
• Sell spikes, especially near 6500).
• Watch 6380 – break here could open the way towards 6100.
• Medium/long term bias: Bearish, with more room down than up.
________________________________________
5. Final Note 🚀
The market must confirm, but the strategy is clear: don’t chase the bounce, sell the strength and ride the correction.
Disclosure: I am part of TradeNation's Influencer program and receive a monthly fee for using their TradingView charts in my analyses and educational articles.
S&P REBOUND USING DATA POINTS FROM 10 YEARS BACKTHE MARKETS SHOULD REBOUND END SEPT OR EARLY OCTOBER ACCORDING TO HISTORICAL DATA.
ChatGPT helped analyze this chart that I made. I went back 10 years and analyzed how long pullbacks are after a market rally. I removed some of the major outliers like Covid and 2022 rate hikes to 5.25%. Using our sample test cases that somewhat align with our current market conditions this is what ChatGPT helped me with......
Here’s what your boxes say, numerically (ignoring the crisis outliers):
Durations you marked: 31d, 57d, 61d, 63d, 91d, 91d → avg ~66 days, median ~62 days (about 2 months).
Drawdowns you marked: ~6.0%, 9.9%, 10.1%, 11.4%, 15.9%, 17.7%, 18.3% → median ~11.4%, mean ~12.8%.
Most of the time, the “routine” pullback sits ~8–12%; the 15–18% drops do happen, but usually finish quickly (2 monthly bars).
What that implies for this pullback
Using the current level shown on your chart (~6,349):
Typical reset (most common):
–8% to –12% → ~5,84k–5,59k.
That corridor overlaps your MA-ribbon cluster (~5,77k → 5,57k → 5,48k → 5,39k → 5,30k), which is where past pullbacks often end in bull trends.
Deeper but still “normal”:
–15% to –18% → ~5,40k–5,21k, i.e., probing the lower ribbon (~5.39k–5.30k) without breaking the longer-term uptrend.
Time expectation: Your history points to ~2 months on average (range 1–3 months). If this pullback is already one monthly bar in, the base-case is another 1–2 bars of chop/weakness before the trend attempts higher—unless buyers reclaim highs sooner.
Signals to watch on your chart
Monthly closes vs. the ribbon
Healthy: wicks into 5.7k–5.6k that close back above the upper/mid ribbon.
Caution: Two monthly closes < ~5.30k (lower ribbon) plus a flattening ribbon.
RSI(14) monthly (yours is ~70 and curling): a normal reset is 55–60 while price holds the ribbon. Sustained <50 shifts risk to a longer correction.
MACD monthly: a gentle histogram fade with price respecting the ribbon = routine pullback. A bearish cross with closes below the lower ribbon flags the 15–18% scenario or worse.
Quick map (actionable zones)
Shallow buy-the-dip: 5,75x–5,65x
Deeper, still-bull: 5,45x–5,32x
Trend-change risk: persistent closes <~5,30x
Bottom line: with the crisis moves removed, your own data argues the current pullback most likely lasts ~2 months total and bottoms ~8–12% off highs, near the upper/mid MA ribbon. Only if monthly candles start living below ~5.30k (and RSI/MACD roll hard) do the 15–18%/multi-month outcomes become the base case.

S&P500 Can the 4H MA50 save the day again?The S&P500 index (SPX) is on a short-term pull-back following the new All Time High (ATH) on August 15 of the 3-month Channel Up. It is just above the 4H MA50 (blue trend-line), which has been the most common level of Support throughout this pattern, before the 4H MA200 (orange trend-line), which formed its last Higher Low.
As a result, as long as it holds, it is more likely to see a continuation of the Bullish Leg that started on the 4H MA200 bounce (August 01). The previous Bullish Leg peaked on a +8.80% rise, so that gives us a medium-term Target of 6750.
-------------------------------------------------------------------------------
** Please LIKE 👍, FOLLOW ✅, SHARE 🙌 and COMMENT ✍ if you enjoy this idea! Also share your ideas and charts in the comments section below! This is best way to keep it relevant, support us, keep the content here free and allow the idea to reach as many people as possible. **
-------------------------------------------------------------------------------
Disclosure: I am part of Trade Nation's Influencer program and receive a monthly fee for using their TradingView charts in my analysis.
💸💸💸💸💸💸
👇 👇 👇 👇 👇 👇

US500 at All-Time High – Pullback or Breakout Ahead?The US500 has reached the All-Time High (ATH) zone after a strong bullish leg.
We are now at a key decision point: will the price correct lower to gather strength, or break out and extend the rally?
📊 Scenario 1 – Pullback before breakout
Possible rejection at the ATH with a correction toward the 6440–6460 support/resistance zone.
If buyers defend this area, it could provide a solid long entry opportunity.
📊 Scenario 2 – Direct breakout
A clean breakout above 6480–6500 with strong volume could trigger another bullish wave.
Waiting for confirmation is crucial to avoid a false breakout.
⚖️ Conclusion
The broader trend remains bullish (H4 uptrend line intact). The most likely path is a continued move higher, potentially after a short pullback to relieve buying pressure.
👉 This is an educational analysis only, not financial advice.
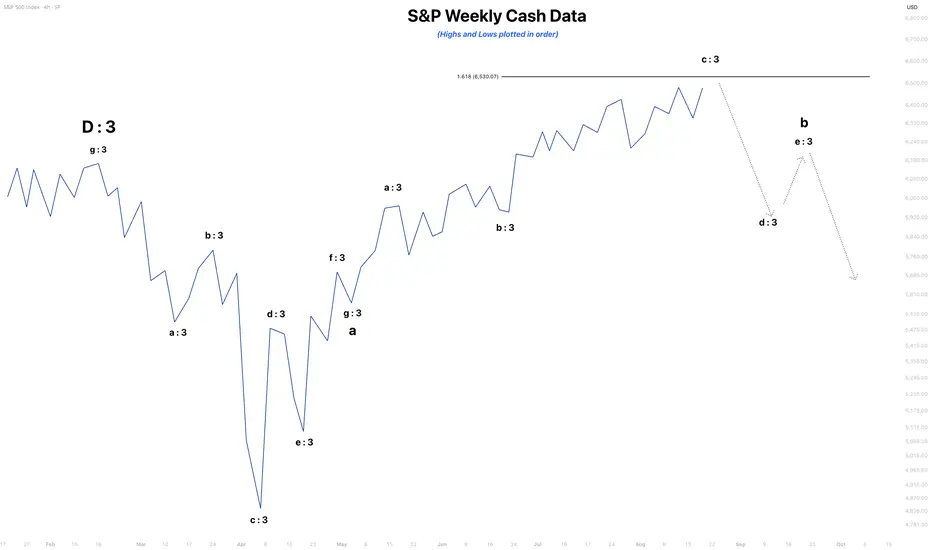
S&P Weekly NEOWAVE AnalysisThe index appears to be approaching a potential short-term top. The ongoing Wave B structure is most likely unfolding as a Neutral Triangle, given the prolonged time taken by Wave C. Based on the guideline of alternation, Wave D is expected to be sharp and deep, while Wave E will likely mirror the length of Wave A.
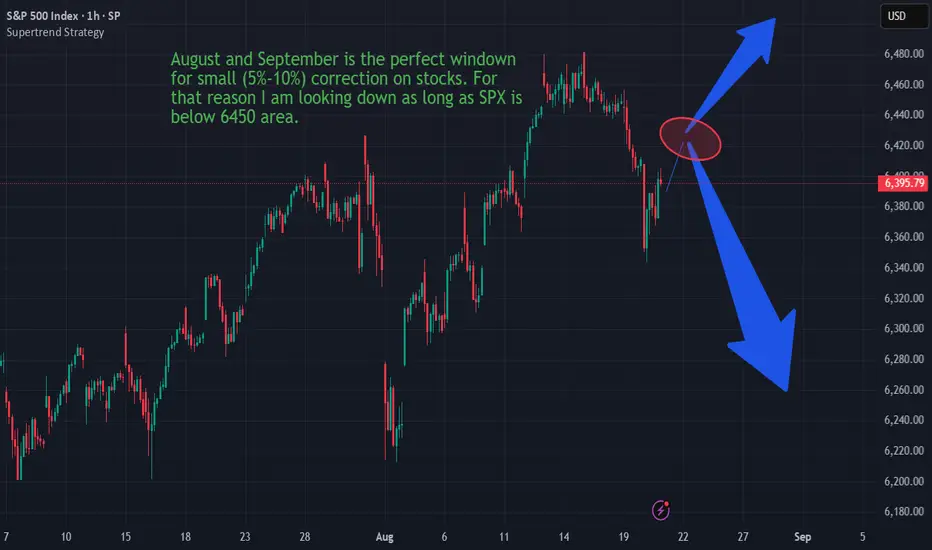
SPX- potential for 5% drop in comming weeks.Currently market is oscilating around 6400 lvls, which is only 1% below ATH. Historicaly August and September are relatively bearing so we are at good levels to short the market with tight tops right abobe ATH. Risk/Reward is great. 1:5.
SP500 here we go again -SHORTi had waited for another opportunity to reopen my closed position- if the prcie over the next days doesnt go above 6500 (daily candle) I'm pretty happy holding to my short
don't copy- just an idea not advise! also- protect your capital hence s/l always recommended

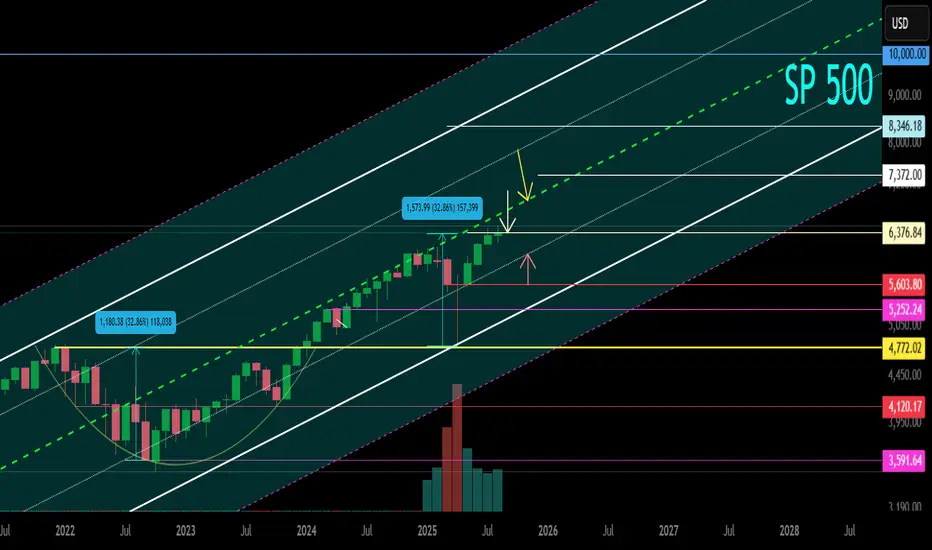
Is this the secret to the stock market? the holy grail?can someone with more experience and skills with analysis confirm what I'm seeing? It basically looks like I stumbled upon the secret of how the stock market works. it can't be this easy, can it? If this holds true we know with a high degree of accuracy when a correction / crash will happen and when a recovery will happen.
My specialty is pattern analysis and channels, but there is no way that deciphering the stock market is this easy. it basically says in a few days we are going to have a correction/ crash, even though we just had one. Maybe the tariff crash was premature and the market was trying to set itself up for a crash according to it's original timeline?
if this holds true it means the entire market is operating on a schedule/ cycle
S&P 500 Eyes Breakout as Powell Signals Rate CutThe S&P 500 is once again approaching record territory, with momentum accelerating after Fed Chair Jerome Powell signaled a potential rate cut at Jackson Hole. Markets welcomed the dovish shift, boosting risk appetite and driving stocks higher.
Beyond Powell’s comments, several other factors are fueling the rally. Softer inflation readings have reinforced the case for easier policy, while labor market data shows a cooling trend without triggering recession fears. This “goldilocks” scenario continues to support equities.
Strong corporate earnings have also underpinned the move, particularly from the tech and consumer sectors, where margins remain resilient despite macro uncertainty. Capital inflows into equity ETFs highlight renewed investor confidence, while declining bond yields are making stocks relatively more attractive.
On the technical side, the S&P 500 is pushing toward the 6,500 level, its all-time high. A clean break above this barrier would confirm fresh upside momentum, potentially triggering further buying from trend-following funds.
While risks remain from geopolitics and trade tensions, the current mix of easing Fed expectations, solid earnings, and supportive technicals suggests the index could extend higher. A breakout above 6,500 may set the stage for another leg in the bull market.

SPX500 Market Outlook | Fed Meeting & Retail Earnings in FocusSPX500 Overview
Wall Street subdued as retail earnings and Fed meeting remain in focus
U.S. stock index futures edged lower on Wednesday, extending a tech-led pullback on Wall Street. Investors are closely monitoring earnings from major retailers such as Target and Lowe’s, seen as key indicators of consumer health, while awaiting the upcoming Federal Reserve symposium later this week.
Concerns over tariffs and their potential impact on consumer prices have weighed on sentiment, adding to the cautious market tone.
🔎 Technical Outlook
The SPX500 remains under bearish pressure after stabilizing below the pivot line at 6425.
Bearish Scenario:
As long as price trades below 6425, the trend favors the downside, targeting 6389 and 6366. A confirmed break of 6366 could accelerate the decline toward 6321.
Bullish Scenario:
A sustained 4H candle close above 6425 would shift momentum back to the upside, with resistance at 6439, followed by 6468 and 6485.
Support: 6389, 6366, 6341, 6321
Resistance: 6439, 6468, 6485

$SPX500 Short Trade - Target 6414 - Easy MoneyFOREXCOM:SPX500 Short Trade
Entry: 6450-6460
TP: 6414
This is good trade.
Don't overload your risk like Greedy gambler!!!
Be Disciplined Trader, what what you can afford.
Use proper risk management.
Disclaimer: Trading is risky, only idea, not advice.

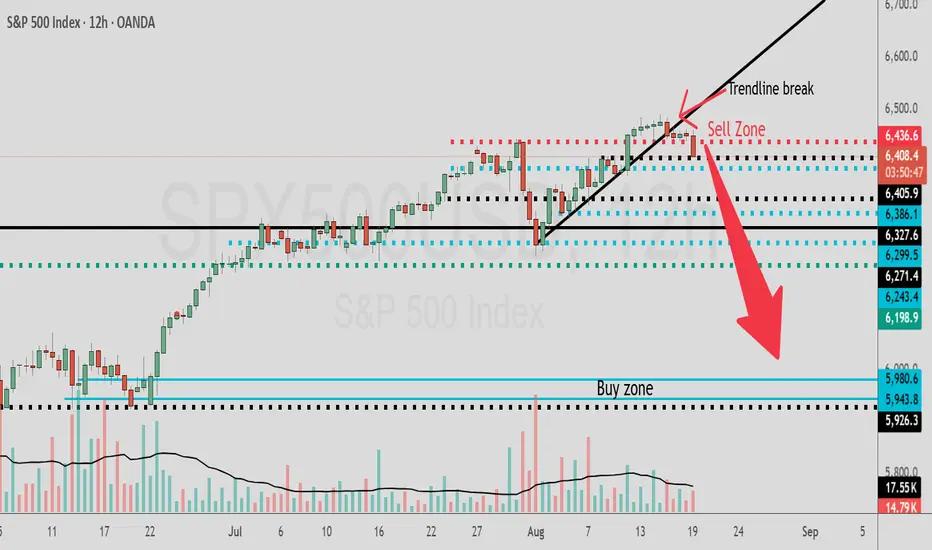
Trendline Break To The Downside In SPX/USDHey Traders and followers! Hope your summer has been going great along with your profits $
Take your money off the table in SPX if you are long and jump into a short as we have a trendline break to the downside on the 12hr chart.
Price has broke through the sell zone area of 6436.6 painting a bearish picture for SPX way down to 5980.6 area.
If price breaks back up above 6436.6 area then the bearish break trade will be off the table.
Best of luck in all your trades $$$
SPX Weak Bearish Bias → 6440P Caution Trade
# 🏦 SPX Weekly Options Analysis – 8/18
📉 **Market Context**
* Mixed signals across metrics → weak bearish bias
* Price below VWAP → potential short-term downside
* Volume insufficient → low conviction
* Call/Put ratio neutral → no strong directional bias
---
## 🎯 Trade Setup (Cautious Put)
* **Instrument**: SPX
* **Direction**: PUT (SHORT)
* **Strike**: 6440
* **Expiry**: 2025-08-18
* **Entry Price**: \$0.60
* **Profit Target**: \$1.20
* **Stop Loss**: \$0.30
* **Size**: 1 contract
* **Confidence**: 60%
* **Entry Timing**: Market Close
---
## 📈 Breakeven @ Expiry
👉 6439.40 (Strike – Premium)
SPX must **close < 6439.40 by market close** to profit at expiry.
---
## 🧠 Key Risks
* Mixed signals → potential whipsaw ⚡
* Market structure unclear → downside not guaranteed
* Theta decay risk → short-term option, fast time decay
---
# ⚡ SPX 6440P SHORT PLAY ⚡
🎯 In: \$0.60 → Out: \$1.20
🛑 Stop: \$0.30
📅 Exp: 8/18
📈 Bias: Weak Bearish, trade cautiously 🐻
---
📊 **TRADE DETAILS JSON**
```json
{
"instrument": "SPX",
"direction": "put",
"strike": 6440.0,
"expiry": "2025-08-18",
"confidence": 0.60,
"profit_target": 1.20,
"stop_loss": 0.30,
"size": 1,
"entry_price": 0.60,
"entry_timing": "close",
"signal_publish_time": "2025-08-18 15:02:25 UTC-04:00"
}

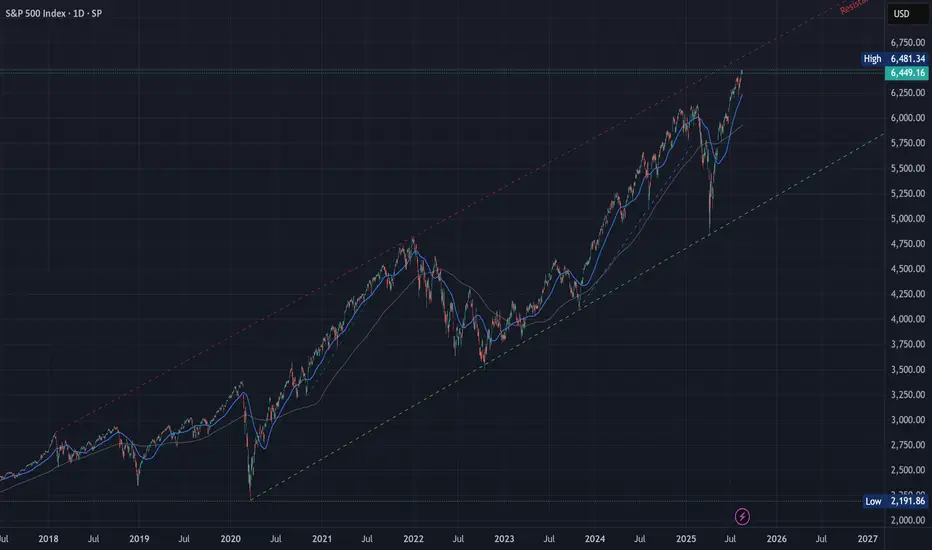
SP500 Secondary trend. Part of the channel. Reversal zone. 2025 Logarithm. Time frame 1 month (less is not necessary). The SP500 index primarily reflects the "health" of the American stock market and the economy as a whole. This is reflected in all markets by the domino effect.
Now, after a huge takeout and recovery, the price is at the maximums of the local trend that has formed, and this is also the maximum of the index as a whole for its entire 100-year existence (before displaying on the chart).
🔄 Locally, the price has run into the resistance of the median of the ascending channel (green dotted line). Now the resistance level of this zone will be formed.
🟢 A breakout of this zone upwards - an exit above the median, promises strong growth and pumping of the stock market as a whole.
🔴 And the reverse process is not a breakthrough and not a consolidation above this zone - consolidation in the range under resistance and above the dynamic support of the internal channel. An extremely negative case is a decline in the lower zone of the channel.
🧠 The chart as a whole shows the channel range itself. Including on both sides, price slippage zones (low probability), as well as key support / resistance levels of this secondary trend that exist, and those that will be formed in the future, but will be key for the development of the trend. This can be an addition to the analysis and formation of tactics and money management in other markets, including cryptocurrency.
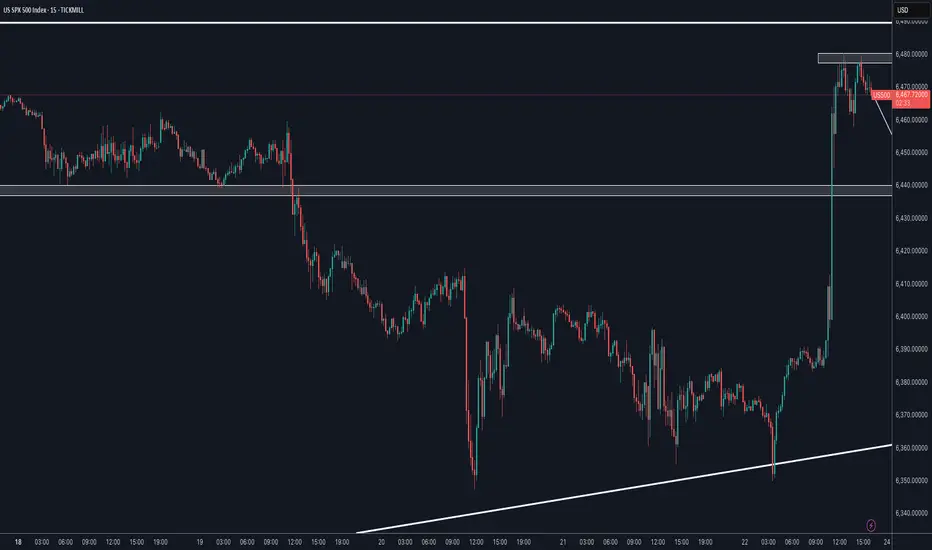
SPX500 Awaits Breakout Ahead of Nvidia EarningsSPX – S&P 500 Futures Update
After Powell’s Jackson Hole speech pumped markets on Friday, traders rushed into risk assets, lifting the Dow to fresh records.
Powell didn’t commit to cuts, but also didn’t rule them out — which was enough for buyers. Now, the focus shifts to Nvidia’s (NVDA) earnings on August 27, arguably the most important event of the quarter.
🔹 Technical Outlook
The price has stabilized below 6,468, which signals potential downside toward 6,425.
A clean break below 6,425 would confirm continuation of the bearish move toward 6,389.
Conversely, a 4H candle close above 6,468 would shift momentum back to the upside, opening the path to 6,528 and a possible new ATH.
🔹 Key Levels
Support: 6,425 – 6,389
Resistance: 6,486 – 6,528
✅ Summary:
The market is consolidating under the pivot. Watch for a decisive 4H close to confirm the next leg — either a downside extension or a breakout to fresh highs.

