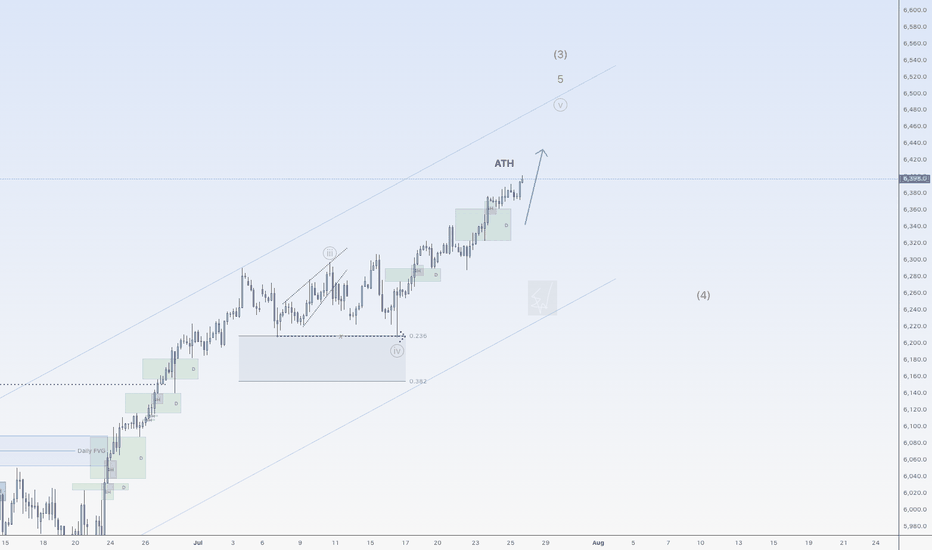
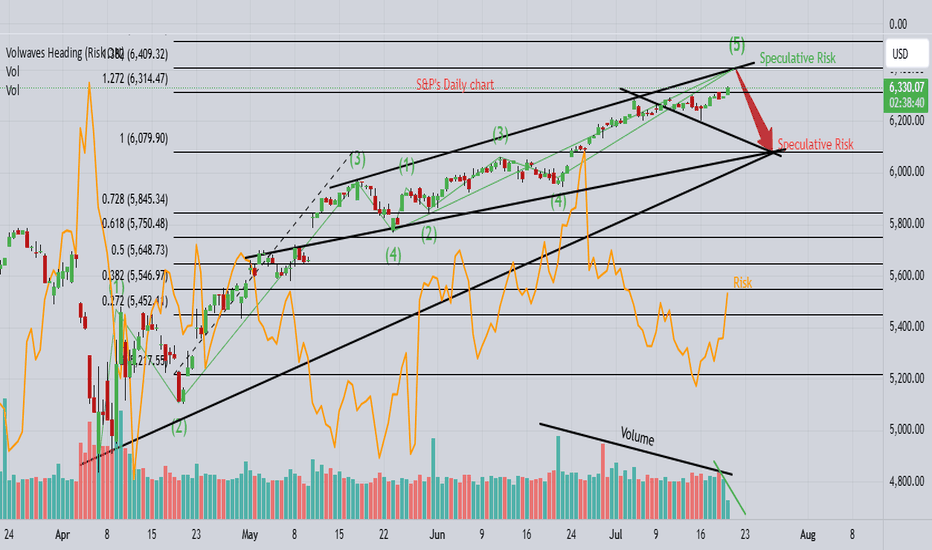
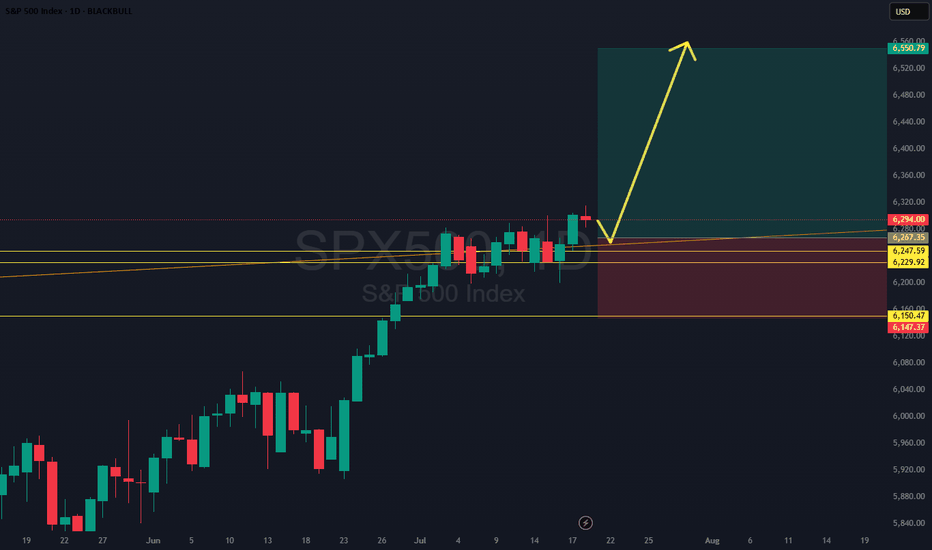
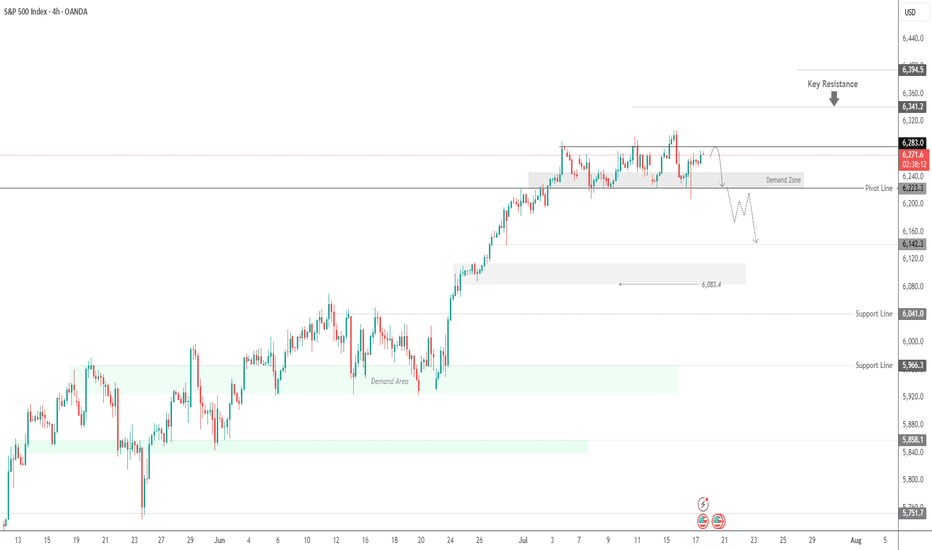
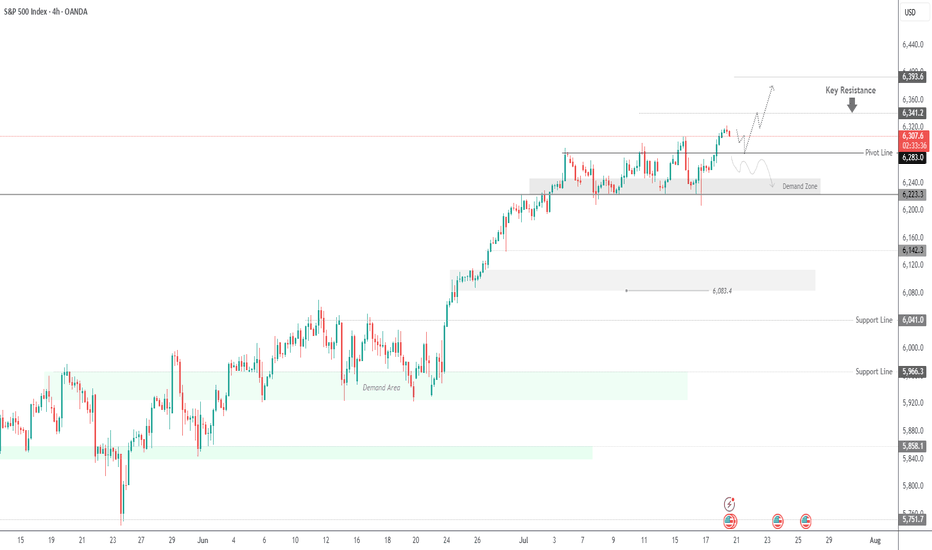
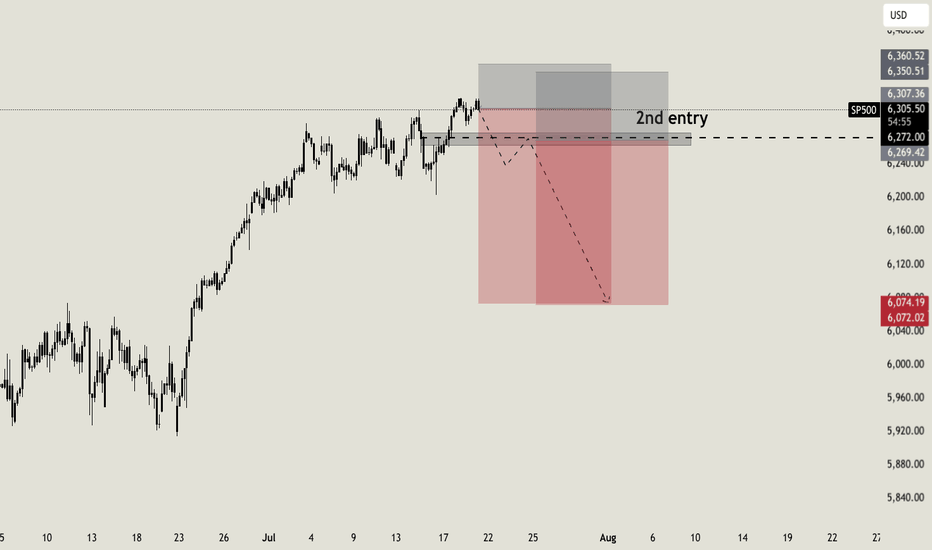
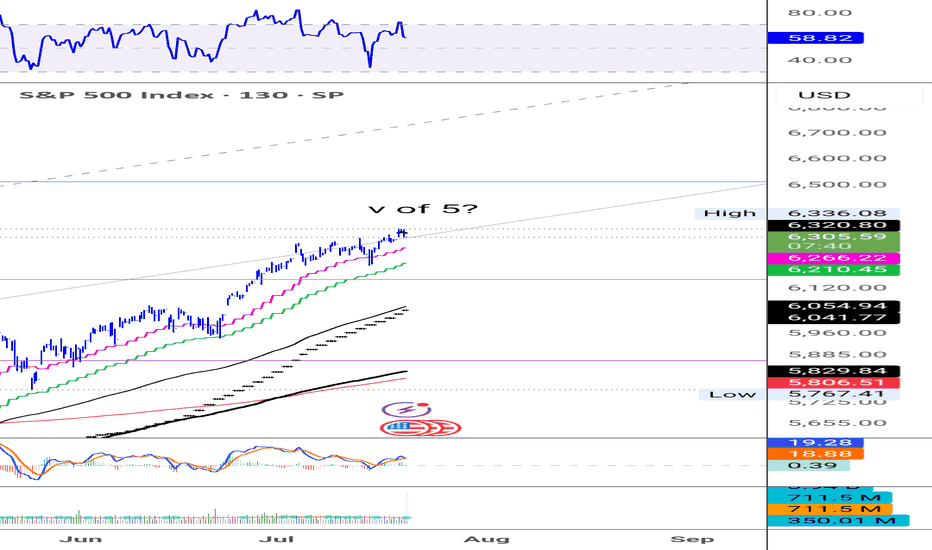
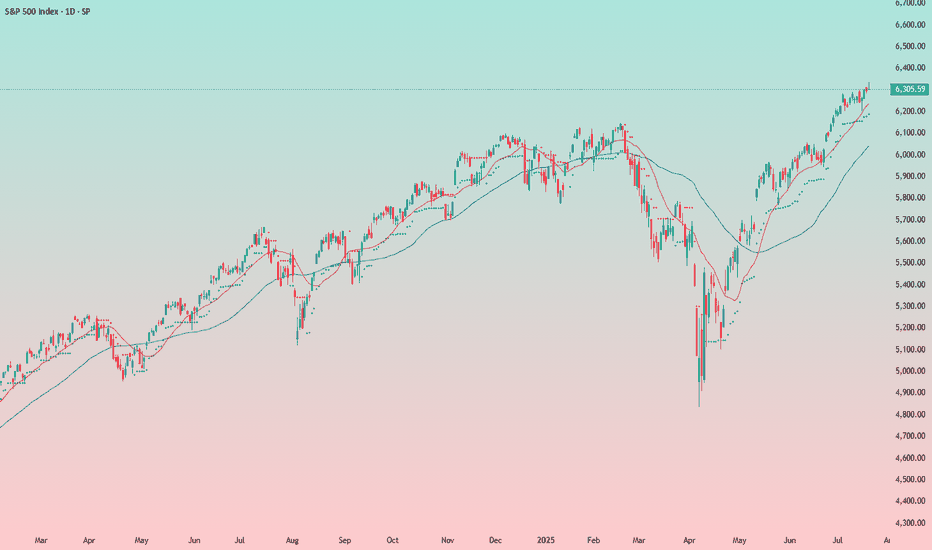
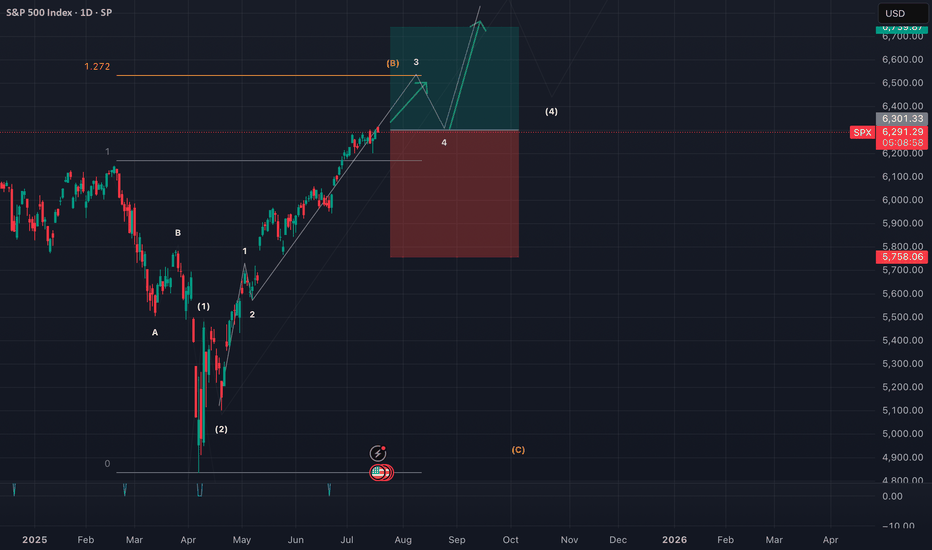
Recession? Weak. Let's Do a DepressionS&P pulled a fast one — but the real show might be just warming up.
Markets tease, bounce, tempt. And then — they punish.
After a sharp rebound, S&P500 is still below 6,150, with weak volumes. The recent rally looks more like a bear trap than a new impulse.
Trading note:
Possible short entries can be considered from current levels, with 50% now, 25% near 6,000, and 25% at 6,100. Stop-loss only after 4H close above 6,150. No clean levels below that — only noise and traps.
This market isn't about fundamentals. It's about desperation. Participants are chasing returns in a shrinking pie, taking on absurd risks.
And now, buckle up:
We are entering what might be the most dramatic market weeks in decades. This is setting up to be a mega-short, folks. Get ready for turbulence. Fasten your seatbelts.
---
Important:
This is NOT a recommendation to trade. This is an extremely high-risk scenario shared for discussion purposes only. If you've already made such a mistake and entered, respect your money and risk management. Losses are much harder to recover than gains.
US500 trade ideas
US500 bearish 12 May - 16 May 2025S&P 500 Bearish Outlook: Targeting $5,100 Amid Rising Uncertainty
As of May 12, 2025, the S&P 500 (US500) stands at 5,661, reflecting a robust recovery from its April lows. However, I anticipate a bearish shift, projecting a decline towards the $5,100 level in the near term. Several converging factors underpin this outlook:
1. Anticipated Weakness in Core CPI Data
The upcoming release of the April Core Consumer Price Index (CPI) on May 13 is poised to be a pivotal event. While the year-over-year Core CPI is forecasted at 2.8%, matching the previous month's figure, the month-over-month increase is expected to rise to 0.3%, up from 0.1% in March. This acceleration suggests persistent inflationary pressures, potentially prompting the Federal Reserve to maintain or even tighten monetary policy, thereby exerting downward pressure on equities.
2. Deteriorating Market Sentiment and Forecasts
A notable shift in market sentiment is evident, with key indicators turning bearish. A prominent S&P 500 model has signaled its first bearish outlook since February 2022, reflecting growing investor apprehension. Additionally, leading financial institutions have revised their S&P 500 targets downward:
Goldman Sachs: Reduced from 6,500 to 5,700
RBC Capital Markets: Lowered from 6,600 to 5,500
Oppenheimer: Cut from 7,100 to 5,950
Yardeni Research: Adjusted from 7,000 to 6,000
These revisions underscore the mounting concerns over economic headwinds and market volatility.
3. Sectoral Divergence: Opportunities Amidst the Downturn
While the broader market faces challenges, certain sectors may exhibit resilience or even bullish tendencies:
Healthcare: Continues to serve as a defensive sector, with companies demonstrating solid quarterly results and reaffirming full-year guidance despite tariff impacts.
Energy Infrastructure: Firms like Enbridge and TC Energy benefit from long-term structural tailwinds, including rising energy demand and global energy security priorities.
Financials and Technology: Sectors represented by ETFs such as XLK and XLF are highlighted for their strong fundamentals and growth prospects.
Conversely, consumer discretionary sectors are showing signs of strain, with negative revenue surprises and companies like Harley-Davidson withdrawing their 2025 outlooks amid tariff uncertainties.
4. Implications of the US-UK Trade Deal
Recent developments in the US-UK trade agreement further contribute to market uncertainty. While the deal includes exemptions for certain British goods, such as aerospace components and a quota of 100,000 UK-made cars annually, it also maintains a baseline 10% tariff on foreign goods. This policy introduces complexity and potential cost pressures for multinational companies operating across borders.
Moreover, the agreement has faced criticism for being one-sided, with concerns that it may not adequately protect domestic industries or address broader trade imbalances. Such apprehensions can dampen investor confidence and contribute to market volatility.
The convergence of persistent inflation, cautious monetary policy, revised market forecasts, and the complexities introduced by recent trade agreements suggest a bearish trajectory for the S&P 500, with a potential decline towards $5,100. Investors should remain vigilant, monitoring sector-specific developments and macroeconomic indicators to navigate the evolving market landscape.
Disclaimer: This analysis is for informational purposes only and does not constitute investment advice. Always conduct your own research before making investment decisions.
S&P500 Stuck between the 1D MA50 and 1D MA200.The S&P500 index (SPX) is now on a short-term correction following the impressive recovery of the last 30 days that made it almost test its 1D MA200 (orange trend-line). This is a technical rejection but the fact that the 1D MA50 (blue trend-line) is now the Support can be encouraging.
The reason is that since January 2023, every time the index broke above its 1D MA50 it turned into a Support that held and produced an immediate bullish extension on every occasion except for one time (Sep 2024), which still recovered 1 week after.
As a result, it is more likely for SPX to test its All Time High (ATH) by July than entering a long-term correction again.
-------------------------------------------------------------------------------
** Please LIKE 👍, FOLLOW ✅, SHARE 🙌 and COMMENT ✍ if you enjoy this idea! Also share your ideas and charts in the comments section below! This is best way to keep it relevant, support us, keep the content here free and allow the idea to reach as many people as possible. **
-------------------------------------------------------------------------------
Disclosure: I am part of Trade Nation's Influencer program and receive a monthly fee for using their TradingView charts in my analysis.
💸💸💸💸💸💸
👇 👇 👇 👇 👇 👇
Hellena | SPX500 (4H): LONG to resistance area of 5682.Colleagues, I think that the deep downward movement is over and at the moment I expect an upward movement in a five-wave impulse. At the moment I expect a correction in wave “2” to the area of 5100, after which I expect the development of wave “3” at least to the resistance area of 5682.
There are two possible ways to enter the position:
1) Market entry
2) Pending Limit Orders.
Manage your capital correctly and competently! Only enter trades based on reliable patterns!
SNP500/EquitiesThe current macroeconomic backdrop, shaped by the Federal Reserve’s decision to hold interest rates steady at 4.25%–4.50%, highlights growing concerns over economic risks, particularly stemming from trade tensions and inflationary pressures triggered by tariffs. Despite a strong April jobs report, the Fed is signaling increased caution, warning that the risks of both higher inflation and higher unemployment have risen. Treasury yields are reflecting this shift in sentiment, with the 2-year yield falling to 3.76% and the 10-year yield at 4.29%, suggesting that markets are beginning to price in a slower growth environment and potential future rate cuts.
In this environment, real estate investments are proving resilient. The Real Estate Select Sector SPDR Fund (XLRE) is up +3.14% year-to-date, outperforming broader equity indices such as the S&P 500 (SPX), down –4.69%, and the Nasdaq 100 (NDX), down –6.19%. Real estate typically benefits from a stable or declining interest rate environment, as lower yields reduce the discount rate applied to property cash flows and enhance the appeal of steady income-generating assets like REITs. Additionally, real estate assets—especially in sectors like multi-family housing and industrial logistics—can provide some inflation protection through lease repricing and consistent demand.
By contrast, the broader equity markets are showing signs of strain. The S&P 500 and Nasdaq have delivered negative returns year-to-date, reflecting investor unease around earnings growth, margin pressures from tariffs, and general macroeconomic uncertainty. Defensive equity sectors are faring better—Financials (XLF) are up +2.75%, and Consumer Staples and Health Care are showing modest gains. Technology and cyclical sectors such as Materials (XLB –0.39%) and Energy (XLE –0.30%) are underperforming, indicating a rotation into safer assets. The VIX (Volatility Index) at 24.72 confirms heightened risk aversion among investors.
Given this backdrop, a prudent portfolio strategy for the next three to six months would prioritize capital preservation, income generation, and inflation protection. A recommended tactical allocation might include 30–35% in real estate, leveraging XLRE and potentially private REITs in stable segments. Allocating 25–30% to defensive equity sectors, such as financials and consumer staples, can provide exposure to more stable earnings. Exposure to high-beta sectors like technology should be limited to 10–15%, given continued volatility and valuation risks. Holding 20–25% in cash or short-term Treasuries provides flexibility, especially with yields still elevated, while a 5–10% allocation to alternatives such as gold (XAUUSD +28.90% YTD) or inflation-protected securities like TIPs adds a useful macro hedge.
Looking forward, real estate is likely to remain attractive if the Fed maintains a dovish tilt or initiates rate cuts later in the year. Sectors with strong fundamentals, such as housing and logistics, should continue to perform well. Equities, however, are expected to remain volatile, with upside capped unless trade uncertainty is resolved or corporate earnings show resilience. Investors should favor value-oriented, dividend-paying stocks with lower volatility. Meanwhile, the U.S. dollar may soften gradually as rate expectations fall and inflation hedges rise in importance, further supporting real asset classes.
SPX 500 Downtrend MovementGreetings Traders this is my analysis on SPX500 and it is Short
📊 Overview:
Current price: 5,901 (in the opening zone of the short position).
The analysis points to a short strategy — the author predicts a price decline with the opening of a position between 6.009 and 6.023, aiming for 5.394–5.392.
🟩 Zone of resistance (Resistance level):
Major resistance level: 6,153.39
Price has reacted at that level in the past and has previously been rejected, making it a strong psychological and technical barrier.
🟨 Entry and Expectation Zone:
Open Position zone: 6.009–6.023 (brown zone)
Expected reaction: short signal, if the price is likely to bounce off the resistance and head lower
"First Top" and "Breakout" formations are observed, which is often a sign of a subsequent decline
🔻 Anticipated correction:
Target zone: 5.394–5.392
It is the previous levels of consolidation and the possible target of a short position
An arrow is shown predicting a price drop from the current level
🔴 Support Zone (Support Level):
Main support: 5,091.52
If the price breaks through the target level, it can even go down to this support
🧠 Technical elements:
Elliott Wave marks the completion of the impulse and corrective phase, suggesting the end of the upward wave
Impulsive movement and a drop in price indicate the possibility that the current correction will end and the price will move downwards again
A possible support area has already been tested, but it may be active again
🧩 Conclusion:
Strategy: short entry at ~6,010–6,020
Stop loss should be above 6,153 (above strong resistance)
Target: 5,394 (possible continuation of downward trend)
The plan is based on price action analysis, waves and recognition of key zones
Dear Traders like,comment let me know what do you think?
The S&P 500 Is About to Drop — The Real Rally Comes in July!S&P 500 Market Outlook: Navigating the Path to a Bullish Breakout by June 2025
At Vital Direction, we are committed to delivering precise and forward-looking market analysis rooted in deep technical expertise. Our current evaluation of the S&P 500 indicates that the recent upward movement is not the beginning of a true bull market. Rather, it reflects a counter-trend rally that is approaching exhaustion. We firmly believe that the market is preparing for a significant decline in the short term, followed by a prolonged sideways consolidation, before initiating a genuine, powerful bull market in late June 2025.
Elliott Wave Analysis: A Classic Counter-Trend Structure
Our Elliott Wave analysis suggests that the S&P 500’s recent rally has been corrective in nature, comprised of only three waves — a classic hallmark of a counter-trend move. This pattern lacks the five-wave impulsive structure typically associated with sustainable bull markets. From our vantage point, this confirms that we remain in a larger corrective phase.
We anticipate that a sharp retracement is imminent, one that may unfold over the coming days and weeks, ultimately transitioning into a period of sideways price action until mid-to-late June 2025. Only thereafter do we foresee the conditions forming for a new all-time high and the emergence of a powerful bull leg.
Gann Theory Timing: Imminent Market Top
Our Gann timing model aligns precisely with this forecast. We have identified this week as a critical timing window for a potential top in the S&P 500. Once this pivot is confirmed, we expect the index to enter a steep downward phase. From a Gann perspective, this is a natural part of the market’s cyclical structure — a necessary clearing phase before the next long-term advance.
US Bond Yields: A Telling Risk-Off Signal
One of the most overlooked — yet crucial — factors supporting our bearish near-term view is the behaviour of US bond yields. Charts clearly show that bond yields are breaking out to new highs, a significant development that suggests institutional and “smart money” investors are positioning defensively. This is not a characteristic of a “risk-on” environment.
When yields rise, particularly amidst equity euphoria, it typically indicates that investors are seeking safety and yield rather than embracing equity risk. This divergence is a red flag that supports our conviction: the equity rally is unsustainable, and a meaningful correction is near.
Seasonality Supports the Retracement View
Historical seasonality trends for the S&P 500 further validate our analysis. Data indicates the following typical market behaviour:
Mid-May to Late May: Downtrend
Late May to Mid-June: Temporary uptrend
Mid-June to Late June: Another corrective phase
From Late June Onward: Start of the next major bullish cycle
This seasonal rhythm perfectly mirrors what we see technically: the market is preparing to reset before beginning a strong ascent in July 2025, building into a full-fledged bull market by late June.
The Broader Picture: Beyond US-China
While some market optimism has emerged on the back of renewed US-China tariff discussions, we caution against over-reliance on this narrative. The market appears to be ignoring the broader geopolitical context, including the absence of any clear tariff agreements between the US and Japan — another major global economic player.
The complexity of global trade negotiations introduces substantial uncertainty, which may continue to weigh on investor confidence. Until such macroeconomic factors are stabilised and digested by the market, we do not anticipate a truly risk-on environment.
The Road Ahead: A Strategic Pause Before Ascent
In conclusion, Vital Direction maintains its firm stance: the current market structure does not yet support the onset of a sustained bull market. A meaningful retracement is necessary and, indeed, healthy for the long-term health of the market. We expect this corrective period to unfold over the coming weeks and months, culminating in a sideways consolidation until late June 2025 — the point at which we foresee the S&P 500 transitioning into a highly bullish environment, with the potential to reach new all-time highs.
We will continue to monitor the technicals, macroeconomic developments, and global capital flows to provide our clients with the most accurate and actionable insights. The bull is coming — just not yet.
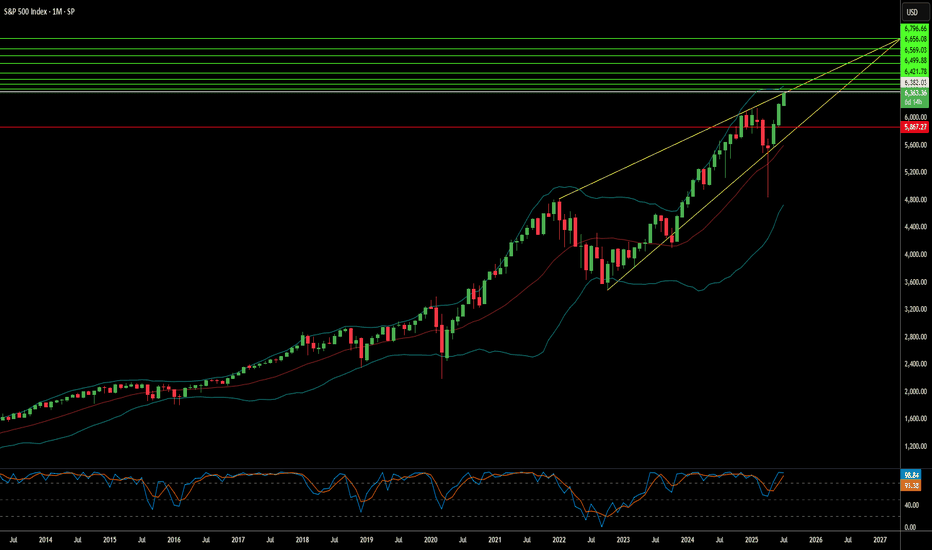
The final rally or the beginning of hyper-inflation? This is an ascending wedge, (65% chance of a break to the downside statistically,) that the S&P500 has been trading in for it's entire life cycle. All historical data points to a final topping process as market makers head back for the top trend to liquidate short positions that took positions on the last plunge.
The former sell-off showed no signs of big money taking full exit from the market as it was quite gradual; allowing short positions to stack at back tests of key resistance areas. Therefore, it stands to reason that the oversold daily RSI was going to allow for a powerful bounce to catch shorts off guard. The market will not sell off largely until shorts have capitulated as exchanges and banks load up for a final rally to completely remove those positions and sell new highs. when this happens, there will be no gradual dump but, instead, a red waterfall with news about hyperbolic, impending disasters coming out after the largest institutions push the sell button.
Breaking that top trend on the 3 month logarithmic chart would be a first in market history and denote hyper-inflation followed by the coming crash being even more violent then anyone believes is possible. It is a good time to start scaling out of the market little by little.
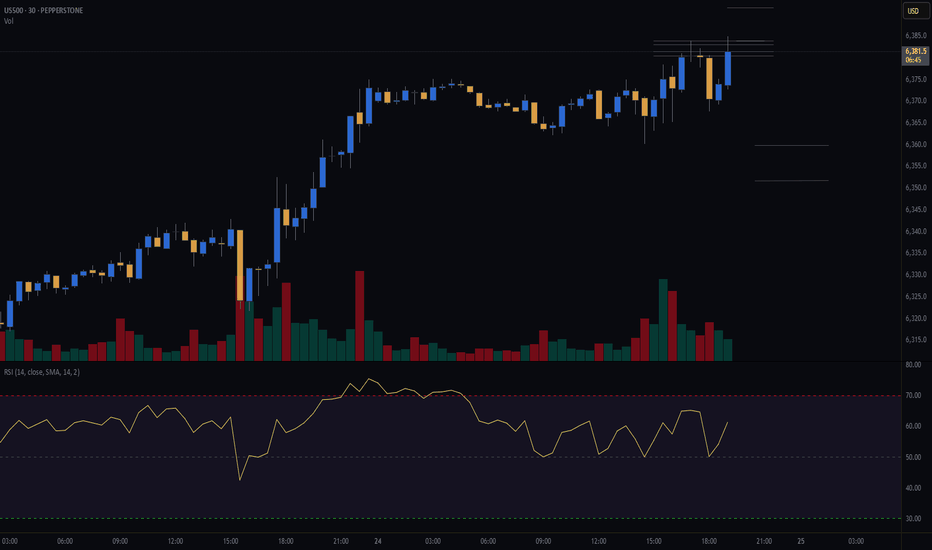
Bullish S&P500The S&P 500 is showing strong behavior again today, which suggests investors remain optimistic about the market's overall direction.
That said, the price is starting to look overextended from the 10 EMA and is now touching the Bollinger Bands. This usually signals that a pullback is likely, even if it's just a minor one to the 10 EMA. Of course, we can never predict exactly how the market will move—but when that pullback happens, it often brings better entry opportunities on individual stocks, helping us position ourselves more effectively.
As always, remember that trading carries risk. Be mindful with your entries and apply solid risk and money management to protect your capital and avoid being wiped out by unexpected market moves.
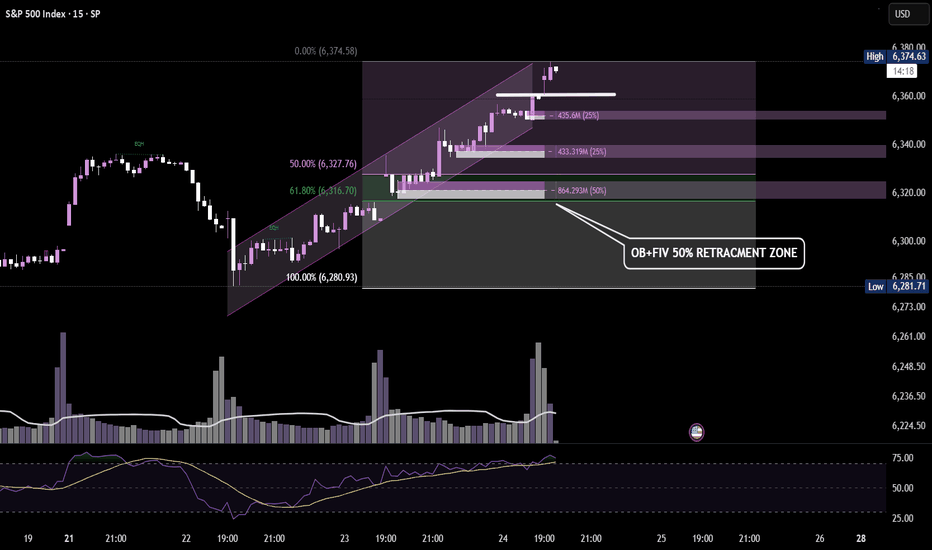
$SPX / $SPY - Decision point reached at resistanceWhilst SP:SPX is looking healthier above its MAs, it printed a swing failure pattern (SFP) on the daily into the prior support (now resistance zone) which aligns with a swing symmetry from the news swing in early April. Price is sitting on the 61.8 fib, and is also rejecting the 100 EMA.
If shorts want to take charge, this is the place to do it.
STOCKS | MARKET WATCH | Why Long-Term Investing Still Wins🤯 The start of 2025 was a bit of a rollercoaster for stocks.
Global markets got seriously rattled in the first few months by some sudden jitters. When President Trump announced those aggressive tariffs, it caused significant concern among investors, sending stock markets tumbling and prompting a flight to safety. Like Reuters said, April was "epic" for crazy market swings – the VIX fear index shot up to levels we hadn't seen since 2020 and 2008, and then just as quickly dropped back down. Markets went wild.
But then, by late April, the panic kind of ... disappeared. Once President Trump paused the implementation of the most severe tariffs, stocks bounced back pretty sharply. The S&P 500 recovered most of what it lost. After that nasty drop, it ended April only about 5% lower than it started the year. The Nasdaq, with all its tech stocks, pretty much ended the month where it began. So, after all that drama, major US stock markets weren't far from their all-time highs, showing how fast that "fear" can vanish.
📊 How key indexes did
S&P 500 (USA): 📉 Dipped in early April but bounced back late. Ended April around -5% for the year, after almost hitting a bear market.
Nasdaq Composite (USA): 📉 Similar story. Tanked on the tariff scare, then rallied when things calmed down, ending April pretty much flat for the year.
MSCI World (Global developed markets): 🤷♂️ Had its ups and downs along with the US markets. By the end of April, it was pretty much flat for the year – no big moves for the overall world index.
MSCI Emerging Markets: 📉 Didn't do as well as developed markets. Asian stocks, especially, took a hit early April because of trade war worries, so this index lagged, even though it recovered a bit by the end of the month.
FTSE/JSE All-Share (South Africa): 🇿🇦 The odd one out! The JSE jumped about +5% in the first three months of 2025, mainly thanks to mining stocks. It even hit a record high in March. The April craziness shook it up too, but because it did so well earlier, it was still slightly up for the year by late April.
Takeaway? Global stocks were jumpy, but they mostly recovered. By late April, most major indexes were close to where they started the year. South Africa's market was the exception, having a good first quarter that helped it weather the April storm.
⏳ Staying invested beats trying to be a stock Wizard
All this back and forth can make investors nervous. You start thinking, "Should I just sell now before it drops even more?" But history usually says that's the wrong move. Just sticking with it usually works out better than trying to guess the market's next move. BlackRock's iShares recently pointed out that "waiting for the 'right time' to invest might mean missing out on the best days," while staying invested lets you benefit from that "compounding" thing and get through the short-term bumps. Simply put, if you sit on the sidelines during big swings, you often miss the big rebound days. One study even showed that if you missed just the five best market days over 20 years, you'd end up with way less money than someone who just stayed in the market.
The legendary investor Charlie Munger put it simply: "The first rule of compounding: never interrupt it unnecessarily." Trying to jump in and out of the market around all the volatility is super tough – the biggest up days often follow right after the biggest down days. On the other hand, patient investors who just ride out the noise tend to grab more of those long-term gains. After all, with compounding, those small gains build on each other over time.
💰 The awesome power of compounding over time
Compounding basically means the sooner you invest and the longer you stay invested, the more your returns build on each other like a snowball rolling downhill. For example, the total return JSE All-Share index was up almost 23% over the last year. That kind of gain shows how just staying invested during good times can really grow your wealth. If you'd panicked and pulled out, you would have missed most of that growth. Over longer periods, like 5 to 10 years, the JSE has almost always gone up. The big lesson is that it's about "time in the market," not trying to "time the market," that really makes your returns grow and smooths out those bumps along the way.
🌍 What's driving the markets and the economy
There were a few big things happening that explain why the markets moved the way they did.
🇺🇸 US GDP Slowdown: The US economy actually shrank a bit in the first quarter of 2025. A lot of people blamed this on a big surge in imports as businesses bought stuff ahead of those potential President Trump tariffs. Even though this news spooked the stock market briefly in late April, underlying consumer spending was still looking pretty decent.
📈 US Company Profits: On the bright side, US companies reported some pretty strong profits. Analysts were expecting good growth in earnings for the S&P 500 in the first quarter, even with the economic slowdown. And it turned out even better – a lot of companies beat expectations, and overall earnings were up quite a bit from last year. This helped keep stock prices from falling too much during the pullbacks.
🇪🇺 European Spending Boost: In Europe, governments are starting to spend more. Germany, for example, proposed a huge fund for infrastructure and energy. The EU is also loosening its spending rules and increasing defense budgets. Some experts think this could actually boost Europe's economic growth a bit each year, which would mean better profits for European companies. Some even think European companies might see faster profit growth than US companies in the next few years because of this spending.
🇨🇳 Asia and Trade Wars: Asia was the weak spot. China's economy showed some signs of trouble, with a survey suggesting its manufacturing activity might have shrunk in April after a couple of months of growth. This seemed to be a direct result of the US tariffs. Asian stock markets took a hit on the tariff news, which dragged down the overall emerging markets index. Basically, tariffs and trade tensions hurt growth in Asia and its markets, which then affected returns in emerging markets globally.
✅ The bottom line
Early 2025 reminded us that markets can freak out quickly – but they can often bounce back just as fast. The swings felt scary, but history tells us that just sticking with your investments usually pays off. Major stock markets are pretty much where they were a few months ago, while economies and company earnings are still moving forward. For long-term investors, that wild week in April just reinforced an old lesson: stay invested and let compounding do its thing. As some experts say, "get invested and stay invested" because the most volatile times often have the biggest market gains. By sticking to your plan, you avoid missing those big up days when the "fear" fades and markets recover.
_________________________
SP:SPX
Sources: Recent market reports and data including the April SATRIX 2025 market newsletter “Once Again, Volatility Blinked and Fear Lost., nasdaq.com, reuters.com, ishares.com, insight.factset.com, reuters.com, iol.co.za
Quick preview 5-13The Market is still 50+ points from the Bollinger Band, now that it's moved up. However, we're in a channel and a breakdown of the channel may be significant. Trend is still up and the bias is as well. If we are to break below the 200 ma and the 18 weekly, bears would have to step in very soon. Otherwise we will continue to push up.
Down for SPX500USDHi traders,
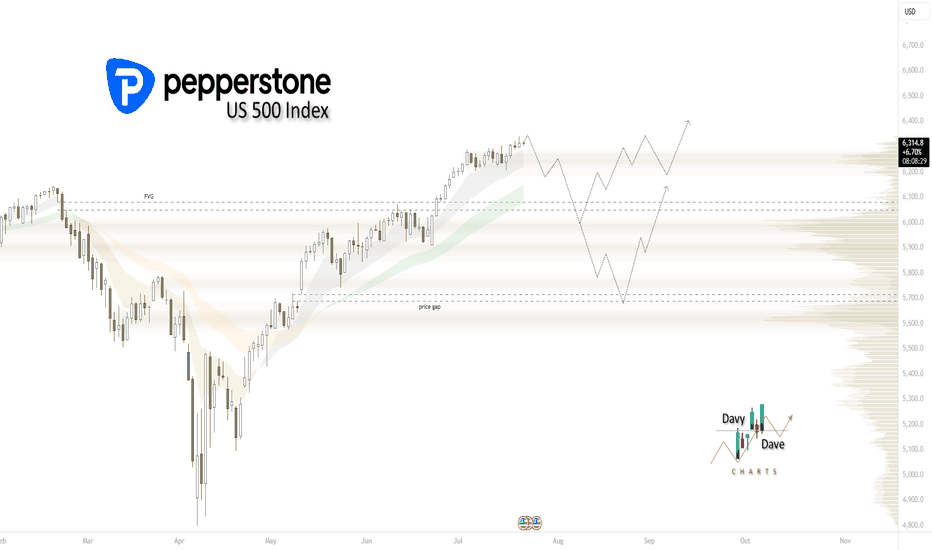
Last week SPX500USD did not close below the Daily FVG and broke the Weekly FVG. Now the trend has changed to bullish but price is moving very slow. This could indicate a leading diagonal (wave 1).
So next week we could see a (corrective) move down from the Daily FVG above.
Let's see what the market does and react.
Trade idea: Wait for price come into the Daily FVG above and a change in orderflow to bearish, a small impulse wave down and a small correction up on a lower timeframe to trade (short term) shorts.
If you want to learn more about trading FVG's & liquidity sweeps with Wave analysis, then please make sure to follow me.
This shared post is only my point of view on what could be the next move in this pair based on my technical analysis.
Don't be emotional, just trade your plan!
Eduwave
SPX: trade should not be a weaponPositive sentiment continued on the US equity markets during the previous week, after stronger than expected US jobs data. The Non-farm payrolls posted on Friday reached 177K in April, which was significantly above the 130K expected by the market. The market estimate was significantly lower from March data, as analysts were expecting to see a spill over effect of the imposed trade tariffs. As the jobs market seems still quite strong, the positive market sentiment was intact during the week. However, the recession fears are still holding among investors. The S&P 500 continued its 9-days winning streak, ending the week at the level of 5.686.
On a positive side was the news that Chinese authorities are considering starting negotiations with the US Administration regarding trade tariffs. This was another positive boost for investors' sentiment. Berkshire Hathaway was holding shareholders annual meeting on Saturday, where the most attention of both media and investors was on the speech of its founder and famous investor, Warren Buffet. In his address to the shareholders, Buffet strongly criticized the trade tariffs, noting “Trade tariffs are an act of war … trade should not be a weapon’.
For the moment, it could be expected that the positive sentiment might continue also in the future period. However, the FOMC meeting and Fed rate decision is scheduled for Wednesday, May 7th. This could be a day of higher volatility, as Fed Chair Powell will address the public at the press conference after the meeting. The markets will closely watch what he has to say regarding the current state of the US economy and potential rate cuts during the course of this year.
SPX500 local top at 5700? Serious retrace could hit 5500SPX back to its "Liberation Day" highs and possible end of local wave.
Local 4.236 fib at 5700.72 may have marked end of this wave up.
Dip targets include the various green fibs but major target 5505.42
Green Zone below is a MUST HOLD or we return to Bear Markets.
.
===================
Previous Charts below
==================
Major TOP call:
Liberation Day top call:
Tariff Relief road map:
================================================================
.
Market has shifted to a lower rising channel. Correction dueI believe the market has discounted the tariff effect and now shifted to a lower channel.
If that is the case, then a normal correction of 5% is imminent, as it encounters multiple resistance trendlines. The inflation (CPI) numbers on 13 May could be a catalyst
Moment of Truth for the S&P and Overall MarketsSeeing quite a significant Head and Shoulders pattern form now.
We've had a strong rally back up after the plunge.
Now we are testing the 50d SMA.
If we can't hold above this, things could get really bad.
If this Head and Shoulders sees follow through to the downside, we could be seeing a very significant bear market over the next year or so.
Critical point here!!!