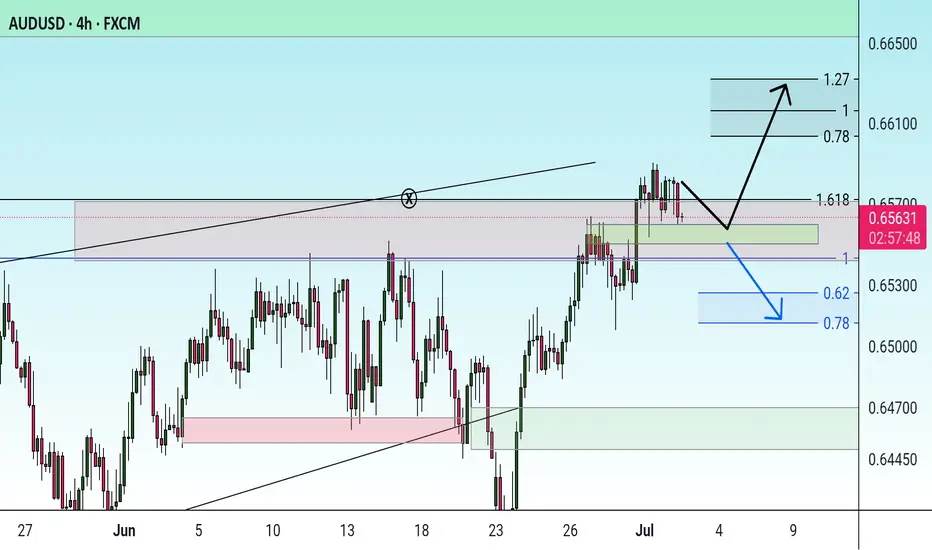
AUDUSD is BullishPrice was in a downtrend, however after the formation of a double bottom a higher high is printed which is an indication of the beginning of a bullish trend. Once the freshly printed higher high is broken we can expect continuation of the bullish trend as per Dow theory. Targets are mentioned on the chart.
USDAUD trade ideas

Buy AUDI see a W on weekly pivot at the 1H chart
price in 1D seems in up trend and RR is good. lets see

AUDUSD1 Hour chart: Price made a bearish impulse and it broke out of a recent structure level, price is currently testing the broken structure and it's forming a bearish correction.

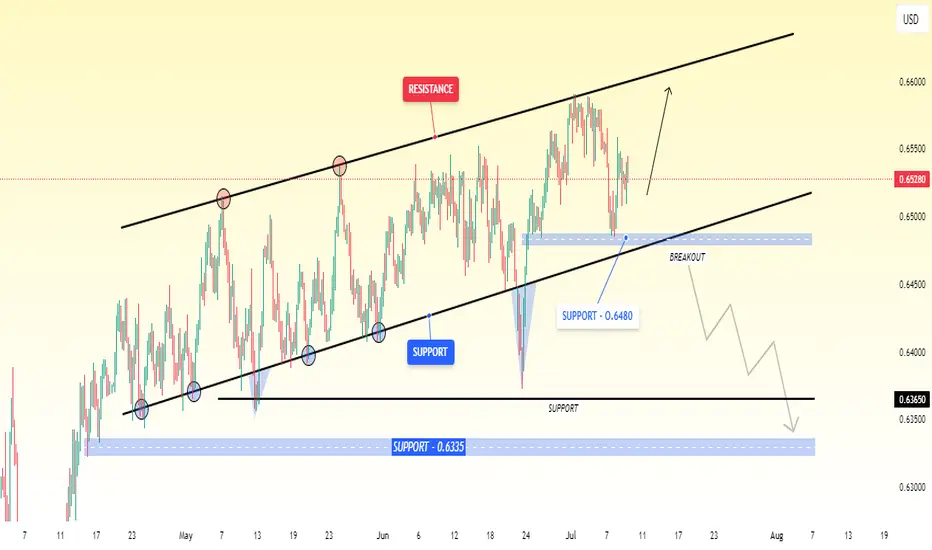
AUD/USD Maintains Upward Momentum Within Rising ChannelThe AUD/USD currency pair is currently moving within an rising channel and appears to be heading toward the upper resistance line of the trend.
However, if the price breaks below the first support level at 0.6480, it may signal a reversal, and the pair could start to decline. In that case, the next key support levels where the price might find buying interest or stabilize are around 0.6365 and 0.6335.
AUDUSD STARTED FORMING BEARISH TREND STRUCTUREThe AUD/USD pair has recently begun forming a bearish trend structure, signaling a potential continuation of downward momentum in the coming trading sessions. This shift in market sentiment is evident as the price has started printing lower lows, a key characteristic of a bearish trend. Lower lows indicate that sellers are gaining control, pushing the exchange rate downward with each successive decline. Traders and investors should remain cautious, as this pattern suggests further downside potential unless a significant reversal occurs.
On the lower side, the market is expected to test key support levels at 0.64500 and 0.63800. These levels may act as critical zones where buyers could attempt to step in, but if selling pressure persists, a breakdown could lead to an extended decline. A breach below these supports may open the door for deeper losses, reinforcing the bearish outlook. Conversely, if the pair finds stability near these levels, a short-term bounce or consolidation could occur before the next directional move.
On the upside, 0.65900 stands as a crucial resistance level. Any bullish retracement towards this zone could attract fresh selling interest, capping upward movements. A sustained break above this resistance would be necessary to invalidate the current bearish structure, potentially shifting the trend towards neutrality or even bullish reversal. Until then, rallies towards this resistance may present selling opportunities for traders aligning with the prevailing downtrend.
In summary, the AUD/USD pair is exhibiting bearish tendencies, with lower lows confirming seller dominance. The immediate targets lie at 0.64500 and 0.63800, while 0.65900 serves as a key resistance to watch. Traders should monitor price action around these levels for potential bearish continuation or signs of a trend reversal. Risk management remains essential, as unexpected macroeconomic developments or shifts in market sentiment could alter the current trajectory.

aud/usdThe Australian Dollar and the US Dollar pair belong the Majors, a group of the most popular traded pairs in the world. This pair's popularity soared because traders were attracted to the interest rate differential of the pair. This has waned in recent years due to economic volatility worldwide.

AUDUSD InsightHello to all our subscribers, and welcome!
Please share your personal thoughts in the comments. Don’t forget to like and subscribe.
Key Points
- U.S. President Donald Trump stated ahead of a cabinet meeting at the White House that he will announce tariffs on semiconductors, pharmaceuticals, and several other items, adding that pharmaceuticals could face tariffs of up to 200%.
- The European Union has not yet received a formal tariff notice from Trump. However, it is reportedly considering a possible agreement to maintain a base tariff rate of 10%.
- Michele Bullock, Governor of the Reserve Bank of Australia, remarked, “I don’t think inflation is sustainably low—I actually believe it is still higher.”
Key Economic Events This Week
+ July 9: FOMC Meeting Minutes Release
+ July 10: Germany June CPI
+ July 11: U.K. May GDP
AUDUSD Chart Analysis
The recent uptrend has temporarily paused around the 0.66000 level. However, the pair is expected to resume its upward momentum in the 0.64700–0.65000 zone. Once the bullish trend resumes, it is likely to rise smoothly toward the 0.67000 level, although minor resistance is expected at 0.67000, which could trigger a short-term pullback. In the longer term, the pair is still projected to rise toward the 0.69000 level.

AUD/USD ORB LONGAUSSIE TRADER
Based on yesterdays price action, we are targeting yesterdays RBA news High
1-3 RR
Don't risk your rent money on these trades, it aint worth it!

Aussie H4 | Pullback support at 61.8% Fibonacci retracementThe Aussie (AUD/USD) is falling towards a pullback support and could potentially bounce off this level to climb higher.
Buy entry is at 0.6514 which is a pullback support that aligns with the 61.8% Fibonacci retracement.
Stop loss is at 0.6475 which is a level that lies underneath an overlap support and the 50% Fibonacci retracement.
Take profit is at 0.6586 which is a multi-swing-high resistance.
High Risk Investment Warning
Trading Forex/CFDs on margin carries a high level of risk and may not be suitable for all investors. Leverage can work against you.
Stratos Markets Limited (tradu.com ):
CFDs are complex instruments and come with a high risk of losing money rapidly due to leverage. 63% of retail investor accounts lose money when trading CFDs with this provider. You should consider whether you understand how CFDs work and whether you can afford to take the high risk of losing your money.
Stratos Europe Ltd (tradu.com ):
CFDs are complex instruments and come with a high risk of losing money rapidly due to leverage. 63% of retail investor accounts lose money when trading CFDs with this provider. You should consider whether you understand how CFDs work and whether you can afford to take the high risk of losing your money.
Stratos Global LLC (tradu.com ):
Losses can exceed deposits.
Please be advised that the information presented on TradingView is provided to Tradu (‘Company’, ‘we’) by a third-party provider (‘TFA Global Pte Ltd’). Please be reminded that you are solely responsible for the trading decisions on your account. There is a very high degree of risk involved in trading. Any information and/or content is intended entirely for research, educational and informational purposes only and does not constitute investment or consultation advice or investment strategy. The information is not tailored to the investment needs of any specific person and therefore does not involve a consideration of any of the investment objectives, financial situation or needs of any viewer that may receive it. Kindly also note that past performance is not a reliable indicator of future results. Actual results may differ materially from those anticipated in forward-looking or past performance statements. We assume no liability as to the accuracy or completeness of any of the information and/or content provided herein and the Company cannot be held responsible for any omission, mistake nor for any loss or damage including without limitation to any loss of profit which may arise from reliance on any information supplied by TFA Global Pte Ltd.
The speaker(s) is neither an employee, agent nor representative of Tradu and is therefore acting independently. The opinions given are their own, constitute general market commentary, and do not constitute the opinion or advice of Tradu or any form of personal or investment advice. Tradu neither endorses nor guarantees offerings of third-party speakers, nor is Tradu responsible for the content, veracity or opinions of third-party speakers, presenters or participants.

UJ/AU/EU Pre trading/ Market analysisDaily pre-market analysis on AU, EU, and UJ breaking down structure, fundamentals, and key levels. Quick outlook before the session kicks off. Full recap coming later, trading or no trading.

#AUDUSD Searching for short#COMBINED FRACTAL THEORY WITH ALMAZOV + FIBO CHANEL MANDELBROT FRACTAL
GOLD TREND LINE BREAKOUT + FIBO ZONE FOR PULLBACK, THIRD WAVE PENDING
fibo spiral #ALMAZOV
Fibonacci projection with golden numbers, A. A. Almazov's course, the bearish trend cycle, reaching reversal levels, for Shorts
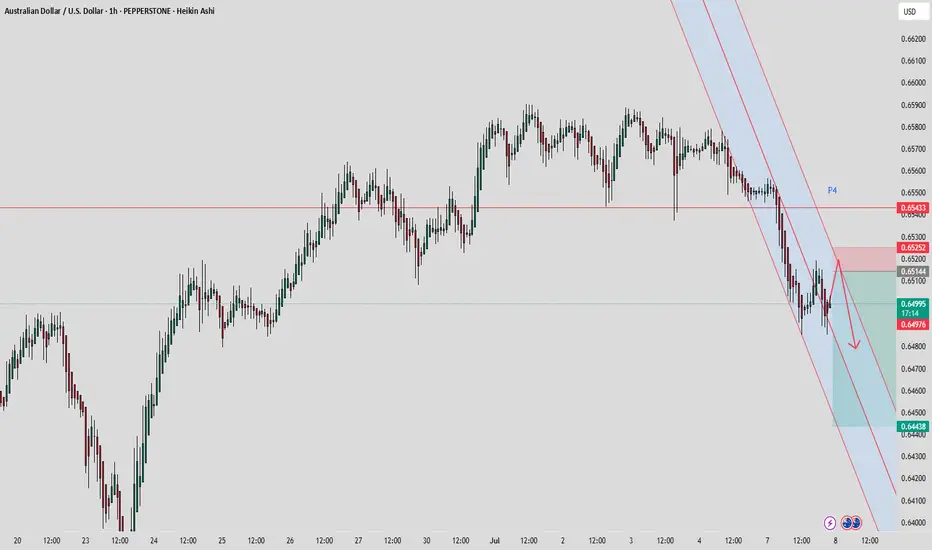
short setup on AUD/USD 🧠 Overall Context
W (Weekly): Bullish
D (Daily): Bearish
12H, 6H, 4H: Bearish
Bias: Short-term bearish retracement inside higher timeframe bullish structure.
🔍 Technical Breakdown
🔴 1. Market Structure
Price broke below a significant support zone (around 0.65300–0.65400), flipping it into resistance (now labeled Weekly AOI).
A bearish BOS (Break of Structure) has occurred on 4H.
Lower high formation is anticipated at the AOI (area of interest) around 0.65200–0.65400.
🔵 2. EMA Confluence
Price is now below the 50 EMA (blue) and testing the 200 EMA (red) as dynamic resistance/support.
The rejection near the 200 EMA (red) is forming consolidation, suggesting distribution before another leg down.
🟥 3. Supply Zone (Weekly AOI)
Clear supply zone rejection in red box: previous support → resistance flip.
The red rectangle represents a potential entry zone for a short, with SL above 0.65400.
🟩 4. Trade Setup
Entry: Rejection or mitigation at 0.65200–0.65400 zone (Weekly AOI).
SL: Just above the supply zone, around 0.65465.
TP: Near Daily AOI at 0.64500–0.64490, aligning with a strong demand zone from late June.
RR (Risk-Reward): Approximately 1:2 or better, depending on exact entry.
🔻 5. Projection Path
Bearish move expected after potential pullback.
Red arrow shows anticipated path: rally to Weekly AOI → rejection → continuation to Daily AOI → possible reaction at Weekly AOI below 0.6400 if sell pressure continues.
✅ Confluences for Short
HTF (4H, 6H, 12H) bearish structure.
Rejection at flipped Weekly AOI.
Bearish EMA alignment.
Clear BOS and lower-high formation.
Clean TP target at Daily AOI (logical liquidity pool).

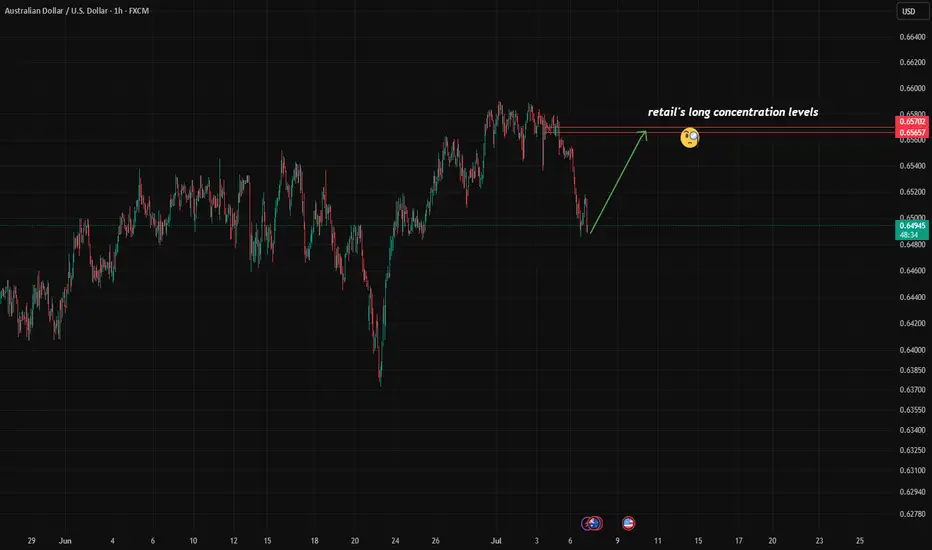
Contrarian Alert: Retail Is Buying, But Should You Sell?So far, there are no significant changes in the options flow suggesting a shift in sentiment or restructuring of previously established bullish positions. The market remains on watch, but interesting signals are coming from other sources.
According to the latest COT reports , institutional players continue to align with the current trend, reinforcing its stability.
However, retail positioning is starting to show signs of a potential reversal , with a noticeable increase in net-long positions and fresh buying activity over the past two days. This often indicates early countertrend interest.
The well-known contrarian principle — "do the opposite" — applies here, although it shouldn't be taken as an immediate signal to short.
For my part, I’ve identified the 0.6565–0.6570 zone as a key level where long positions are concentrated:
A rejection from this zone could offer a solid shorting opportunity.
A break above it would suggest the trend might resume higher.
By that point, updated options flow data and new positioning COT reports may provide further confirmation.
AUDUSD oversold rebound at 0.6465 ?Trend Overview:
The AUDUSD currency price remains in a bullish trend, characterised by higher highs and higher lows. The recent intraday price action is forming a continuation consolidation pattern, suggesting a potential pause before a renewed move higher.
Key Technical Levels:
Support: 0.6465 (primary pivot), followed by 0.6445 and 0.6400
Resistance: 0.6570 (initial), then 0.6590 and 0.6625
Technical Outlook:
A pullback to the 0.6465 level, which aligns with the previous consolidation zone, could act as a platform for renewed buying interest. A confirmed bounce from this support may trigger a continuation toward the next resistance levels at 0.6570, 0.6590, and ultimately 0.6625.
Conversely, a daily close below 0.6465 would suggest weakening bullish momentum. This scenario would shift the bias to bearish in the short term, potentially targeting 0.6445 and 0.6400 as downside levels.
Conclusion:
AUDUSD maintains a bullish structure while trading above the 0.6465 support. A bounce from this level would validate the consolidation as a continuation pattern, with upside potential toward the 0.6570 area. A breakdown below 0.6465, however, would invalidate this view and suggest deeper corrective risk.
This communication is for informational purposes only and should not be viewed as any form of recommendation as to a particular course of action or as investment advice. It is not intended as an offer or solicitation for the purchase or sale of any financial instrument or as an official confirmation of any transaction. Opinions, estimates and assumptions expressed herein are made as of the date of this communication and are subject to change without notice. This communication has been prepared based upon information, including market prices, data and other information, believed to be reliable; however, Trade Nation does not warrant its completeness or accuracy. All market prices and market data contained in or attached to this communication are indicative and subject to change without notice.

It wants to fall on its own!OANDA:AUDUSD
The price’s failure to break out of the channel with strong candles, along with a double top, signals that sellers are stepping in.
It’s time to enter — let’s go! 💥

Check the trend The correction is expected to progress to the specified support level. Then there is a possibility of a trend change and the start of an upward trend.

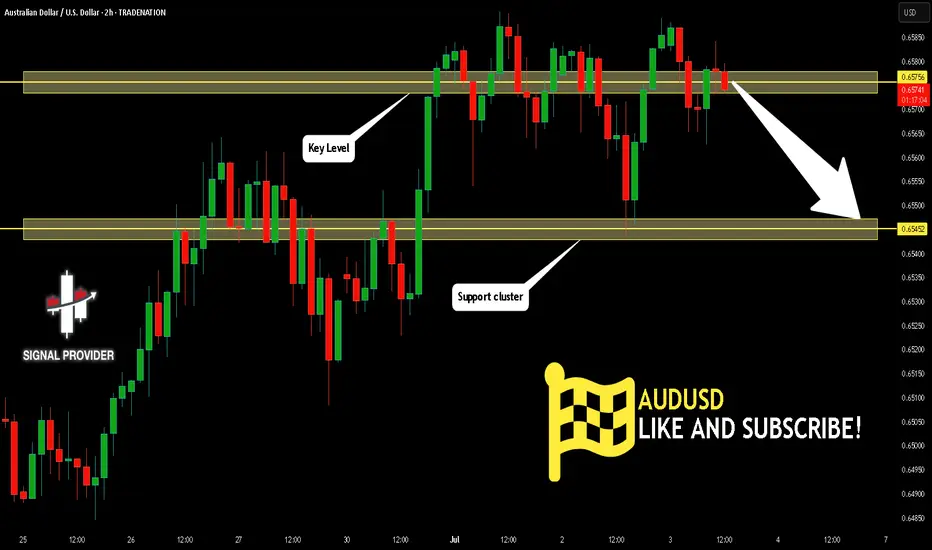
AUDUSD Is Very Bearish! Short!
Please, check our technical outlook for AUDUSD.
Time Frame: 2h
Current Trend: Bearish
Sentiment: Overbought (based on 7-period RSI)
Forecast: Bearish
The price is testing a key resistance 0.657.
Taking into consideration the current market trend & overbought RSI, chances will be high to see a bearish movement to the downside at least to 0.654 level.
P.S
Overbought describes a period of time where there has been a significant and consistent upward move in price over a period of time without much pullback.
Disclosure: I am part of Trade Nation's Influencer program and receive a monthly fee for using their TradingView charts in my analysis.
Like and subscribe and comment my ideas if you enjoy them!
AUDUSD SELL OPPORTUNITY Support breaken on HT for AUDUSD
Am waiting for a retest for me to sell
Entry: 0.65300
Stoploss: 0.65500
Take profit: 0.64500
Comment your opinion
For fund management contact me on X @shajudeakinoba1

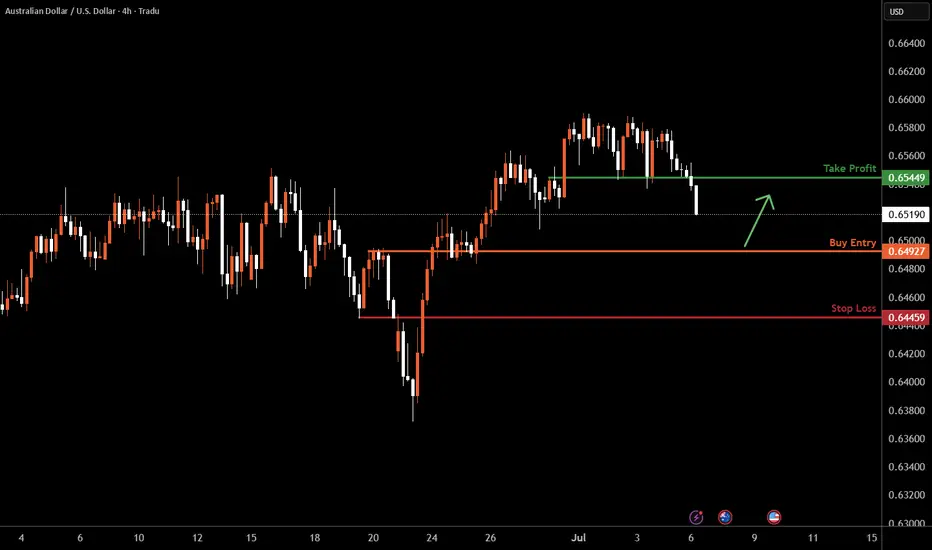
AUDUSD H4 I Bullish Bounce Based on the H4 chart analysis, the price is falling our buy entry level at 0.6492, a pullback support.
Our take profit is set at 0.6544, a pullback resistance.
The stop loss is placed at 0.6445, a pullback support.
High Risk Investment Warning
Trading Forex/CFDs on margin carries a high level of risk and may not be suitable for all investors. Leverage can work against you.
Stratos Markets Limited (tradu.com ):
CFDs are complex instruments and come with a high risk of losing money rapidly due to leverage. 63% of retail investor accounts lose money when trading CFDs with this provider. You should consider whether you understand how CFDs work and whether you can afford to take the high risk of losing your money.
Stratos Europe Ltd (tradu.com ):
CFDs are complex instruments and come with a high risk of losing money rapidly due to leverage. 63% of retail investor accounts lose money when trading CFDs with this provider. You should consider whether you understand how CFDs work and whether you can afford to take the high risk of losing your money.
Stratos Global LLC (tradu.com ):
Losses can exceed deposits.
Please be advised that the information presented on TradingView is provided to Tradu (‘Company’, ‘we’) by a third-party provider (‘TFA Global Pte Ltd’). Please be reminded that you are solely responsible for the trading decisions on your account. There is a very high degree of risk involved in trading. Any information and/or content is intended entirely for research, educational and informational purposes only and does not constitute investment or consultation advice or investment strategy. The information is not tailored to the investment needs of any specific person and therefore does not involve a consideration of any of the investment objectives, financial situation or needs of any viewer that may receive it. Kindly also note that past performance is not a reliable indicator of future results. Actual results may differ materially from those anticipated in forward-looking or past performance statements. We assume no liability as to the accuracy or completeness of any of the information and/or content provided herein and the Company cannot be held responsible for any omission, mistake nor for any loss or damage including without limitation to any loss of profit which may arise from reliance on any information supplied by TFA Global Pte Ltd.
The speaker(s) is neither an employee, agent nor representative of Tradu and is therefore acting independently. The opinions given are their own, constitute general market commentary, and do not constitute the opinion or advice of Tradu or any form of personal or investment advice. Tradu neither endorses nor guarantees offerings of third-party speakers, nor is Tradu responsible for the content, veracity or opinions of third-party speakers, presenters or participants.
Aud/Usd LongIf dollar remains weak aud should push up. Price is currently
trading at upper channel. Breakout from here suggests that
price could move higher, up to next bigger resistance around
0.67200 area. Wait for Unemployment Rate before taking any trades.
Rising moving averages and liquidity grab back in
end of june tells that price are in uptrend which can prolong.

AUDUSD TRADE IDEA AUDUSD seems to be lining up for us, for a trade to the upside.
Parameters have been set and we wait for a pullback to our Fibonacci level and then a continuation to the upside
Let's see what the market does, considering the US holidays tomorrow (4th July)

AUDUSD: Will Start Growing! Here is Why:
Looking at the chart of AUDUSD right now we are seeing some interesting price action on the lower timeframes. Thus a local move up seems to be quite likely.
Disclosure: I am part of Trade Nation's Influencer program and receive a monthly fee for using their TradingView charts in my analysis.
❤️ Please, support our work with like & comment! ❤️

Check the trend After some fluctuation and correction, the upward trend is expected to continue to the resistance levels. If the price breaks through the green support area, the downward trend to the specified support levels is possible.