AUDUSD will be on shorting by next week market. There is a break of structure and market structure shift to the upside whereby by next week an inducement will be formed, thus, leading to shorting of the market.
USDAUD trade ideas
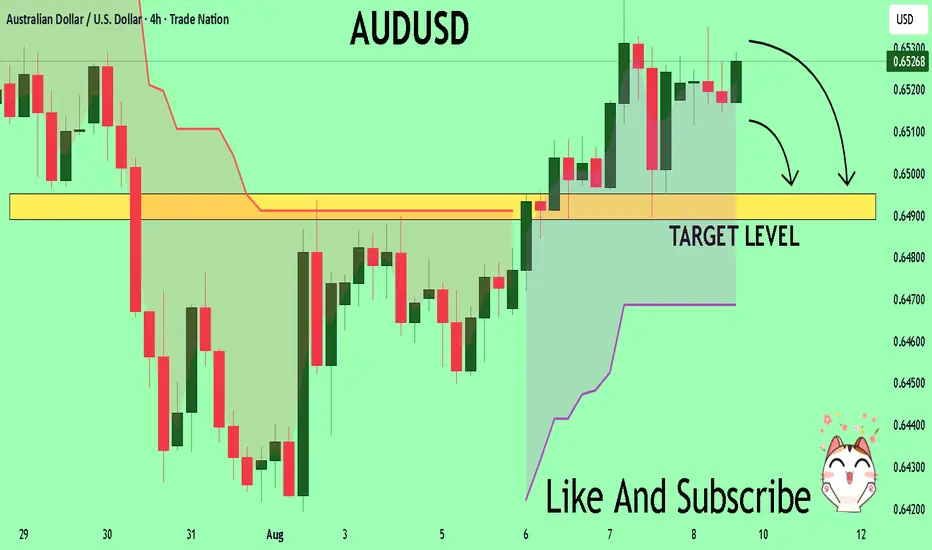
AUD/USD SHORT FROM RESISTANCE
Hello, Friends!
We are now examining the AUD/USD pair and we can see that the pair is going up locally while also being in a uptrend on the 1W TF. But there is also a powerful signal from the BB upper band being nearby, indicating that the pair is overbought so we can go short from the resistance line above and a target at 0.644 level.
Disclosure: I am part of Trade Nation's Influencer program and receive a monthly fee for using their TradingView charts in my analysis.
✅LIKE AND COMMENT MY IDEAS✅

AUDUSD What Next? SELL!
My dear followers,
This is my opinion on the AUDUSD next move:
The asset is approaching an important pivot point 0.6526
Bias - Bearish
Technical Indicators: Supper Trend generates a clear short signal while Pivot Point HL is currently determining the overall Bearish trend of the market.
Goal - 0.6495
About Used Indicators:
For more efficient signals, super-trend is used in combination with other indicators like Pivot Points.
Disclosure: I am part of Trade Nation's Influencer program and receive a monthly fee for using their TradingView charts in my analysis.
———————————
WISH YOU ALL LUCK
AUDUSD - at Resistance (W1)Again, technical analysis tells me that agains all the odds USD should start gaining, rather than loosing - what is widely expected.
This time Aussie - the price has got to the Technical Resistance a bit ahead of time, what made it to balance over the level for few weeks.
Now, when EUR got there too, Aussie may start to respect it al last.
The level of 0.6549 has been in indicated by FR 61.8 of the downward move initiated on Sept 30, 2024 and the upper band of the Regression Line (2 SD).
Yet, in W1 Aussie is basically in downtrend for many years, so the move should not be a surprise.
Just mu humble opinion.

AUDUSD SellLit cycle. Daily cycle. Reaction off POI. Price does inducement and timing correlates with session

short market outlook on AUDUSD todayfor todays AUDUSD market we can except to short the market after price break Asia low and retraces up to premium zone and getting CHOCH

AUDUSD Bullish Bias!
HI,Traders !
#AUDUSD is trading in a
Local uptrend and the
Pair made a retest of the
Horizontal support of 0.64796
And we are already seeing
A bullish rebound so we
Will be expecting a further
Bullish move up !
Comment and subscribe to help us grow !

AUDUSD – Plan Ready for Both ScenariosWe're patiently waiting for price to reach our key zone. If we get a valid sell signal, we’ll take the short.
But if the market breaks above this level with strength and gives us a clean pullback, we’re ready to go long.
No guessing. No hoping. Just reacting to what the market shows us.
📌 Discipline over prediction.

AUD/USD Pullback or Trap? Key Level in FocusPrice has slipped below the rising channel and is now pulling back to retest the breakdown area. This retest could decide the next move.
If buyers fail to step in here, and price gets rejected again, it may signal the start of a deeper correction. However, reclaiming the channel could flip the bias back to bullish.

AUDUSD Clear Short opportunityWe have been over extended on multiple oscillators. We are going to start layering sells at now and keep layering new sells every 1 to two candles. Keep risk light per candle. we are going to targe the VWAP for TP. We have pulled far enough away that we can expect a retest.

AUD bullish swing setupBull points
RSI div
Trend reversal
RRR 1:2
Manage your risk for longer holding

AUDUSD SWING: SHORT-TERM BEARISH OPPORTUNITY (TRICKY)Hi there,
I'd like to see AUDUSD trade lower after running multiple highs and lows and creating a MSS on the weekly chart.
Price is also currently trading in-between weekly support and resistance levels which could aid the trade play out. The only concern I have is that the current region price is playing at is quite choppy - hence, price might not move cleanly.
Anyways, watchout for my next post tomorrow.
Cheers,
Jabari

AUD/USD - Full in depth breakdown (MUST READ) 📉 AUD/USD Multi-Timeframe Sell Setup – High Confidence Reversal
Pair: AUD/USD
Timeframes: Weekly / Daily / 1H
Bias: Bearish
Entry Zone: Supply Zone around 0.6700 - 0.6730
Target Zones:
🔹 TP1: 0.6520 (Mid-Range)
🔹 TP2: 0.6360 (Channel Support)
🔹 TP3: 0.6250 (Long-Term Demand Zone)
🧠 Technical Breakdown:
🔸 WEEKLY TIMEFRAME
✅ Long-Term Bearish Channel
Price is respecting a clearly defined descending channel.
This week’s price action has reacted perfectly from the upper boundary of that channel – rejecting continuation of bullish moves.
✅ Major Supply Zone Reaction
The most recent rejection aligns with a historically respected weekly supply zone.
Volume was introduced here in the past, suggesting institutional presence and high sell interest.
🔸 DAILY TIMEFRAME
✅ Daily Market Structure Shift
A confirmed daily break of structure (D-BOS) shows the bullish wave has lost steam.
Most recent rally into Supply 2 has been rejected, forming a lower high within the macro downtrend.
✅ Volume Profile Confluence
Volume is heaviest below current price, suggesting there’s little interest or imbalance left to fill above.
Current price sits in a low volume node, often leading to quick rejections and sell-offs.
✅ Supply Zone + 71% Premium Level
Price has tapped into the 71% Fib retracement level, aligning perfectly with:
Prior supply zones
EMA resistance
Volume-based rejections
🔸 1H TIMEFRAME
✅ CHoCH & i-BOS Confirming Reversal
Clear Change of Character (CHoCH) followed by internal Break of Structure (i-BOS) confirms lower timeframe bearish intent.
Price is currently forming a retracement leg, likely to pull back into supply for another sell.
✅ Bearish Schematic Playing Out
Expecting minor bullish pullback to retest broken structure before continuation into deeper targets.
Clean distribution phase completing before markdown.
📌 Sell Plan:
Sell Zone: 0.6700 – 0.6730 (supply + 71%)
Stop Loss: Above supply zone / channel high
Take Profits:
TP1: 0.6520 (fair value gap zone)
TP2: 0.6360 (channel low)
TP3: 0.6250 (major demand)
⚠️ Risk Management
Enter on lower timeframe confirmation (1H / 15M engulfing or BOS)
Trail stops as each BOS forms
Maintain R:R ≥ 1:3 for higher timeframes
🗓️ Market Outlook:
AUD/USD is aligning across all major timeframes for a high-probability bearish continuation. With structure shifted, supply respected, and volume confirming rejection, sellers are in clear control.
🔔 Follow for more SMC-based setups, clean structure trades, and multi-timeframe confluence strategies.

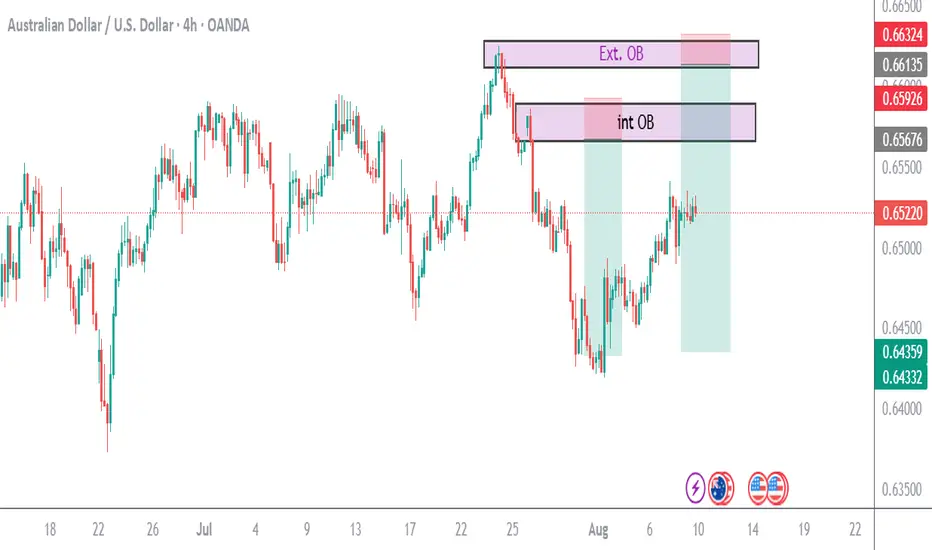
AUDUSD – DAILY FORECAST Q3 | W32 | D7 | Y25📊 AUDUSD – DAILY FORECAST
Q3 | W32 | D7 | Y25
Daily Forecast 🔍📅
Here’s a short diagnosis of the current chart setup 🧠📈
Higher time frame order blocks have been identified — these are our patient points of interest 🎯🧭.
It’s crucial to wait for a confirmed break of structure 🧱✅ before forming a directional bias.
This keeps us disciplined and aligned with what price action is truly telling us.
📈 Risk Management Protocols
🔑 Core principles:
Max 1% risk per trade
Only execute at pre-identified levels
Use alerts, not emotion
Stick to your RR plan — minimum 1:2
🧠 You’re not paid for how many trades you take, you’re paid for how well you manage risk.
🧠 Weekly FRGNT Insight
"Trade what the market gives, not what your ego wants."
Stay mechanical. Stay focused. Let the probabilities work.
FX:AUDUSD

AUDUSD H4 | Bearish reversal off overlap resistanceThe Aussie (AUD/USD) is rising towards the sell entry which acts as an overlap resistance that aligns with the 61.8% Fibonacci retracement and could drop from this level to the take profit.
Sell entry is at 0.6541, which is an overlap resistance that lines up with the 61.8% Fibonacci retracement.
Stop loss is at 0.6581, which is a pullback resistance that lines up with the 78.6% Fibonacci retracement.
Take profit is at 0.6480, which is a pullback support.
High Risk Investment Warning
Trading Forex/CFDs on margin carries a high level of risk and may not be suitable for all investors. Leverage can work against you.
Stratos Markets Limited (tradu.com ):
CFDs are complex instruments and come with a high risk of losing money rapidly due to leverage. 65% of retail investor accounts lose money when trading CFDs with this provider. You should consider whether you understand how CFDs work and whether you can afford to take the high risk of losing your money.
Stratos Europe Ltd (tradu.com ):
CFDs are complex instruments and come with a high risk of losing money rapidly due to leverage. 66% of retail investor accounts lose money when trading CFDs with this provider. You should consider whether you understand how CFDs work and whether you can afford to take the high risk of losing your money.
Stratos Global LLC (tradu.com ):
Losses can exceed deposits.
Please be advised that the information presented on TradingView is provided to Tradu (‘Company’, ‘we’) by a third-party provider (‘TFA Global Pte Ltd’). Please be reminded that you are solely responsible for the trading decisions on your account. There is a very high degree of risk involved in trading. Any information and/or content is intended entirely for research, educational and informational purposes only and does not constitute investment or consultation advice or investment strategy. The information is not tailored to the investment needs of any specific person and therefore does not involve a consideration of any of the investment objectives, financial situation or needs of any viewer that may receive it. Kindly also note that past performance is not a reliable indicator of future results. Actual results may differ materially from those anticipated in forward-looking or past performance statements. We assume no liability as to the accuracy or completeness of any of the information and/or content provided herein and the Company cannot be held responsible for any omission, mistake nor for any loss or damage including without limitation to any loss of profit which may arise from reliance on any information supplied by TFA Global Pte Ltd.
The speaker(s) is neither an employee, agent nor representative of Tradu and is therefore acting independently. The opinions given are their own, constitute general market commentary, and do not constitute the opinion or advice of Tradu or any form of personal or investment advice. Tradu neither endorses nor guarantees offerings of third-party speakers, nor is Tradu responsible for the content, veracity or opinions of third-party speakers, presenters or participants.

AUDUSD(20250807)Today's AnalysisMarket News:
Federal Reserve Chairman Neel Kashkari: A rate cut may be appropriate in the short term, and two rate cuts this year are reasonable. Trump: The new Fed governor will likely be temporary, and the appointment will be announced within 2-3 days.
Technical Analysis:
Today's Buy/Sell Levels:
0.6489
Support and Resistance Levels:
0.6538
0.6520
0.6508
0.6470
0.6458
0.6440
Trading Strategy:
If the price breaks above 0.6508, consider a buy entry, with the first target at 0.6520. If the price breaks below 0.6489, consider a sell entry, with the first target at 0.6470

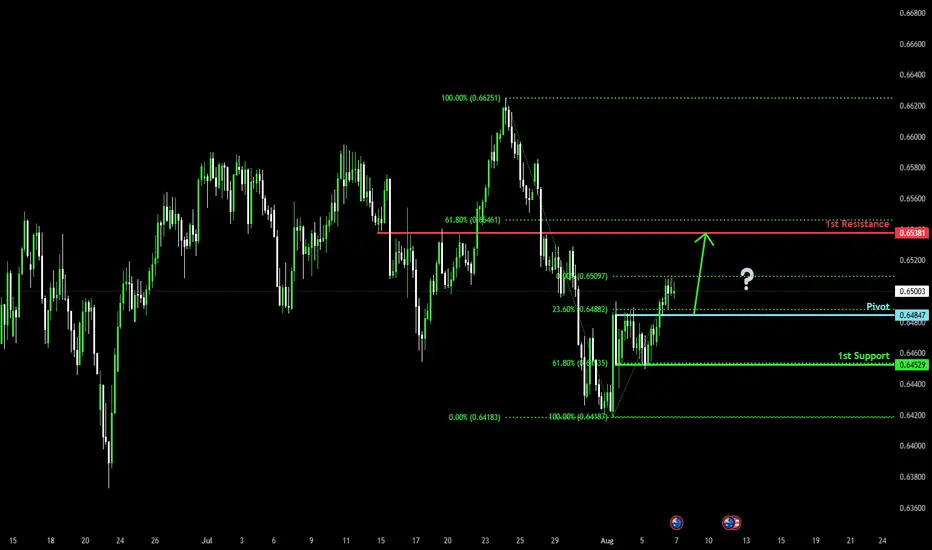
Bullish bounce off pullback support?The Aussie (AUD/USD) is falling towards the pivot which is a pullback support and could bounce to the 1st resistance.
Pivot:0.6484
1st Support: 0.6452
1st Resistance: 0.6538
Risk Warning:
Trading Forex and CFDs carries a high level of risk to your capital and you should only trade with money you can afford to lose. Trading Forex and CFDs may not be suitable for all investors, so please ensure that you fully understand the risks involved and seek independent advice if necessary.
Disclaimer:
The above opinions given constitute general market commentary, and do not constitute the opinion or advice of IC Markets or any form of personal or investment advice.
Any opinions, news, research, analyses, prices, other information, or links to third-party sites contained on this website are provided on an "as-is" basis, are intended only to be informative, is not an advice nor a recommendation, nor research, or a record of our trading prices, or an offer of, or solicitation for a transaction in any financial instrument and thus should not be treated as such. The information provided does not involve any specific investment objectives, financial situation and needs of any specific person who may receive it. Please be aware, that past performance is not a reliable indicator of future performance and/or results. Past Performance or Forward-looking scenarios based upon the reasonable beliefs of the third-party provider are not a guarantee of future performance. Actual results may differ materially from those anticipated in forward-looking or past performance statements. IC Markets makes no representation or warranty and assumes no liability as to the accuracy or completeness of the information provided, nor any loss arising from any investment based on a recommendation, forecast or any information supplied by any third-party.
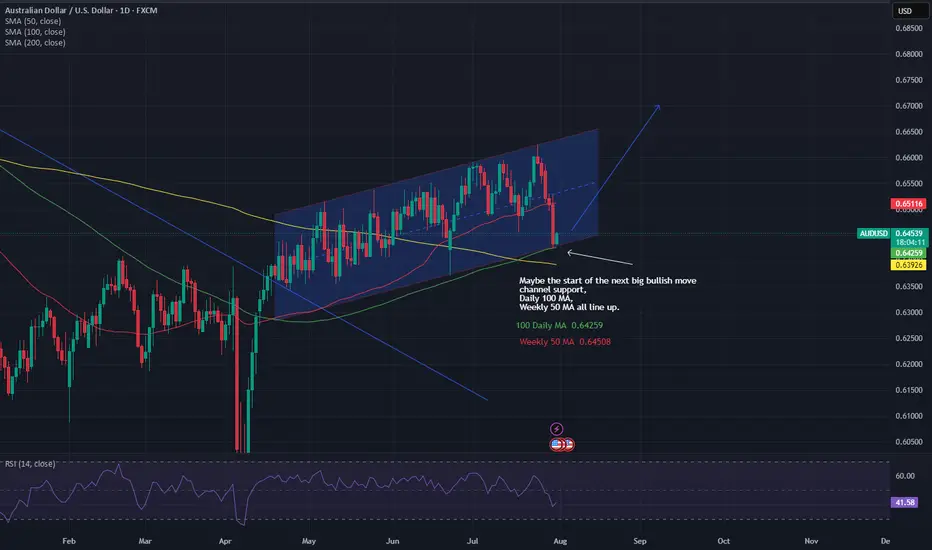
Could the next big AUD/USD Bullish up leg be readySimilar to NZD/USD look for the next big bullish up leg to start with channel support, Weekly 50 MA, Daily 100 Ma all lining up.
AUD eyes yield advantage over USD UBS strategists view the Australian dollar as a compelling long opportunity at current levels, supported by expectations that the Reserve Bank of Australia will ease policy more gradually than the U.S. Federal Reserve.
The bank forecasts 75 basis points of rate cuts from the RBA through Q1 2026, compared to 100 basis points from the Fed—helping to preserve a relative yield advantage for the Aussie.
On the daily chart, AUD/USD remains within a well-defined ascending channel that began in late 2024. The pair recently bounced off the lower boundary of the channel near 0.6450, with long lower wicks potentially indicating dip-buying interest.
Immediate resistance could sit at 0.6600, followed by a major zone near 0.6670. A break above these levels could confirm bullish continuation.

AUDUSD - BullishAUDUSD is Bullish on Fundamental Bias and Seasonal aslo support long position. Divergence can also be observed on RSI.

AUDUSD Swing Trade Plan – 1H Time FrameThe pair is showing early signs of bullish structure with a clean higher low (HL) to higher high (HH) transition. An instant buy entry is considered valid based on the breakout above a key resistance zone.
🔹 Entry: Market Buy (Current Price ≈ 0.65038)
🔹 Stop Loss (SL): 0.64496
🔹 Take Profit (TP): 0.65523
📌 Structure Shift Noted
The break above prior highs confirms a market structure reversal with HL → HH → HH sequence. The bullish RSI divergence and sustained move above the EMA cluster further support upside momentum.
📍 Trade Rationale:
Price broke out of prior resistance and retested it as new support
RSI currently around 63, indicating strength without being overbought
Favorable risk-reward from current levels, targeting previous imbalance area at TP1
🧠 Plan: Monitor candle close above minor intraday range for continued bullish pressure. SL is placed below recent demand and last swing low for structural protection.
💡 Patience and discipline are key — watch how price behaves around the 0.652 zone before scaling in.

AUDUSD- SMC Breakdown: Understanding Smart Money Moves📘 SMC Breakdown: Understanding Smart Money Moves
🔹 Buy-side liquidity was engineered to trap late buyers.
🔹 Price created a fakeout above the highs — classic liquidity grab.
🔹 Entry followed right after the FVG (Fair Value Gap) fill.
🔹 Sharp reversal marked by CHOCH (Change of Character), confirming shift in structure.
🔹 Market swept sell-side liquidity, triggering BOS (Break of Structure) — ideal exit or next entry zone.

Supply in Sight: AUDUSD Gearing Up for a Reversal?Hello TradingView Family / Fellow Traders. This is Richard, also known as theSignalyst.
📈AUDUSD has been overall bullish trading within the rising channel marked in red and it is currently retesting the upper bound of the channel acting as an over-bought zone.
Moreover, the blue zone is a strong supply.
📚 As per my trading style:
As #AUDUSD approaches the red circle zone, I will be looking for bearish reversal setups (like a double top pattern, trendline break , and so on...)
📚 Always follow your trading plan regarding entry, risk management, and trade management.
Good luck!
All Strategies Are Good; If Managed Properly!
~Rich
Disclosure: I am part of Trade Nation's Influencer program and receive a monthly fee for using their TradingView charts in my analysis.
