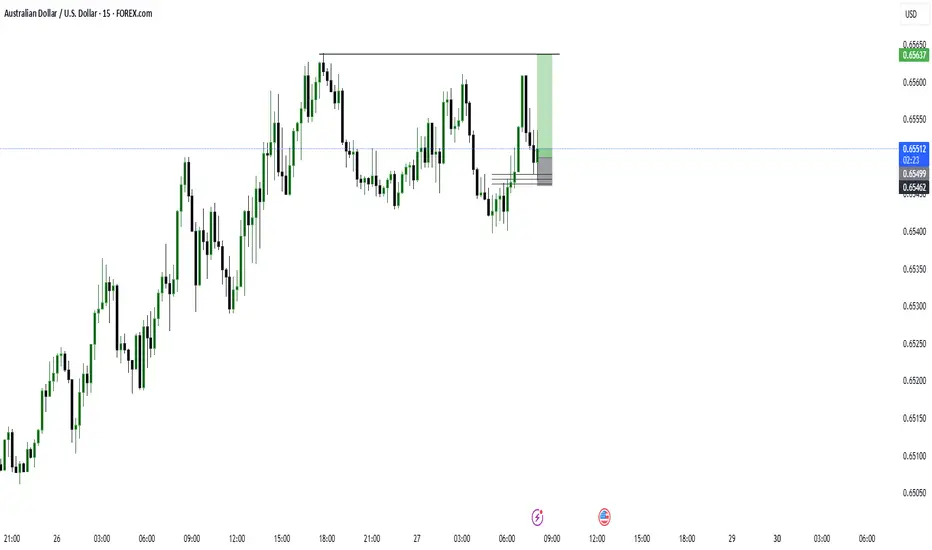
AUDUSD BUY SETUPWe have transitioned from a downtrend to and up trend as shown by the transition for lower low and lower high to a higher high and potential higher low. we have pulled back to a key level for an entry.
USDAUD trade ideas
AUDUSD SHORT DAILY FORECAST Q3 D30 W27 Y25AUDUSD SHORT DAILY FORECAST Q3 D30 W27 Y25
Professional Risk Managers👋
Welcome back to another FRGNT chart update📈
Diving into some Forex setups using predominantly higher time frame order blocks alongside confirmation breaks of structure.
Let’s see what price action is telling us today! 👀
💡Here are some trade confluences📝
✅Daily Order block identified
✅4H Order Block identified
✅1H Order Block identified
🔑 Remember, to participate in trading comes always with a degree of risk, therefore as professional risk managers it remains vital that we stick to our risk management plan as well as our trading strategies.
📈The rest, we leave to the balance of probabilities.
💡Fail to plan. Plan to fail.
🏆It has always been that simple.
❤️Good luck with your trading journey, I shall see you at the very top.
🎯Trade consistent, FRGNT X

AUDUSD WEEKLY HIGHER TIME FRAME FORECAST Q3 W27 Y25AUDUSD WEEKLY HIGHER TIME FRAME FORECAST Q3 W27 Y25
Professional Risk Managers👋
Welcome back to another FRGNT chart update📈
Diving into some Forex setups using predominantly higher time frame order blocks alongside confirmation breaks of structure.
Let’s see what price action is telling us today! 👀
💡Here are some trade confluences📝
✅Weekly 50EMA Rejection
✅Daily Order block identified
✅4H Order Block identified
🔑 Remember, to participate in trading comes always with a degree of risk, therefore as professional risk managers it remains vital that we stick to our risk management plan as well as our trading strategies.
📈The rest, we leave to the balance of probabilities.
💡Fail to plan. Plan to fail.
🏆It has always been that simple.
❤️Good luck with your trading journey, I shall see you at the very top.
🎯Trade consistent, FRGNT X

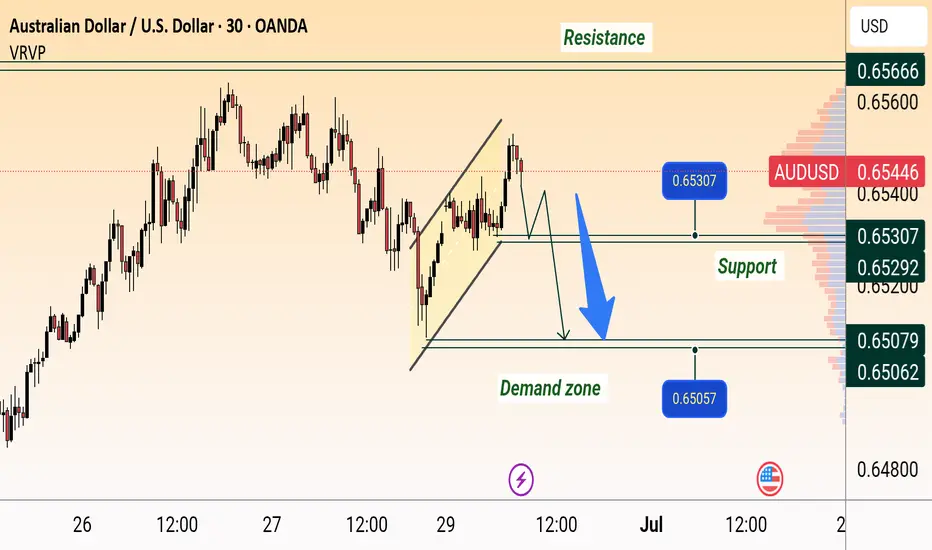
AUD/USD Bearish Reversal SetupAUD/USD Bearish Setup:
Price is showing rejection near resistance around 0.65600 and has broken below the rising channel. A retest of the broken trendline may lead to a drop towards the support zone at 0.65307, and potentially further to the demand zone around 0.65057–0.65000.
Could the price reverse from here?AUD/USD is reacting off the pivot, which is a pullback resistance that aligns with the 61.8% Fibonacci retracement and could drop the 1st support.
Pivot: 0.6537
1st Support: 0.6359
1st Resistance: 0.6680
Risk Warning:
Trading Forex and CFDs carries a high level of risk to your capital and you should only trade with money you can afford to lose. Trading Forex and CFDs may not be suitable for all investors, so please ensure that you fully understand the risks involved and seek independent advice if necessary.
Disclaimer:
The above opinions given constitute general market commentary, and do not constitute the opinion or advice of IC Markets or any form of personal or investment advice.
Any opinions, news, research, analyses, prices, other information, or links to third-party sites contained on this website are provided on an "as-is" basis, are intended only to be informative, is not an advice nor a recommendation, nor research, or a record of our trading prices, or an offer of, or solicitation for a transaction in any financial instrument and thus should not be treated as such. The information provided does not involve any specific investment objectives, financial situation and needs of any specific person who may receive it. Please be aware, that past performance is not a reliable indicator of future performance and/or results. Past Performance or Forward-looking scenarios based upon the reasonable beliefs of the third-party provider are not a guarantee of future performance. Actual results may differ materially from those anticipated in forward-looking or past performance statements. IC Markets makes no representation or warranty and assumes no liability as to the accuracy or completeness of the information provided, nor any loss arising from any investment based on a recommendation, forecast or any information supplied by any third-party.

Bullish Analyzing the AUD/USD across multiple timeframes, we observe a consistent pattern of price recovery and potential accumulation phases. Starting from the 1D chart, there is a visible upward trend with recent bullish candles indicating strong buying interest. The 4H and 1H charts show a pullback to a potential Order Block (OB) around 0.6535, suggesting institutional buying interest at these levels.
The 15M, 5M, and 1M charts provide a more granular view, showing recent price rejection at lower levels and a swift recovery, indicating a sweep of liquidity below recent lows and a potential trapping of retail short positions. This setup suggests a possible preparation for an upward continuation, as institutions may have accumulated enough positions at a discount.
INSTITUTIONAL THESIS:
Institutions appear to be in an accumulation phase, buying at lower levels (around 0.6535) and preparing for a potential upward move. The repeated testing and rejection of lower prices across shorter timeframes indicate a buildup of buy-side liquidity, likely targeting the recent highs for a liquidity grab.
LEARNING POINT:
"1H Order Block mitigation after liquidity sweep" - This concept is crucial as it shows how institutions potentially use lower price levels to accumulate positions before driving the price up to target liquidity above the market.
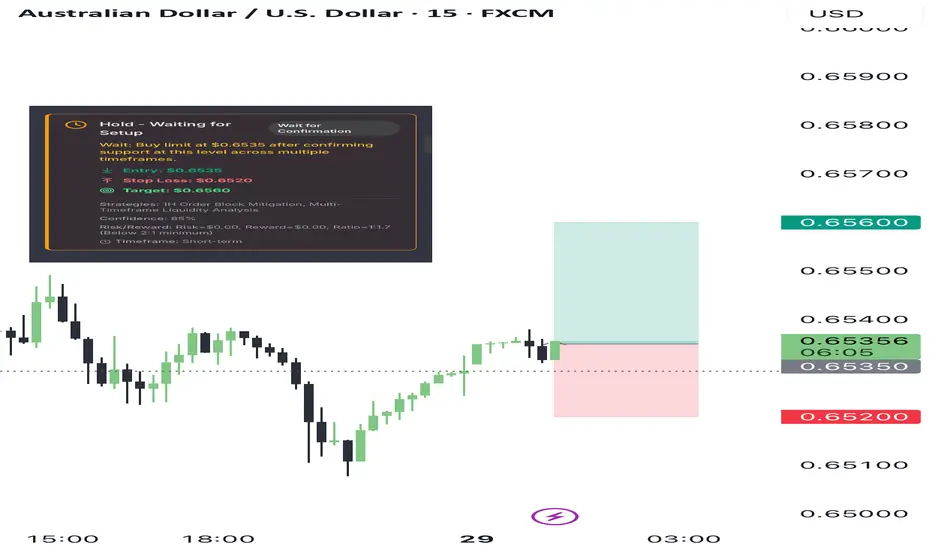
SIGNAL: WAIT
SYMBOL: AUD/USD
ENTRY PRICE: $0.6535
STOP LOSS: $0.6520
TARGET PRICE: $0.6560
CONDITION: Buy limit at $0.6535 after confirming support at this level across multiple timeframes.
RATIONALE: Calculated risk/reward ratio of 1:1.7 (Risk=$0.00, Reward=$0.00) does not meet minimum 2:1 requirement. Waiting for better institutional setup with improved risk parameters.
STRATEGIES USED: 1H Order Block Mitigation, Multi-Timeframe Liquidity Analysis
URGENCY: MEDIUM
TIMEFRAME: Short-term
CONFIDENCE SCORE: 85%
RISK/REWARD RATIO: Risk=$0.00, Reward=$0.00, Ratio=1:1.7 (Below 2:1 minimum)
Risk Calculation:
Risk = Entry Price - Stop Loss = $0.6535 - $0.6520 = $0.0015
Reward Calculation:
Reward = Target Price - Entry Price = $0.6560 - $0.6535 = $0.0025
Ratio Calculation:
Ratio = Reward ÷ Risk = $0.0025 ÷ $0.0015 = 1:1.67
Final Decision:
The calculated risk/reward ratio is less than 2:1, thus changing the signal to WAIT.
FINAL RECOMMENDATION: WAIT
Despite the favorable setup for a BUY based on institutional analysis, the risk/reward ratio does not meet the minimum requirement of 2:1. It is recommended to monitor the price action closely and adjust the target or stop loss to improve the risk/reward ratio before entering the trade.
AUDUSD 4hour TF - June 29th, 2025AUDUSD 4hour Neutral idea
Monthly - Bearish
Weekly - Bearish
Dailly - Bullish
4hour - Bullish
AU has been in this subtle bullish channel since late April 2025, just above major monthly support at 0.63250 area.
We also have some conflicting trends and we need to see some conviction before we can comfortably follow price action. We do have some alignment with a bearish USD but at the moment we have two options:
Bullish Continuation - This is the most likely scenario based on what we’re seeing and where price action is. Ideally, we see some rejection from our 4hour 0.65000 support area followed by bullish conviction. If this happens look for price action to touch or break the top of this channel and continue bullish for the week ahead.
Reversal back into channel - If we fail to see bullish presence we could see price action fall back into the channel. The key indication of this would be a break below our 0.65000 support area followed by a retest and bearish conviction.

AUDUSD Bullish Ready for long position**Description (AUD/USD Long Setup):**
This is a 1-hour chart of **AUD/USD**, showing a textbook **bullish continuation setup**. The price has recently pulled back in a **bullish flag** (descending channel) and is now showing signs of a breakout above the flag's upper boundary.
Price is reacting from a **Weekly Area of Interest (AOI)** — a zone of previous support — while remaining above the **200 EMA (red)** and reclaiming the **50 EMA (blue)**.
All major timeframes (W, D, 12H, 6H, 4H) are **100% bullish**, adding confluence and confidence to this buy idea.
---
**Why I want to enter Buy:**
* ✅ **Bullish flag breakout** — strong bullish pattern indicating trend continuation.
* ✅ **Price bounced from Weekly AOI** — key support zone respected.
* ✅ **Reclaiming EMAs** — bullish strength returning.
* ✅ **Confluence of timeframes** — momentum aligned from 4H to Weekly.
* ✅ **Great Risk-to-Reward (R\:R)** — defined invalidation below support (Daily AOI), and upside toward **Daily AOI @ 0.66500**.
---
🎯 **Target:** 0.66500
🛡️ **Stop loss:** Just below 0.64500
📈 **Entry idea:** Either aggressive on breakout or conservative on retest of flag breakout / AOI
This setup reflects smart money reaccumulation at a key zone with multi-timeframe alignment — high probability for bullish continuation.

AUDUSD BEARISH REVERSAL Price entered sideways consolidation around June 24-25, After peaking around 0.6565–0.6580, the price started to create lower highs, suggesting a trend reversal or deeper correction.

The Aussie Dollar Heist Blueprint: "AUD/USD" Long Setup!?🌍 Hello, Global Wealth Warriors! Ciao, Salut, Guten Tag, Ola! 🌟
Fellow Profit Pirates & Market Mavericks, 💸⚡
Unveiling our cunning blueprint to plunder the AUD/USD (The Aussie) forex market, crafted with 🔥Thief Trading’s razor-sharp technical and fundamental insights🔥. Stick to the chart’s game plan, zoned in on a long entry. Our mission? Slip out near the high-stakes RED Zone Level—a perilous spot with overbought vibes, consolidation, trend flips, and traps where bearish bandits lurk. 🏴☠️💰 Celebrate your wins, traders—you’ve earned it! 🎉
Entry 📈 : "The heist is on! Wait for the MA line breakout (0.65200) then make your move - Bullish profits await!"
however I advise to Place Buy stop orders above the ATR line (or) Place buy limit orders within a 15 or 30 minute timeframe most recent or swing, low or high level for Pullback entries.
📌I strongly advise you to set an "alert (Alarm)" on your chart so you can see when the breakout entry occurs.
🛑 **Stop Loss**:
📍 Thief SL parked at the recent/swing low on the 4H timeframe (0.64600) for day/swing trades.
📍 Tailor your SL to your risk appetite, lot size, and number of orders. Stay sharp!
🎯 **Target**: Aim for 0.66300 or make a swift exit just before.
👀 **Scalpers, Listen Up**: Stick to long-side scalping. Got deep pockets? Dive in now! Otherwise, join swing traders for the grand heist. Use trailing SL to shield your loot. 💰
💹 **Market Pulse**: The AUD/USD (The Aussie) forex market is in a ATR Dynamic Resistance zone but leaning bullish, fueled by key drivers. ☝
🌐 Dive into Fundamentals, Macro Insights, COT Reports, Quantitative Analysis, Sentiment Outlook, Intermarket Trends, Future Targets & Overall score.. Check the linkss for the full scoop! 🔗🌍
⚠️ **Trading Alert**: News can shake the market! 📰
🔐 Protect your positions:
- Pause new trades during news releases.
- Use trailing stop-loss to lock in gains.
💪 **Join the Heist**: Smash the Boost Button to supercharge our robbery squad! 💥 With Thief Trading Style, we rake in profits daily with ease. 🚀 Your support fuels our market conquests. 🤝❤️
Stay tuned for the next daring heist, money makers! 🤑🐱👤🎯

AUD/USD Bearish Setup – Rejection from Supply ZoneAUD/USD is showing signs of bearish pressure after getting rejected from the key 0.65420 supply zone, marked by strong historical resistance and a high-volume node. Price tested this area multiple times but failed to break above, forming a potential lower high – a classic signal of institutional distribution.
🔵 Key Levels:
Resistance (Supply Zone): 0.65420
Mid-range support: 0.65040
Demand Zone: 0.64649 – 0.64400
🔻 Bearish Outlook: If price holds below 0.65420, we anticipate a drop first toward 0.65040, and potentially down to 0.64649, where a demand zone is likely to react. The previous bounce from demand suggests smart money accumulation below.
📌 Watch for:
Bearish engulfing or rejection wick candles near 0.65400.
Break below 0.65040 to confirm short continuation.
Confluence with macroeconomic events (FOMC, US data on the 17th–18th).
💬 Are you shorting AUD/USD from the supply zone? Drop your thoughts👇
#AUDUSD #Forex #SmartMoney #SupplyDemand #PriceAction #LuxAlgo #ForexTrading #TradingView #MarketStructure

AUD/USD 4H – Bearish Supply Zone Rejection & Mid-Term Short BiasAUD/USD 4H – Bearish Supply Zone Rejection & Mid-Term Short Bias
The Aussie has climbed into a major supply zone near the 0.67380 – 0.67540 area, which overlaps with a historical resistance range from late 2024. Price is currently testing the upper edge of this zone, showing signs of exhaustion.
🔍 Key Observations:
Supply Zone Reaction: The confluence of past resistance (clearly marked as 'R') and current bearish candle formations suggests a potential reversal setup.
Liquidity Grab & Rejection: The current push may be a liquidity sweep above recent highs, potentially trapping breakout buyers before a reversal.
Downside Targets:
First support area around 0.65311 – 0.65000, previously respected demand zone.
If momentum continues, extended targets lie at 0.62729, 0.60874, and 0.59206 – all aligned with previous price reactions and liquidity pockets.
📊 Trading Plan:
Bias: Short (mid-term swing)
Entry Zone: 0.67350 – 0.67540 (sell limit / wait for confirmation)
Stop Loss: Above 0.67650 (above last swing high)
Targets:
TP1: 0.65300
TP2: 0.62730
TP3: 0.60870
🧠 Risk Note:
Price has entered a high-probability reversal zone, but confirmation via bearish engulfing or lower-timeframe structure break is ideal before entering aggressively.

AUD/USD: The Rebound TradeThe Australian dollar (also known as the Aussie Battler) looks set to continue its recent bounce. Inflation is now under control and monetary easing will continue to support aggregate demand across the economy. While rate cuts are dovish, the underlying economy is still strong and, as we will explain below, the fiscal situation is shaping up better than expected. Stability is in.
The real action, though, is in the US. Unemployment is creeping up. Jobless claims are ticking higher. Existing home sales are falling. The US consumer is feeling the pinch. That puts pressure on the Fed. Rate cuts are back in the conversation. Markets are already pricing in the first move later this year. The US dollar is losing its grip.
AUD/USD recently tested its 200 day moving average and held firm. That’s more than just a technical level. It’s a psychological line in the sand. The Aussie held its ground.
There’s more. Australia’s fiscal position is likely to come in stronger than expected. Mining exports are holding up. Volumes are rising. That supports the budget bottom line and underpins the Aussie’s credibility as a resource backed currency. This is in stark contrast to most of the developed world, where peers are running large deficits.
This isn’t just about central banks. The global economy is shifting gears. China is stabilising. Industrial demand is returning. Commodity prices are finding a floor. That’s key for the Aussie. It’s still a commodity linked currency. As iron ore and copper pick up, the AUD should follow.
There’s a window here. Over the next twelve months, the AUD has room to move higher, testing the 0.7000 range. Not because Australia is booming, but also because the US is slowing. The Fed is running out of steam. That flips the dynamic. We’re moving from USD strength to USD softness.
The setup is clear. A soft landing in the US. A stable China. Commodities firming. And an RBA on hold. That’s a cocktail for AUD strength.
The bounce has just begun.
The forecasts provided herein are intended for informational purposes only and should not be construed as guarantees of future performance. This is an example only to enhance a consumer's understanding of the strategy being described above and is not to be taken as Blueberry Markets providing personal advice.

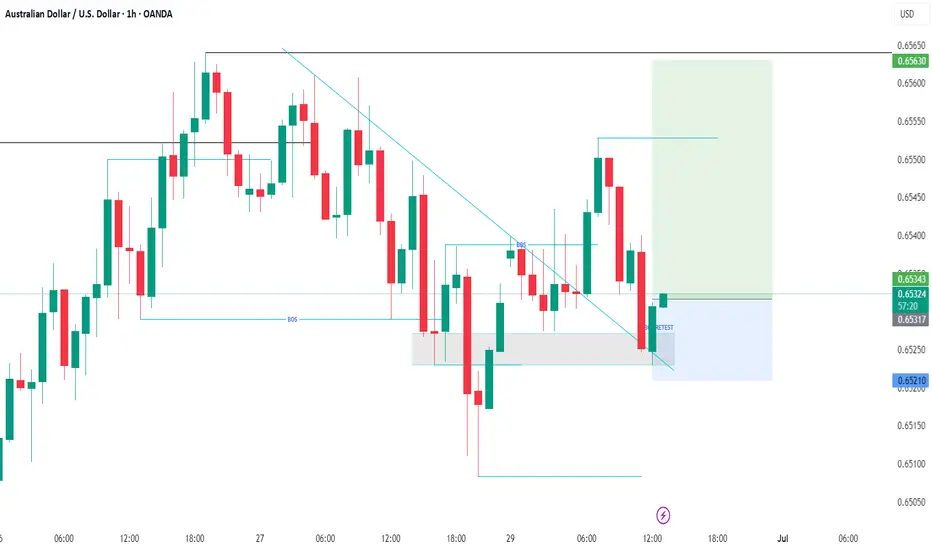
AUDUSD Trendline Strategy AUDUSD has been on an uptrend all day on Thursday, this trend was broken during the Asian session on Friday. To confirm that the trend was broken it hit the 1H Supply Zone and retested the trend line. Right before the London session it seemed to have formed some support at the 0.65455 level then it retraced back to the 1H Supply Zone and created a large bearish engulfing candle on the 15M which also showed a double top candlestick pattern. I then entered the trade on the break of candle on the 3:15am EST engulfing candle. I placed my stop loss right above the supply zone and entered the trade with a profit target of .65270. I chose this level due to it being a strong demand level and I thought it seemed like a lot of resting liquidity was there. Although on the chart I have the profit target as .65100 I did not hold the trade that long due to me not wanted to get chopped during after the NY AM session. I'm still practicing trusting my full analysis and holding trades for the entire duration I originally project. On this chart I also drew up other demand zones in which I was expecting a large reaction at. All 3 zones played out but it did not disturb the trade because the overall trend (1H) was on a downtrend. Its important to always remember to have time frame correlation when taking trades and always remember to follow the higher timeframe trend. Personally I feel like AUDUSD will continue this downtrend and possibly gap down to .65 during either Sunday night open or sometime during the London session.

AUDUSD TRADING INSIGHT (RECAP)In this video, I invite you to join me as I delve into my thought process behind this trade and the strategies I used to manage it. I’m confident you’ll uncover valuable insights that can enhance your trading journey. If you’ve taken the same trade, I’d love to hear your experiences and thoughts in the comments section below! Your perspective could spark an engaging discussion!

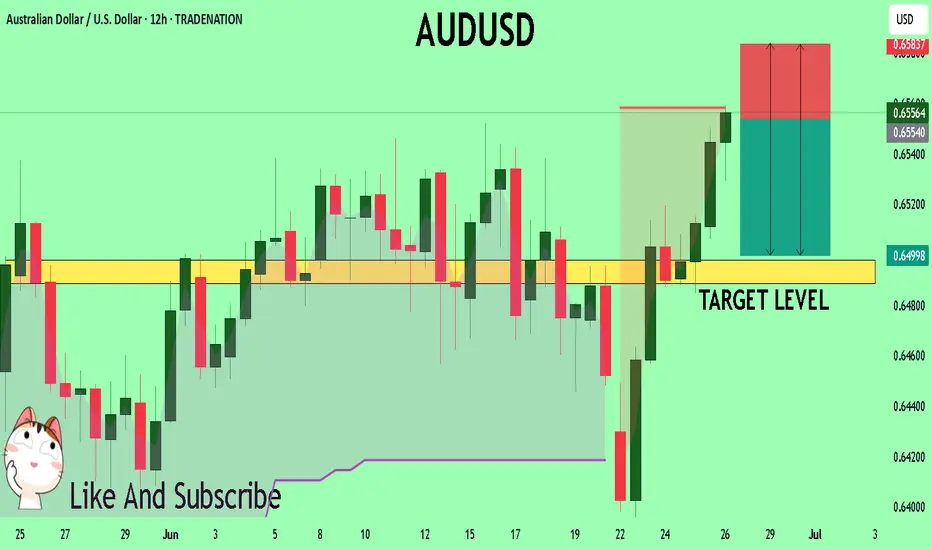
AUDUSD Set To Fall! SELL!
My dear followers,
This is my opinion on the AUDUSD next move:
The asset is approaching an important pivot point 0.6555
Bias - Bearish
Safe Stop Loss - 0.6583
Technical Indicators: Supper Trend generates a clear short signal while Pivot Point HL is currently determining the overall Bearish trend of the market.
Goal - 0.6497
About Used Indicators:
For more efficient signals, super-trend is used in combination with other indicators like Pivot Points.
Disclosure: I am part of Trade Nation's Influencer program and receive a monthly fee for using their TradingView charts in my analysis.
———————————
WISH YOU ALL LUCK
AUD/USD ANALYSISAUD/USD ANALYSIS; we wait for price to raid either on the buyside or sell liquidity then a change in the state of price delivery depending on which side price will raid

AUD/USD Coils Below Critical ResistanceThe June range is preserved heading into the close of the month with a massive outside-weekly reversal taking Aussie back into key resistance on Friday. Note that momentum is approaching the 60-level for the first time this year and a break higher alongside a breach above 6550 could fuel a substantial rally here- watch the weekly close.
Initial support rests with the February high-week close (HWC) at 6357 and is backed closely by 6290/6315- a region defined by the yearly low-week close (LWC) and the 38.2% retracement of the yearly range. Note that the median-line converges on this level over the next few weeks and we’ll reserve this threshold as our bullish invalidation level- a break / weekly close below would threaten downtrend resumption toward the next major technical consideration at 6162/79.
A topside breach / close above this key pivot zone is needed to fuel the next leg of the advance with key resistance seen at the 2019 lows near 6670. Ultimately a break above the upper parallel (blue) would be needed to suggest a more significant trend reversal is underway with subsequent resistance objectives eyed at the 2024 HWC / yearly open near 6795-6810 and 6900.
Bottom line: An outside-weekly reversal has covered the entire monthly range with the Australian Dollar now testing critical resistance for an eighth-consecutive week. From a trading standpoint, losses should be limited to the 52-week moving average IF price is heading higher on this stretch with a close above 6550 needed to fuel the next move.
-MB

Retest of New Highs and Pullback Zone✨ By MJTrading:
Chart Overview:
AUDUSD reached a 2025 new high around 0.65600 before pulling back sharply. Price broke out of a consolidation wedge and is now retesting the prior breakout and dynamic support area.
🔹 Key Points:
Structure: Clear impulse move to new highs, followed by corrective pullback.
Support Zone: Blue box ~0.6480–0.6500 could act as a demand area if price extends lower.
EMAs: Price testing the 60 EMA (~0.6523) after losing short-term momentum.
Trade Setup:
Entry: 0.65250
SL: 0.65510
TP1: 0.65000
(Please Manage your Risk)( Ideal: 1% Per Trade)
Possible Scenarios:
Bullish reaction from current EMA support or the blue demand zone.
Deeper retracement if price fails to hold above 0.6500.
💡 Note:
This chart highlights how prior consolidation and breakout zones can offer potential retest entries in trending markets.
Thanks for your time an attention...
Follow for more setups.
#MJTrading
#AUDUSD #Forex #TechnicalAnalysis #PriceAction #BreakoutTrading #SupportResistance #TradingView #FX

AUDUSD Potential UpsidesHey Traders, in today's trading session we are monitoring AUDUSD for a buying opportunity around 0.65300 zone, AUDUSD is trading in an uptrend and currently is in a correction phase in which it is approaching the trend at 0.65300 support and resistance area.
Trade safe, Joe.

AUD/USD Parallel Channel Setup – Breakout or Pullback in PlayThe AUD/USD pair is trading within a clearly defined ascending parallel channel, with consistent rejections from both the upper resistance zone near 0.6550–0.6560 and repeated bounces from the rising support area near 0.6390–0.6400. This structured price movement indicates strong channel discipline, which traders can use for high-probability breakouts or reversal plays.
The current price action is approaching the upper boundary of the resistance, and a decisive breakout here could lead to a bullish rally toward the projected target.
📈 Bullish Breakout Scenario
If the price breaks and closes above the resistance zone (above 0.6560), it will confirm a bullish breakout from the channel. Based on the height of the channel, the projected breakout target is 0.67365, which is derived by measuring the vertical distance between support and resistance and projecting it upward from the breakout point. This could signal a major trend continuation in favor of the bulls.
📉 Bearish Rejection Scenario
If the price once again gets rejected at the resistance zone, a corrective move is expected toward the support area around 0.6400. The structure suggests that unless a breakout occurs, price may continue to oscillate within the rising channel. The next bearish leg could form a lower high and test the trendline support again.
🧭 Trading Strategy Outlook
Buy Breakout Strategy:
Entry: Above 0.6560
SL: Below breakout candle
TP: 0.67365 (projected target)
Sell Rejection Strategy:
Entry: Near 0.6550 resistance
SL: Above 0.6570
TP: 0.6400 support zone
This is a neutral-to-bullish setup, with a potential for continuation if the resistance breaks with strength. Traders should wait for confirmation before entering.
=================================================================
Disclosure: I am part of Trade Nation's Influencer program and receive a monthly fee for using their TradingView charts in my analysis.
=================================================================

AUDUSD SHORT FORECAST Q2 W26 D27 Y25AUDUSD SHORT FORECAST Q2 W26 D27 Y25
Professional Risk Managers👋
Welcome back to another FRGNT chart update📈
Diving into some Forex setups using predominantly higher time frame order blocks alongside confirmation breaks of structure.
Let’s see what price action is telling us today!
💡Here are some trade confluences📝
✅Daily order block
✅1H Order block
✅Intraday breaks of structure
✅4H Order block
🔑 Remember, to participate in trading comes always with a degree of risk, therefore as professional risk managers it remains vital that we stick to our risk management plan as well as our trading strategies.
📈The rest, we leave to the balance of probabilities.
💡Fail to plan. Plan to fail.
🏆It has always been that simple.
❤️Good luck with your trading journey, I shall see you at the very top.
🎯Trade consistent, FRGNT X
