Brent Crude Breakdown: $61 Next?Structure & momentum
Price completed a three-leg climb into late August but failed beneath a thick supply band clustered around 68.50 → 69.30 and again lower-high’d under 70.80. The last push up rode a rising support line; that line has now broken, followed by two wide-range sell candles closing nea
About U.S. DOLLAR / BRENT CRUDE OIL
Crude Oil is a naturally occurring liquid fossil fuel resulting from plants and animals buried underground and exposed to extreme heat and pressure. Crude oil is one of the most demanded commodities and prices have significantly increased in recent times.

Oil Prices Rise on Geopolitical FactorsOil Prices Rise on Geopolitical Factors
As the XBR/USD chart shows, Brent crude opened this week’s trading around $65.70, but today the price is near $66.80 (around +1.7%).
Oil is being pushed higher by geopolitical factors, including:
→ Israel’s strike on Hamas leadership in Qatar;
→ Trump’s cal

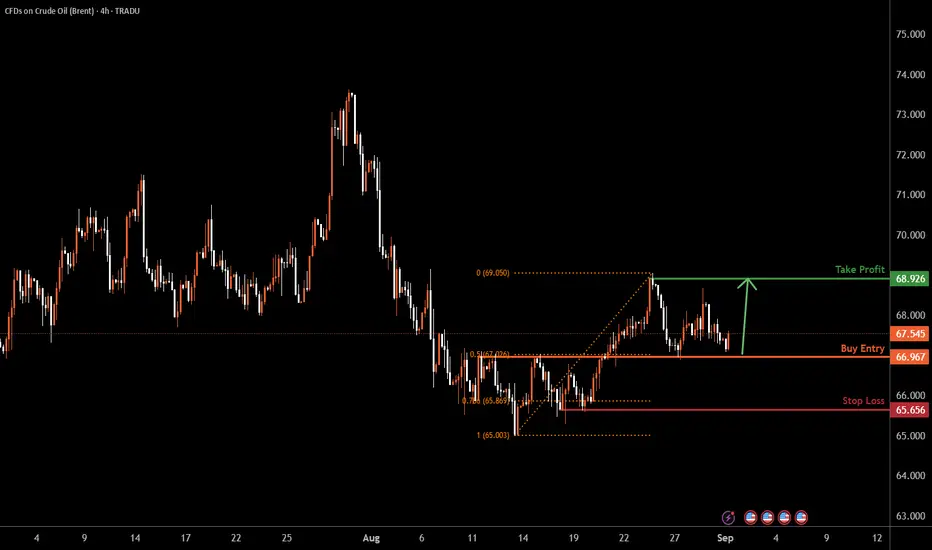
UKOIL H4 | Bullish momentum to extendUKOIL is falling towards the buy entry at 68.28, which is a pullback support that aligns with the 50% Fibonacci retracement and could bounce from this level to the upside.
Stop loss is at 66.95, whichis an overlap support that lines up with he 61.8% Fibonacci retracement.
Take profit is at 70.43,

OIL LongThe oil is poised to rise from 66.2 , driven by the confirmed Crab harmonic pattern, highlighting robust bullish momentum.

Shale Producers Can’t Survive This Drop
Brent Crude Oil OANDA:BCOUSD TVC:UKOIL NYMEX:MCL1! ICEEUR:BRN1! — Wave C Still in Progress
Main Idea
I expect Brent to retest the 58.37 low in the coming months as part of a corrective Wave C in a zigzag formation.
Technical Outlook
Price action remains bearish, with the market tradi

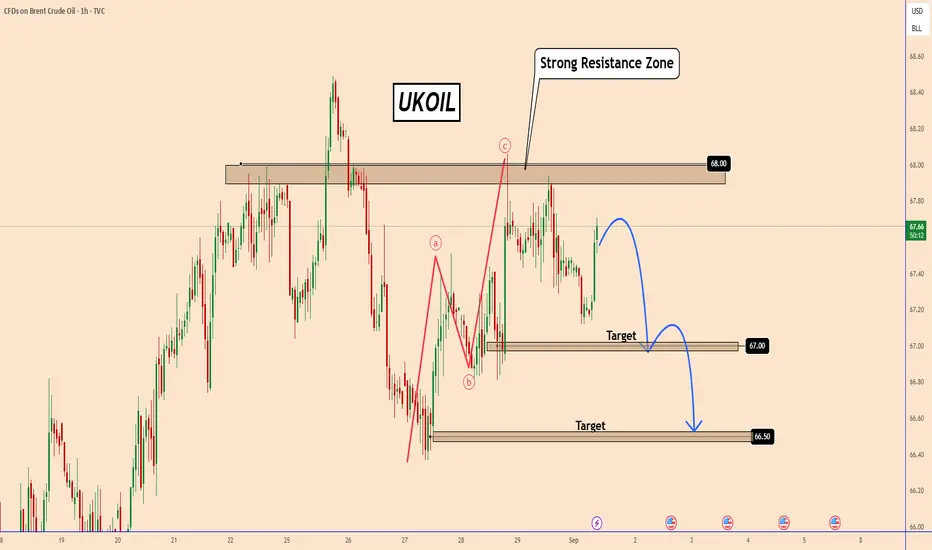
Oil Price Forecast: Watch These Key LevelsOil Price Forecast: Watch These Key Levels
Currently, OIL is trading around 67.70, standing just below a Strong Resistance Zone near 86.00.
The current pattern suggests a possible downward move, as a short-term selling opportunity.
From the chart, we can see that OIL created an ABC corrective wa
UKOIL H4 | Price Rebounds from Overlap Support levelUKOIL is falling towards the buy entry, which is an overlap support that aligns with the 50% Fibonacci retracement and could bounce from this level to the upside.
Buy entry is at 66.96, which is an overlap support that lines up with the 50% Fibonacci retracement.
Stop loss is at 65.65, which is a
Brent Crude bearish below resistance at 6840The Brent Crude Oil is currently trading with a bearish bias, aligned with the broader downward trend. Recent price action shows a retest of the resistance, suggesting a further selling pressure within the downtrend.
Key resistance is located at 6840, a prior consolidation zone. This level will be

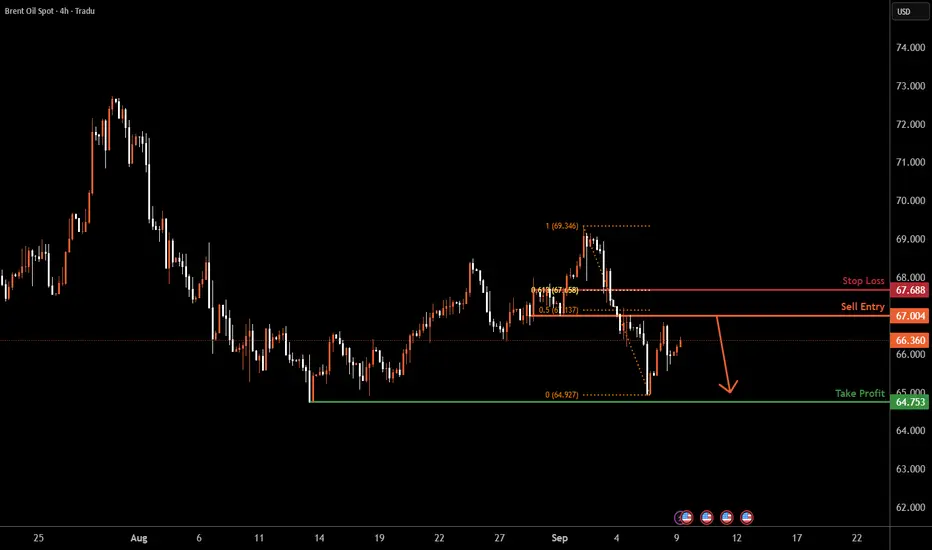
UKOILSPOT H4 | Potential bearish drop offBased on the H4 chart analysis, we can see that the price is reacting off the sell entry which is a pullback resistance that aligns with the 50% Fibonacci retracement and could drop from this level to the downside.
Sell entry is at 67.00, which is a pullback resistance that lines up with he 50% Fib
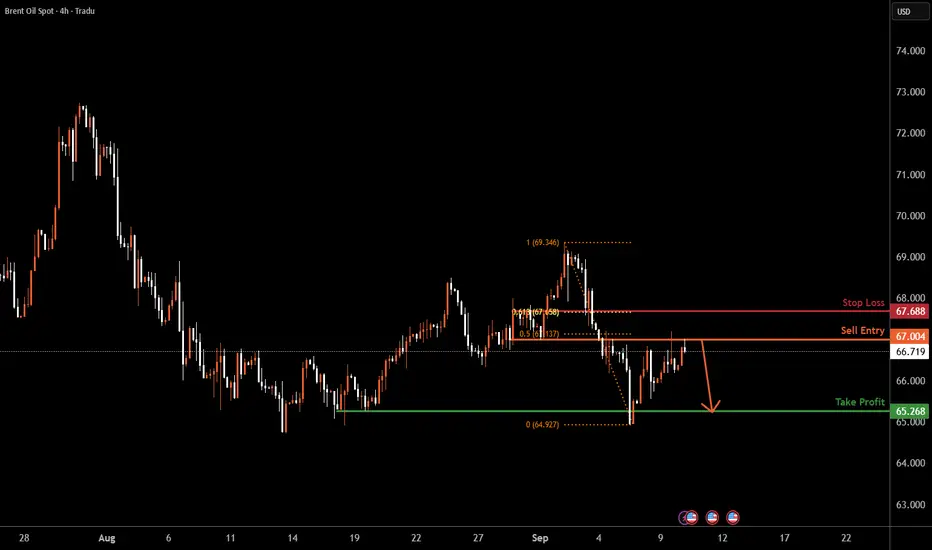
UKOILSPOT H4 | Bearish reversal off 50% Fibonacci resistanceBased on the H4 chart analysis, we could see the price rise to the sell entry, which is a pullback resistance that aligns with the 50% Fibonacci retracement and could reverse from this level to the downside.
Sell entry is at 67.00, which is a pullback resistance lines up with the 50% Fibonacci retr
See all ideas
Displays a symbol's price movements over previous years to identify recurring trends.