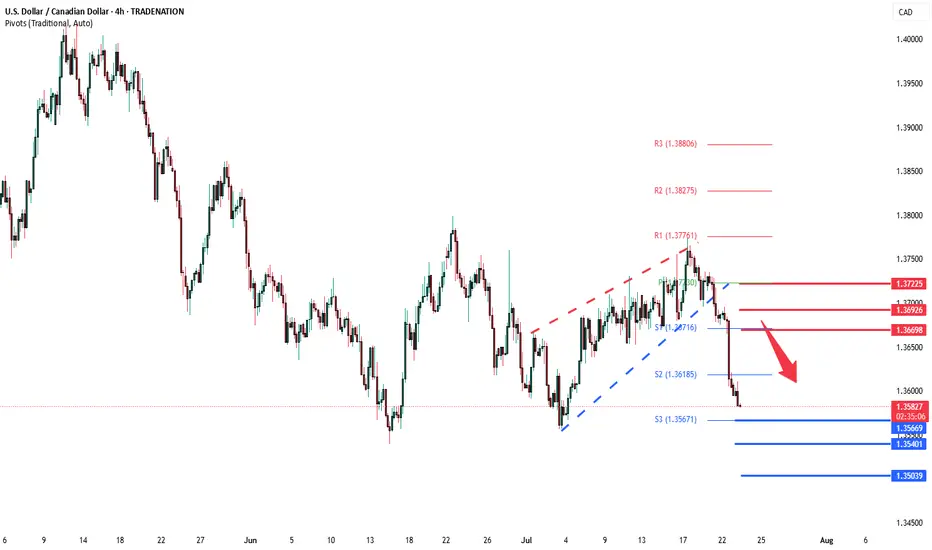
USDCAD 4H Bearish SetupThe USDCAD chart shows a clear bearish breakdown from the ascending channel. Price has broken below support near 1.3720, confirming a shift in structure.
Key Analysis:
Bearish Momentum: Break below the channel and current market structure signals downside pressure.
Immediate Resistance: 1.3725–1.3745 zone (yellow area) where price previously rejected.
Support Levels:
1.3639 / 1.3638: Short-term support — possible temporary bounce area.
1.3560: Main target — previous demand zone.
Trade Idea:
Sell below 1.3720
TP1: 1.3639
TP2: 1.3560
SL: Above 1.3750 (above resistance zone)
Summary:
Bias remains bearish as long as the price stays below 1.3725–1.3750 resistance zone. Confirmation of further downside expected on break below 1.3638.
Let me know if you want this as a signal format or turned into an image.
USDCAD trade ideas
USDCAD BUYUSD/CAD returns below 1.3600, with YTD lows, at 1.3540 coming into view
The US Dollar extends its decline for the fourth consecutive day, with the Canadian Dollar supported by a brighter market mood, as the trade deal between the US and Japan provided some certainty about the outlook of global trade and boosted hopes of more such deals.
In the USD/CAD 2025 Forecast, FXStreet analyst Joshua Gibson suggests uncertainty and risk-off sentiment could strengthen the US Dollar (USD) early in 2025, while the Canadian Dollar (CAD) is expected to weaken in the first quarter. However, CAD investors may reassess prospects as the year progresses, focusing on the Federal Reserve (Fed) - Bank of Canada (BoC) policy dynamics.
From a technical point of view, USD/CAD could face a technical ceiling near the 1.4400 level after the Canadian Dollar's sharp 8.5% decline in 2024 sent the pair to 56-month highs. However, technical indicators like the MACD suggest caution, as short positions may only become viable once clear sell signals emerge, likely during the first quarter.
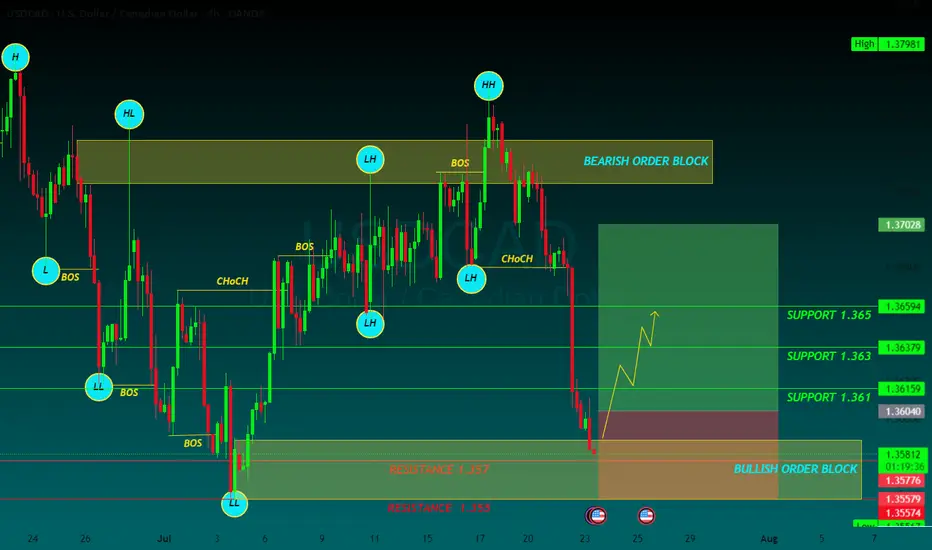
SUPPORT 1.361
SUPPORT 1.353
SUPPORT 1.361
RESISTANCE 1.357
RESISTANCE 1.355
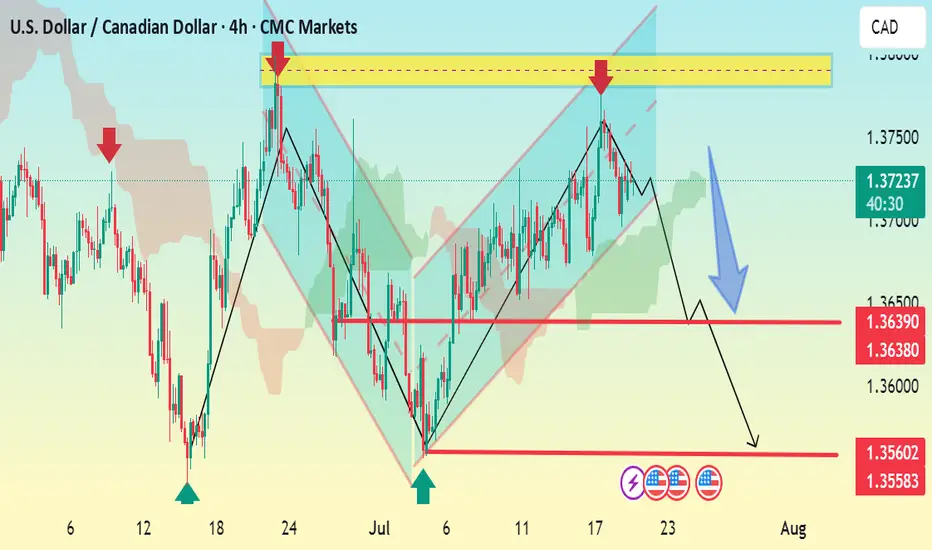
Price channel break. Will the downtrend take place?✏️USDCAD broke the price channel and started forming a bearish wave. The resistance zone of 1.370 played an important role in starting the bearish wave. 1.365 is the immediate support zone that the pair faces. If it wants to extend the decline, it needs to close the h1 candle below this price zone. The convergence between the trendline and the resistance of the Asian session will be a reliable support point for a downtrend to take place.
📉 Key Levels
Support: 1.365-1.356
Resistance: 1.370
SELL Trigger: Rejects bellow 1.370
SELL DCA Trigger: Break support 1.365
Target 1.356
BUY Trigger: Break and trading above resistance 1.370
Leave your comments on the idea. I am happy to read your views.

USDCAD Break the trendline resistance USDCAD has brokend the trendline resistance is likely to to go next resistance as shown in the chart. The set up is valid till the uptrend trendline is respected by the price.

BUY USDCADUSDCAD is currently i a good and clearpoint of interest , i expect the market to push ever since it has already changed its bearish character to bullish , with a supporting trendline liquidity whivch has been swapped out with a bearish push
use proper risk management
and goodluck.. manage ur trades well

USDCAD Buyers In Panic! SELL!
My dear subscribers,
This is my opinion on the USDCAD next move:
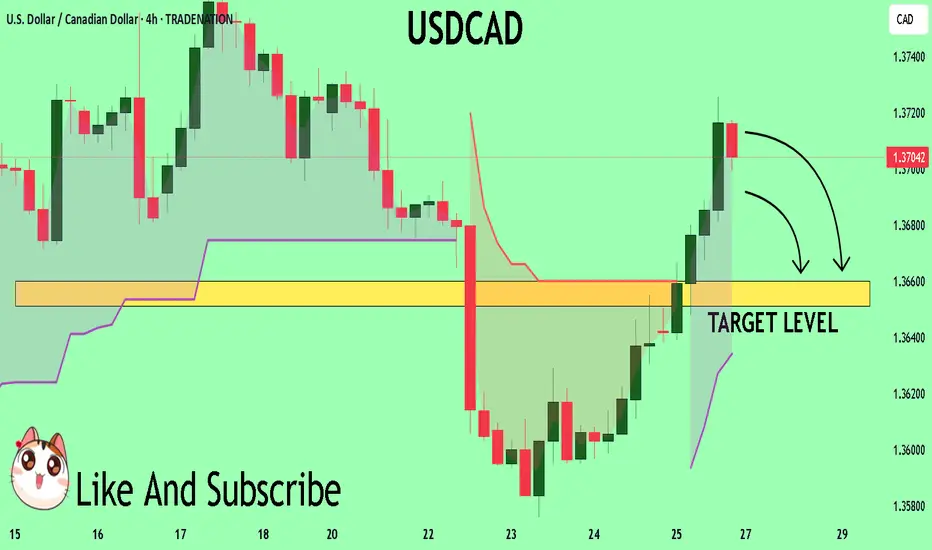
The instrument tests an important psychological level 1.3704
Bias - Bearish
Technical Indicators: Supper Trend gives a precise Bearish signal, while Pivot Point HL predicts price changes and potential reversals in the market.
Target - 1.3660
About Used Indicators:
On the subsequent day, trading above the pivot point is thought to indicate ongoing bullish sentiment, while trading below the pivot point indicates bearish sentiment.
Disclosure: I am part of Trade Nation's Influencer program and receive a monthly fee for using their TradingView charts in my analysis.
———————————
WISH YOU ALL LUCK
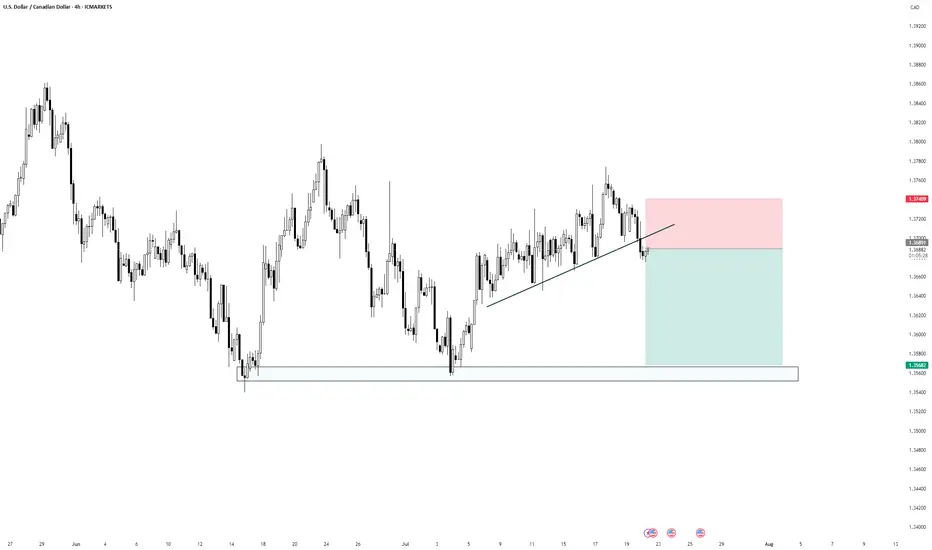
Bearish Break of Trendline + Retest | Short SetupPrice has broken below the ascending trendline, indicating a potential shift in market structure. The recent bearish momentum suggests sellers are gaining control. After the breakout, price is now retesting the underside of the trendline, providing a potential short entry opportunity.
Entry: On retest confirmation below the trendline
Stop Loss: Above the recent swing high (red zone)
Take Profit: Toward the previous demand zone (highlighted blue support area)
This setup aligns with trendline break-and-retest principles and anticipates a move back toward significant demand.
USDCAD Bearish continuation below 1.3670The USDCAD pair is currently trading with a bearish bias, aligned with the broader downward trend. Recent price action shows a retest of the falling resistance, suggesting a continuation breakdown within the downtrend.
Key resistance is located at 1.3670, a prior consolidation zone. This level will be critical in determining the next directional move.
A bearish rejection from 1.3670 could confirm the resumption of the downtrend, targeting the next support levels at 1.3570, followed by 1.3540 and 1.3500 over a longer timeframe.
Conversely, a decisive breakout and daily close above 1.3670 would invalidate the current bearish setup, shifting sentiment to bullish and potentially triggering a move towards 1.3690, then 1.3720.
Conclusion:
The short-term outlook remains bearish unless the pair breaks and holds above 1.3670. Traders should watch for price action signals around this key level to confirm direction. A rejection favours fresh downside continuation, while a breakout signals a potential trend reversal or deeper correction.
This communication is for informational purposes only and should not be viewed as any form of recommendation as to a particular course of action or as investment advice. It is not intended as an offer or solicitation for the purchase or sale of any financial instrument or as an official confirmation of any transaction. Opinions, estimates and assumptions expressed herein are made as of the date of this communication and are subject to change without notice. This communication has been prepared based upon information, including market prices, data and other information, believed to be reliable; however, Trade Nation does not warrant its completeness or accuracy. All market prices and market data contained in or attached to this communication are indicative and subject to change without notice.
USDCAD: Bearish Move From Resistance 🇺🇸🇨🇦
USDCAD is going to retrace from a key daily resistance.
A bearish imbalance candle that the price formed after its test
during the Asian session provides a strong intraday bearish confirmation.
Goal - 1.3707
❤️Please, support my work with like, thank you!❤️
I am part of Trade Nation's Influencer program and receive a monthly fee for using their TradingView charts in my analysis.

Market Analysis: USD/CAD Consolidates GainsMarket Analysis: USD/CAD Consolidates Gains
USD/CAD declined and now consolidates below the 1.3750 level.
Important Takeaways for USD/CAD Analysis Today
- USD/CAD started a fresh decline after it failed to clear the 1.3775 resistance.
- There is a key bullish trend line forming with support at 1.3715 on the hourly chart at FXOpen.
USD/CAD Technical Analysis
On the hourly chart of USD/CAD at FXOpen, the pair climbed toward the 1.3775 resistance zone before the bears appeared. The US Dollar formed a swing high near 1.3774 and recently declined below the 1.3750 support against the Canadian Dollar.
There was also a close below the 50-hour simple moving average and 1.3735. The pair is now consolidating losses below the 50% Fib retracement level of the downward move from the 1.3774 swing high to the 1.3695 low. But the bulls are active near the 1.3700 level.
If there is a fresh increase, the pair could face resistance near the 1.3735 level. The next key resistance on the USD/CAD chart is near the 1.3755 level or the 61.8% Fib retracement level.
If there is an upside break above 1.3755, the pair could rise toward 1.3775. The next major resistance is near the 1.3800 zone, above which it could rise steadily toward 1.3880.
Immediate support is near the 1.3715 level and a key bullish trend line. The first major support is near 1.3675. A close below the 1.3675 level might trigger a strong decline. In the stated case, USD/CAD might test 1.3650. Any more losses may possibly open the doors for a drop toward the 1.3620 support.
This article represents the opinion of the Companies operating under the FXOpen brand only. It is not to be construed as an offer, solicitation, or recommendation with respect to products and services provided by the Companies operating under the FXOpen brand, nor is it to be considered financial advice.

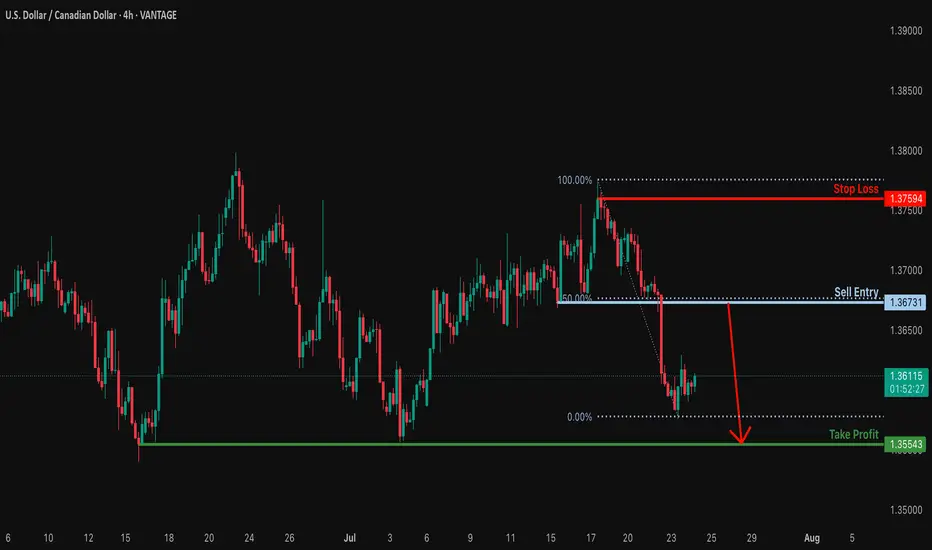
Heading into 50% Fibonacci resistance?USD/CAD is rising towards the resistance which is a pullback reistance that lines up with the 50% Fibonacci retracement and could reverse from this level to our take profit.
Entry: 1.3673
Why we like it:
There is a pullback resistance that lines up with the 50% Fibonacci retracement.
Stop loss: 1.3759
Why we like it:
There is a swing high resistance.
Take profit: 1.3554
Why we like it:
There is a multi swing low support.
Enjoying your TradingView experience? Review us!
Please be advised that the information presented on TradingView is provided to Vantage (‘Vantage Global Limited’, ‘we’) by a third-party provider (‘Everest Fortune Group’). Please be reminded that you are solely responsible for the trading decisions on your account. There is a very high degree of risk involved in trading. Any information and/or content is intended entirely for research, educational and informational purposes only and does not constitute investment or consultation advice or investment strategy. The information is not tailored to the investment needs of any specific person and therefore does not involve a consideration of any of the investment objectives, financial situation or needs of any viewer that may receive it. Kindly also note that past performance is not a reliable indicator of future results. Actual results may differ materially from those anticipated in forward-looking or past performance statements. We assume no liability as to the accuracy or completeness of any of the information and/or content provided herein and the Company cannot be held responsible for any omission, mistake nor for any loss or damage including without limitation to any loss of profit which may arise from reliance on any information supplied by Everest Fortune Group.
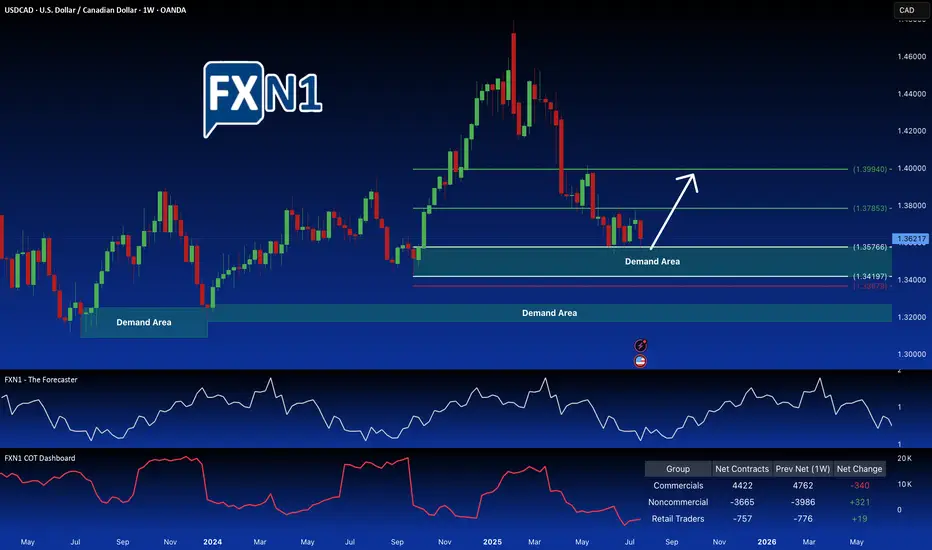
USDCAD Trade Idea: Potential for Further GainsI've initiated a long position on USDCAD at the retest of the key demand zone at 1.35766. Positive indicators support this trade: non-commercial traders are also accumulating long positions, and a notable shift is observed in the CAD futures market, with commercials moving from a bearish to a potentially bullish stance. Furthermore, seasonal trends favor a USD strengthening against the CAD. A further drop in price could present another attractive entry point at a lower demand zone.
✅ Please share your thoughts about USD/CAD in the comments section below and HIT LIKE if you appreciate my analysis. Don't forget to FOLLOW ME; you will help us a lot with this small contribution.
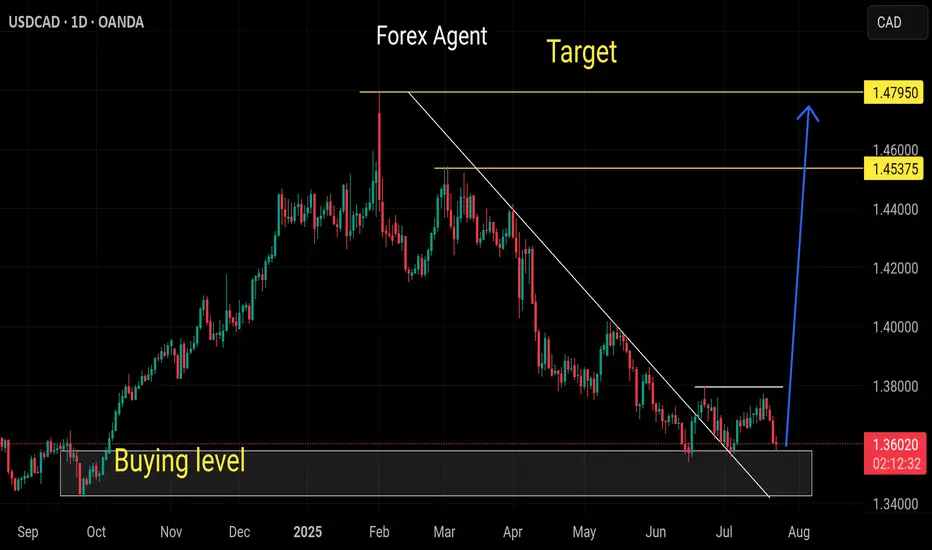
Strong buy usdcadStrong bullish wave expected from this buy zone
Wait to sweep low then buy with short time confirmation
Weekly and monthly still oversold pair
USDCAD LongsEntry
1.3704
Stoploss at the Daily support
1.36661
TargetMarket structure daily high
1.38000
Commitment of traders data showed increase Canadian $ selling and increase USD buying pressure.

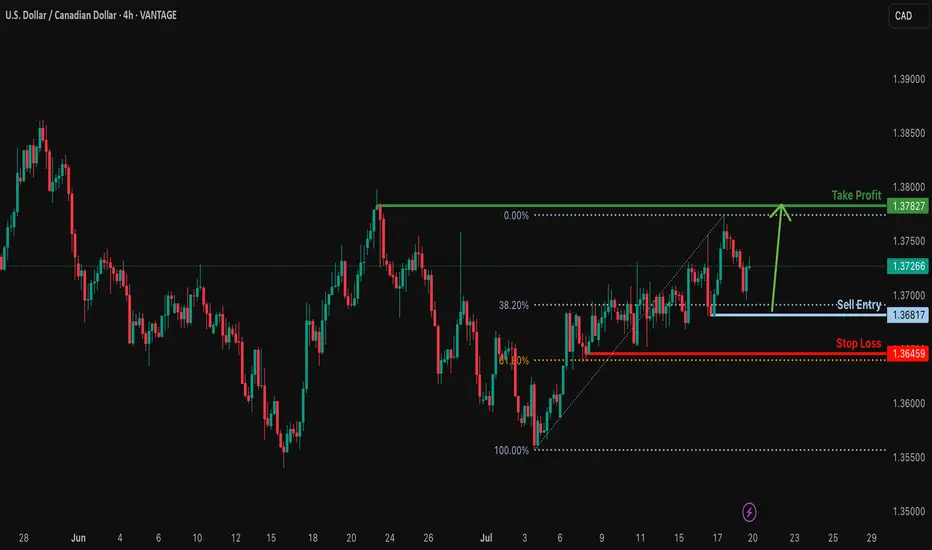
Bullish bounce off pullback support?USD/CAD is falling towards the support level which is a pullback support that lines up with the 38.2% Fibonacci retracement and could bounce from this level to our take profit.
Entry: 1.3681
Why we like it:
There is a pullback support level that aligns with the 38.2% Fibonacci retracement.
Stop loss: 1.3645
Why we like it:
There is a pullback support that lines up with the 61.8% Fibonacci retracement.
Take profit: 1.3782
Why we like it:
There is a pullback resistance.
Enjoying your TradingView experience? Review us!
Please be advised that the information presented on TradingView is provided to Vantage (‘Vantage Global Limited’, ‘we’) by a third-party provider (‘Everest Fortune Group’). Please be reminded that you are solely responsible for the trading decisions on your account. There is a very high degree of risk involved in trading. Any information and/or content is intended entirely for research, educational and informational purposes only and does not constitute investment or consultation advice or investment strategy. The information is not tailored to the investment needs of any specific person and therefore does not involve a consideration of any of the investment objectives, financial situation or needs of any viewer that may receive it. Kindly also note that past performance is not a reliable indicator of future results. Actual results may differ materially from those anticipated in forward-looking or past performance statements. We assume no liability as to the accuracy or completeness of any of the information and/or content provided herein and the Company cannot be held responsible for any omission, mistake nor for any loss or damage including without limitation to any loss of profit which may arise from reliance on any information supplied by Everest Fortune Group.
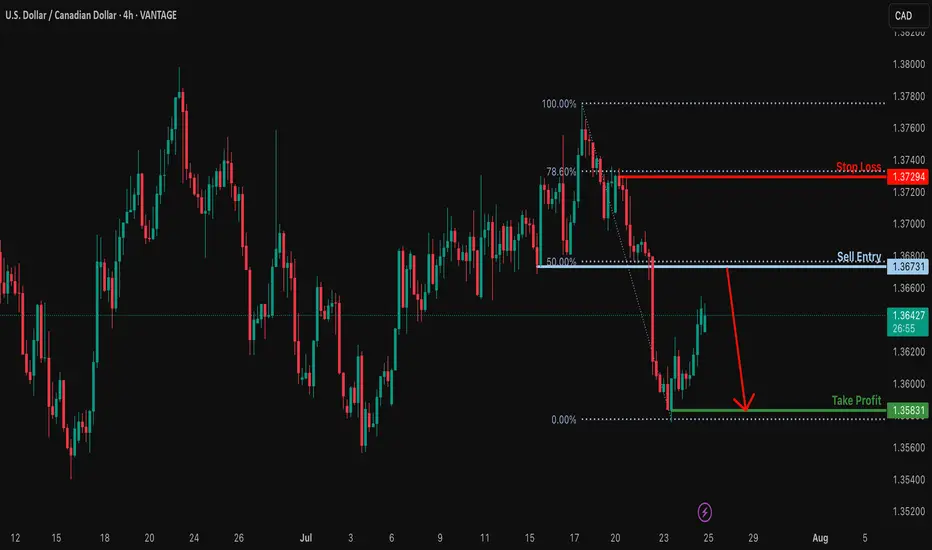
Heading into 50% Fibonacci resistance?USD/CAD is rising towards the resistance level, which serves as a pullback resistance that aligns with the 50% Fibonacci retracement and could reverse from this level to our take-profit target.
Entry: 1.3673
Why we like it:
There is a pullback resistance that lines up with the 50% Fibonacci retracement.
Stop loss: 1.3729
Why we like it:
There is a pullback resistance that lines up with the 78.6% Fibonacci retracement.
Take profit: 1.3583
Why we like it:
There is a swing low support.
Enjoying your TradingView experience? Review us!
Please be advised that the information presented on TradingView is provided to Vantage (‘Vantage Global Limited’, ‘we’) by a third-party provider (‘Everest Fortune Group’). Please be reminded that you are solely responsible for the trading decisions on your account. There is a very high degree of risk involved in trading. Any information and/or content is intended entirely for research, educational and informational purposes only and does not constitute investment or consultation advice or investment strategy. The information is not tailored to the investment needs of any specific person and therefore does not involve a consideration of any of the investment objectives, financial situation or needs of any viewer that may receive it. Kindly also note that past performance is not a reliable indicator of future results. Actual results may differ materially from those anticipated in forward-looking or past performance statements. We assume no liability as to the accuracy or completeness of any of the information and/or content provided herein and the Company cannot be held responsible for any omission, mistake nor for any loss or damage including without limitation to any loss of profit which may arise from reliance on any information supplied by Everest Fortune Group.
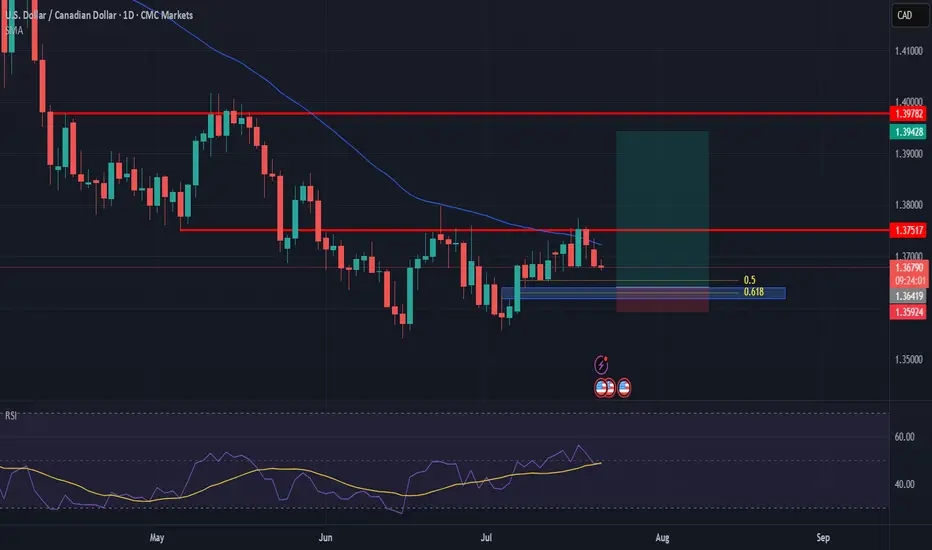
USDCAD possible 300pips ideaWe have this double bottom formation, re-tested the neckline at 1.3750
We could see a higher low forming around the 50% to 61% fib.
So area of interest to go long here would be at 1.3650 to 1.3620
Will update if oportunity to get in shows up.
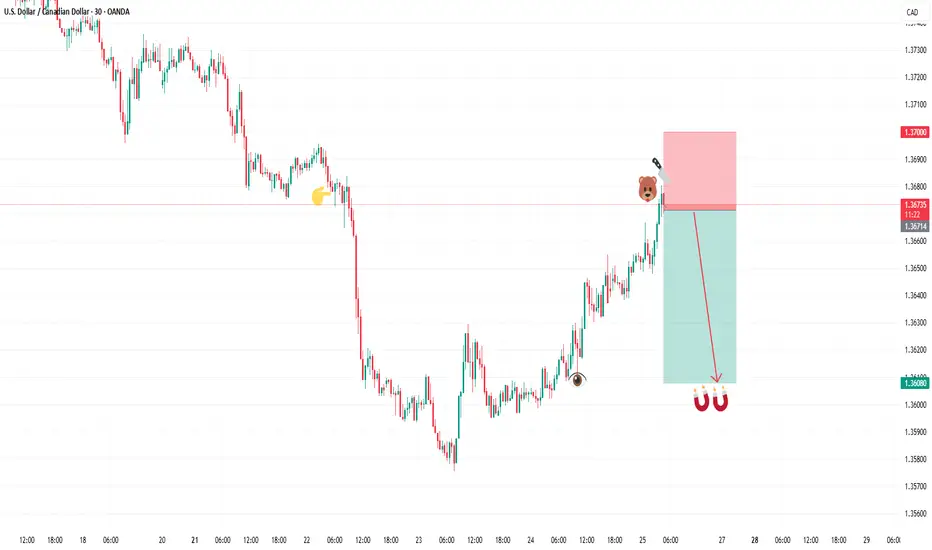
SELL USDCADIn todays session we are monitoring USDCAD for selling opportunities, we have our first entry at 1.36719 and our target is 1.36080 our stop is above 1.3700 , use proper risk management and risk what you can afford. Cheers fam.
USDCAD SELLUSD/CAD rallies to 1.3680 as the market focuses on a hawkish Fed
The US Dollar extends its recovery for the second consecutive day, supported by strong US data. Upbeat US business activity and Jobless Claims support the Fed's "wait and see" rhetoric. In Canada, the weak Retail Sales data keep hopes for a BoC rate cut alive.
The year will be politically marked by Trump’s return to the White House. A Republican government is seen as positive for financial markets, but Trump’s pledge to cut taxes and impose tariffs on foreign goods and services may introduce uncertainty to both the political and economic landscape.
Canada’s political crisis peaked in late 2024 with a no-confidence vote against Prime Minister Justin Trudeau, leading to snap elections and a weakened Liberal minority government. Policy uncertainty and economic challenges dominate 2025’s outlook, raising concerns over market stability and investor confidence.
The BoC is set to continue easing interest rates through 2025, at least at a faster pace than the Fed is expected to, which could apply pressure on CAD’s already-rising rate differential.
SUPPORT 1.36991
SUPPORT 1.36739
SUPPORT 1.36495
RESISTANCE 1.37346
RESISTANCE 1.37455

USDCAD: Long Trading Opportunity
USDCAD
- Classic bullish pattern
- Our team expects retracement
SUGGESTED TRADE:
Swing Trade
Buy USDCAD
Entry - 1.3618
Stop - 1.3586
Take - 1.3685
Our Risk - 1%
Start protection of your profits from lower levels
Disclosure: I am part of Trade Nation's Influencer program and receive a monthly fee for using their TradingView charts in my analysis.
❤️ Please, support our work with like & comment! ❤️

USD/CAD BULLS WILL DOMINATE THE MARKET|LONG
Hello, Friends!
USD/CAD pair is in the uptrend because previous week’s candle is green, while the price is clearly falling on the 4H timeframe. And after the retest of the support line below I believe we will see a move up towards the target above at 1.374 because the pair is oversold due to its proximity to the lower BB band and a bullish correction is likely.
Disclosure: I am part of Trade Nation's Influencer program and receive a monthly fee for using their TradingView charts in my analysis.
✅LIKE AND COMMENT MY IDEAS✅

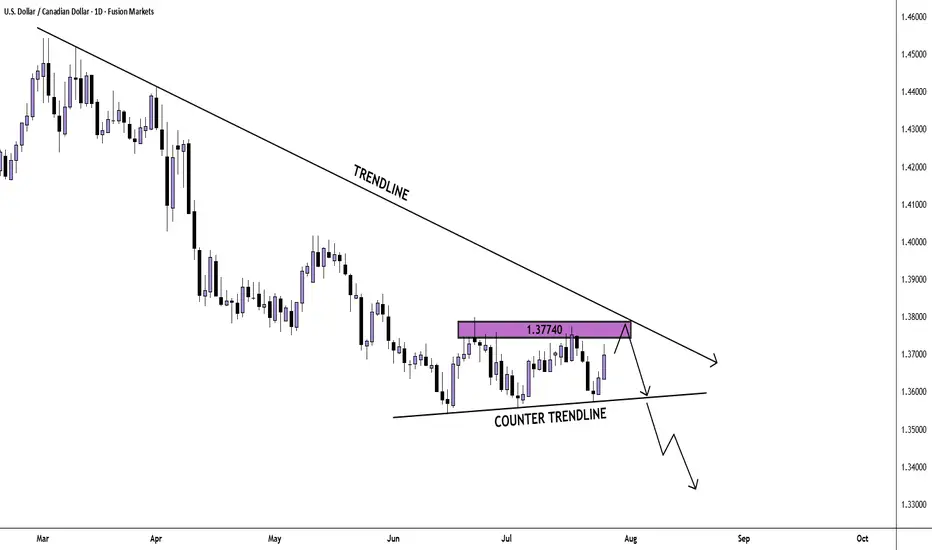
USD/CAD Daily Chart AnalysisFrom the bigger picture we see that sellers are dominating the market. Currently, price looks to be in a correction phase and twice has found resistance at the 1.37740 price point.
If price finds resistance there again, we may see a breakout and another bearish impulse.
If you agree with this analysis, look for a trade that meets your strategy rules.
USDCAD Bearish Breakout!
HI,Traders !
#USDCAD was trading along
The rising support line but
Now we are seeing a bearish
Breakout so we are bearish
Biased and we will be expecting
A further bearish move down !
Comment and subscribe to help us grow !
