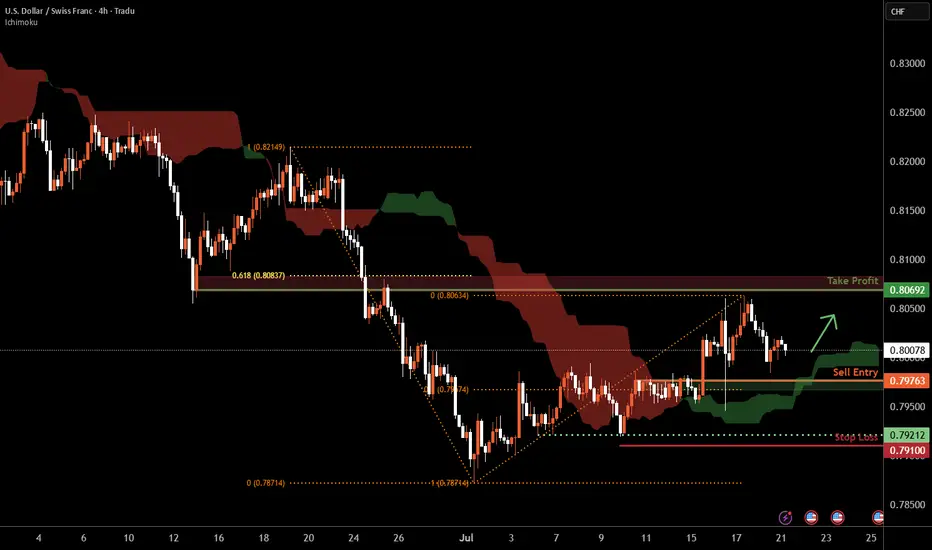
USD/CHF H4 | Pullback support at 50% Fibonacci retracementUSD/CHF is falling towards a pullback support and could potentially bounce off this level to climb higher.
Buy entry is at 0.7976 which is a pullback support that aligns with the 50% Fibonacci retracement.
Stop loss is at 0.7910 which is a level that lies underneath a multi-swing-low support.
Take profit is at 0.8069 which is an overlap resistance that aligns closely with the 61.8% Fibonacci retracement.
High Risk Investment Warning
Trading Forex/CFDs on margin carries a high level of risk and may not be suitable for all investors. Leverage can work against you.
Stratos Markets Limited (tradu.com ):
CFDs are complex instruments and come with a high risk of losing money rapidly due to leverage. 66% of retail investor accounts lose money when trading CFDs with this provider. You should consider whether you understand how CFDs work and whether you can afford to take the high risk of losing your money.
Stratos Europe Ltd (tradu.com ):
CFDs are complex instruments and come with a high risk of losing money rapidly due to leverage. 66% of retail investor accounts lose money when trading CFDs with this provider. You should consider whether you understand how CFDs work and whether you can afford to take the high risk of losing your money.
Stratos Global LLC (tradu.com ):
Losses can exceed deposits.
Please be advised that the information presented on TradingView is provided to Tradu (‘Company’, ‘we’) by a third-party provider (‘TFA Global Pte Ltd’). Please be reminded that you are solely responsible for the trading decisions on your account. There is a very high degree of risk involved in trading. Any information and/or content is intended entirely for research, educational and informational purposes only and does not constitute investment or consultation advice or investment strategy. The information is not tailored to the investment needs of any specific person and therefore does not involve a consideration of any of the investment objectives, financial situation or needs of any viewer that may receive it. Kindly also note that past performance is not a reliable indicator of future results. Actual results may differ materially from those anticipated in forward-looking or past performance statements. We assume no liability as to the accuracy or completeness of any of the information and/or content provided herein and the Company cannot be held responsible for any omission, mistake nor for any loss or damage including without limitation to any loss of profit which may arise from reliance on any information supplied by TFA Global Pte Ltd.
The speaker(s) is neither an employee, agent nor representative of Tradu and is therefore acting independently. The opinions given are their own, constitute general market commentary, and do not constitute the opinion or advice of Tradu or any form of personal or investment advice. Tradu neither endorses nor guarantees offerings of third-party speakers, nor is Tradu responsible for the content, veracity or opinions of third-party speakers, presenters or participants.
Trade ideas
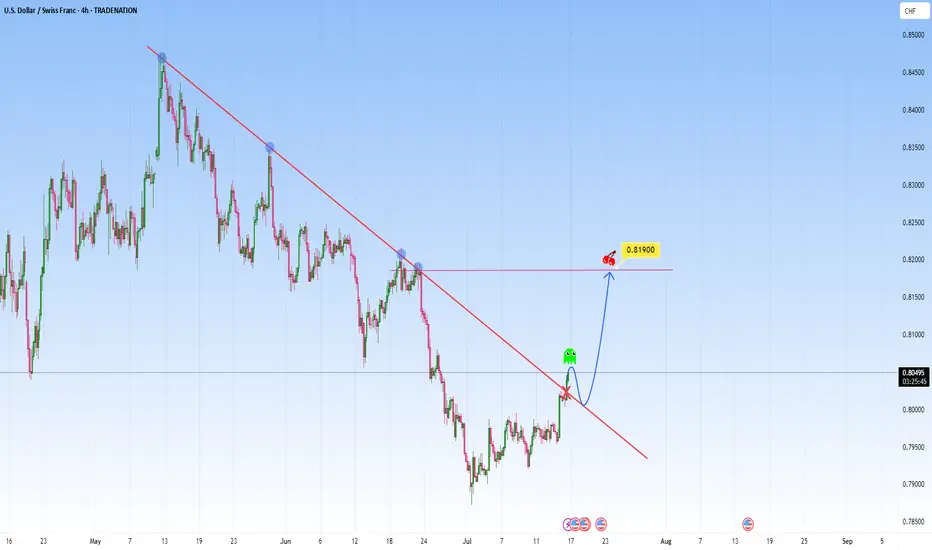
USDCHF: Could be telling a story of break-retest-reversalThe price action on the USDCHF presents an opportunity of structural transition. The descending trendline has acted as dynamic resistance, has contained each rally attempt beautifully. This trendline is marked by multiple rejections, reflected bearish dominance, a controlled downtrend in motion.
The recent movement though could signal a shift. The market has started to break above this descending structure, and it could early suggest that bearish momentum is weakening.
I will be waiting for the price to return to the broken trendline, treating former resistance as newfound support. It’s a confirmation pattern in order to filter false moves, a structure retest that reinforces breakout reliability.
From this base, I am expecting it to target the 0.81900 level, as shown. This area coinciding with horizontal resistance that aligns with previous reactions. Such levels as natural “gravitational pivots”.
An ideal approach here would involve observing the character of the pullback. If the market returns to the trendline with declining bearish volume and forms higher lows on lower timeframes, it strengthens the bullish case.
The trendline break on the chart is not just a signal, it’s a storyline unfolding. It marks a shift with a story. And if volume, price structure, and timing align as they appear poised to, this move could be the first move in a broader upside correction or trend reversal.
Just sharing my thoughts for the charts, this isn’t financial advice. Always confirm your setups and manage your risk properly.
Disclosure: I am part of Trade Nation's Influencer program and receive a monthly fee for using their TradingView charts in my analysis.
USD CHF LONGOK, Just two trades to start the week, if we have some profit tonight, lets see tomorrow,whats the markes show us

USDCHF ContinuationThe dollar is cooked and most Americans are not even aware. Anyways, we will be selling USDCHF this week. A massive bearish flag has emerged on the H4 chart.

USD/CHF LongPrice broke structure and retraced back to a major support area that was resistance in the past the bulls are stepping in this week.
H4 LongUSDCHF is touching levels that it only touched in 2011. Its presently sitting on a very strong support. We expect a very long retracement which will last the remainder of 2025.
USDCHF in Uptrend ContinuationBuy Limit
Entry Price 0.7995
Stop Loss 0.7968
Risk 1%
Lot Size 0.74
TP (1RR) 0.8022
TP (3RR) 0.8076

Buy usdchfStrong buy expected from marked level
Already oversold in months chart
Here strong bullish correction needed

I think this area is a perfect to get buy.by daily bios it's a possibility to get higher...I'm looking for .75 of fibonacci to enter the market.

USDCHF The Target Is DOWN! SELL!
My dear followers,
I analysed this chart on USDCHF and concluded the following:
The market is trading on 0.8050 pivot level.
Bias - Bearish
Technical Indicators: Both Super Trend & Pivot HL indicate a highly probable Bearish continuation.
Target - 0.7970
Safe Stop Loss - 0.8093
About Used Indicators:
A super-trend indicator is plotted on either above or below the closing price to signal a buy or sell. The indicator changes color, based on whether or not you should be buying. If the super-trend indicator moves below the closing price, the indicator turns green, and it signals an entry point or points to buy.
Disclosure: I am part of Trade Nation's Influencer program and receive a monthly fee for using their TradingView charts in my analysis.
———————————
WISH YOU ALL LUCK
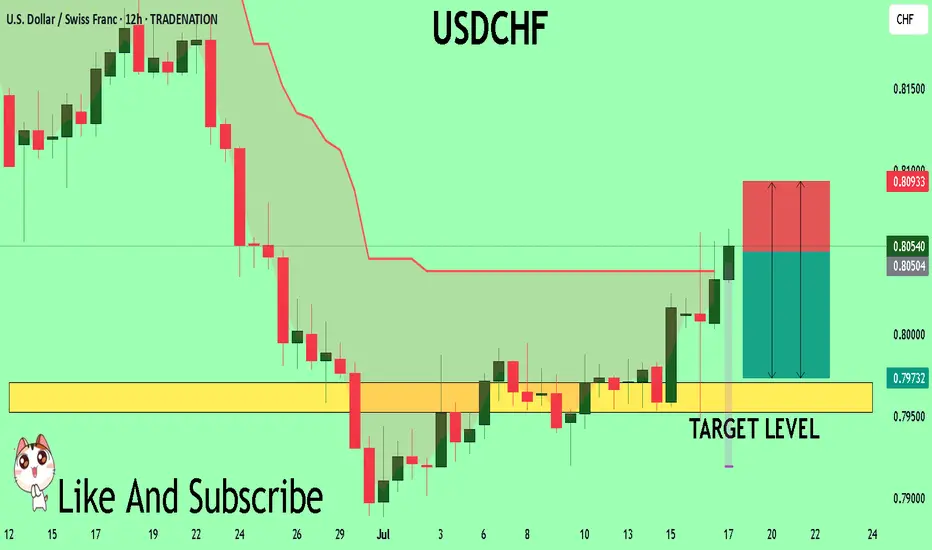
Still looking to sell on rallies — nothing’s changedStill looking to sell on rallies — nothing’s changed. The level on the chart? That’s where buyers jumped in before. Makes sense to target it again.
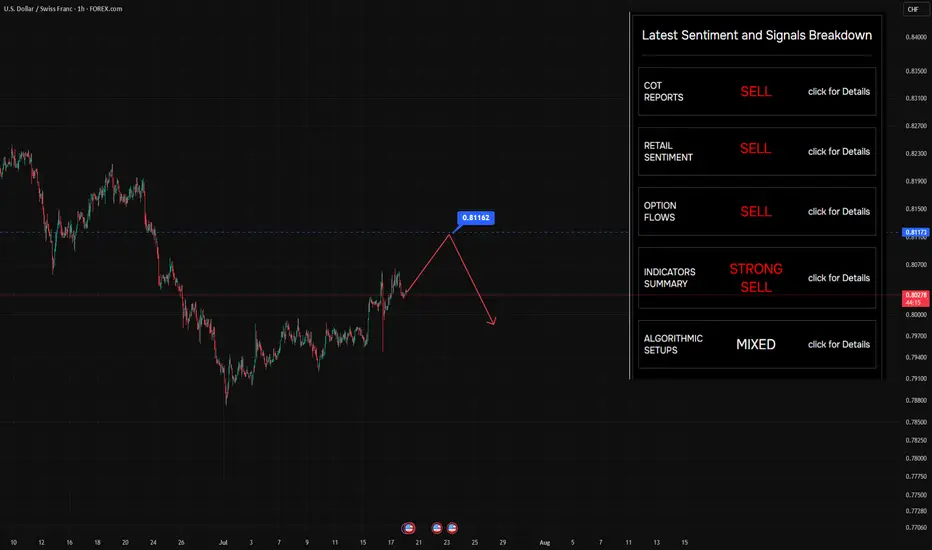
So… why do we say there are "suffering buyers" at this level?
Let’s rewind a bit (see Chart #2) and imagine price at the point marked on the chart.
At that moment, price had clearly returned to a visible local level — 0.8123 — a zone that naturally attracted traders to jump in on the fly , or triggered limit orders .
But here’s what happened next:
Selling pressure overpowered buying interest — and price moved swiftly lower .
That’s when those buyers got caught.
That’s when the pain started.
🔍 What Makes This Level Special?
Broker data from open sources confirms that open positions are still sitting at this level — meaning a lot of traders are underwater, hoping for a recovery that may never come.
It’s not just technical structure.
It’s crowded sentiment , failed expectations , and trapped capital — all wrapped into one.
🧠 This is what we call a "suffering trader" zone — and it often becomes a magnet for future selling .
📌 Follow along for more breakdowns on flow, positioning, and market sentiment .
USDCHF long term bullish playHello,
The USDCHF is back to where it last traded in mid 2011. This reflects a significant weakening of the U.S. dollar against the Swiss franc, erasing over a decade of gains. It suggests growing investor demand for safe-haven assets like the franc — possibly driven by concerns around U.S. interest rate policy, inflation trends, or broader global uncertainty. The last time the dollar was this weak against the franc was more than 13 years ago.
While a weaker dollar is seen as good for the United States, we see a long term buy opportunity for this pair from the current level based on technical analysis. The pair is now trading at the bottom of the range.
Next week will be an important time for this pair as we wait for the inflation data. This will be key in guiding what the FED might do during the next meeting towards the end of the month.

USDCHF LongUSDCHF is now net long on the regression break.
I am using my EA on this pair as it has positive roll long.
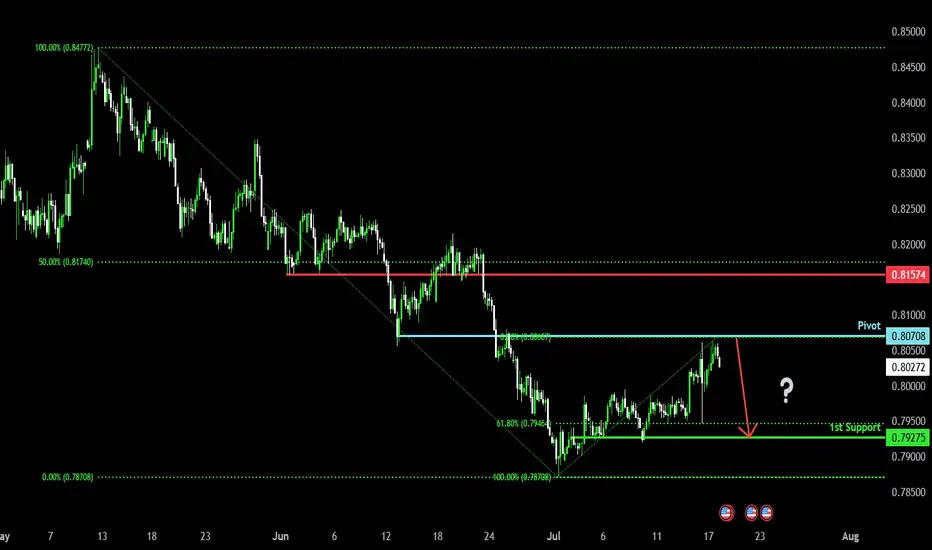
Bearish reversal off pullback resistance?The Swissie (USD/CHF) has rejected off the pivot and could drop to the 1st support which is a pullback support that is slightly below the 61.8% Fibonacci retracement.
Pivot: 0.8070
1st Support: 0.7927
1st Resistance: 0.8157
Risk Warning:
Trading Forex and CFDs carries a high level of risk to your capital and you should only trade with money you can afford to lose. Trading Forex and CFDs may not be suitable for all investors, so please ensure that you fully understand the risks involved and seek independent advice if necessary.
Disclaimer:
The above opinions given constitute general market commentary, and do not constitute the opinion or advice of IC Markets or any form of personal or investment advice.
Any opinions, news, research, analyses, prices, other information, or links to third-party sites contained on this website are provided on an "as-is" basis, are intended only to be informative, is not an advice nor a recommendation, nor research, or a record of our trading prices, or an offer of, or solicitation for a transaction in any financial instrument and thus should not be treated as such. The information provided does not involve any specific investment objectives, financial situation and needs of any specific person who may receive it. Please be aware, that past performance is not a reliable indicator of future performance and/or results. Past Performance or Forward-looking scenarios based upon the reasonable beliefs of the third-party provider are not a guarantee of future performance. Actual results may differ materially from those anticipated in forward-looking or past performance statements. IC Markets makes no representation or warranty and assumes no liability as to the accuracy or completeness of the information provided, nor any loss arising from any investment based on a recommendation, forecast or any information supplied by any third-party.
Buy usdchfStrong buy expected with minimum 700 pips target
Monthly and weekly still oversold pair
Strong bullish correction expected from this strong buying area
Wait to break the inner week down trend then enter into buy trade


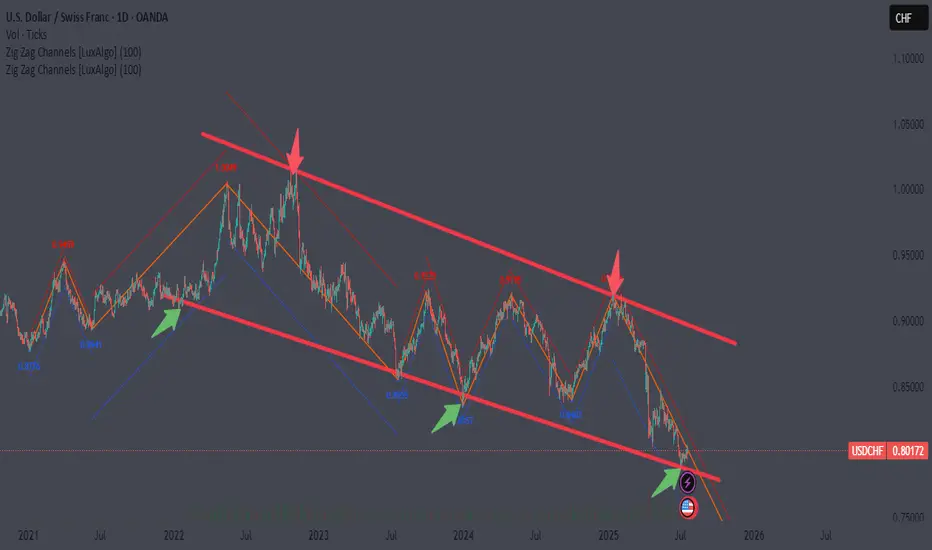
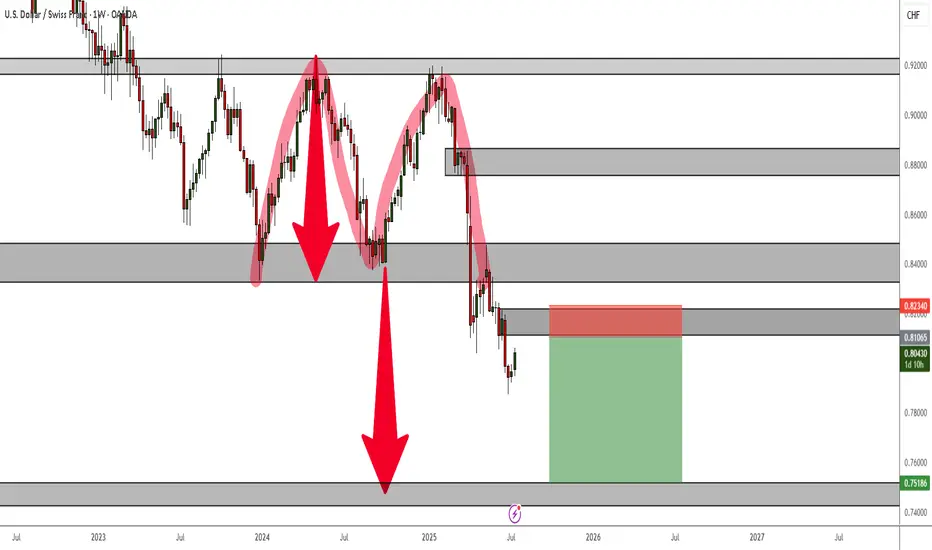
USDCHF Double Top Rejection - Bearish Setup for Long Term TradeA Double Top Rejection on the weekly TF is currently at play and despite the current bullish correction, the trend is still very much bearish.
For long-term or position traders, this is an ideal setup to take and hold.
Short USDCHFMain trend has been bearish and we currently testing the upper bound. If it holds a sell will be valid and we ride the wave

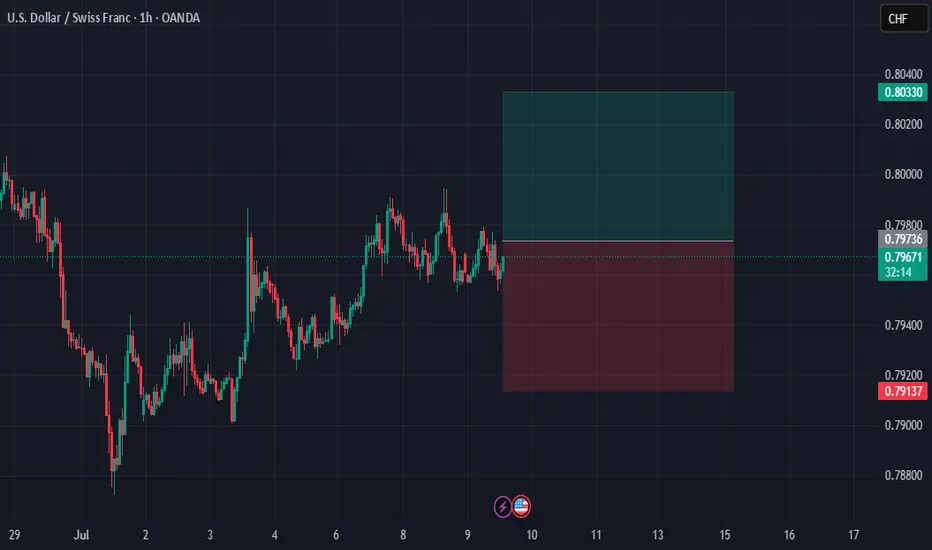
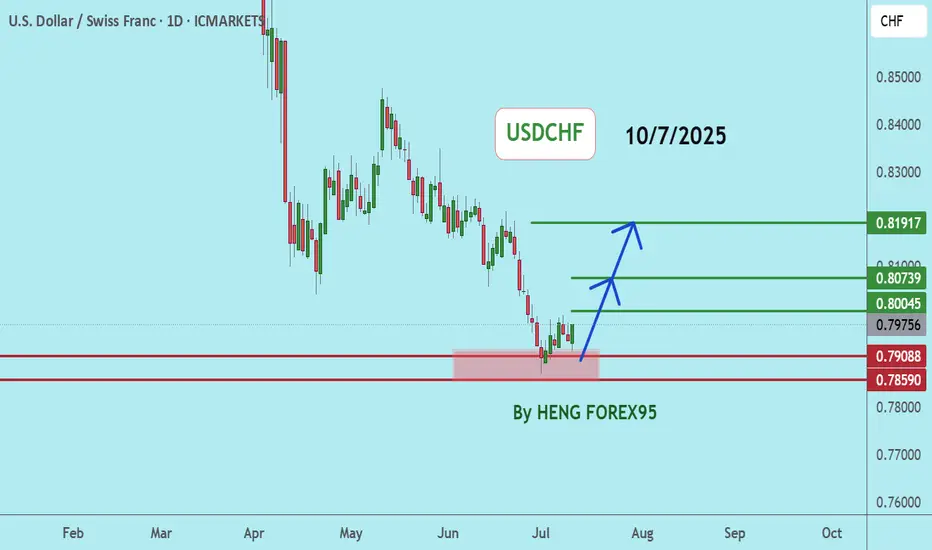
USDCHFUSDCHF If the price can stay above 0.78590, it is expected that the price will rebound. Consider buying in the red zone.
🔥Trading futures, forex, CFDs and stocks carries a risk of loss.
Please consider carefully whether such trading is suitable for you.
>>GooD Luck 😊
❤️ Like and subscribe to never miss a new idea!
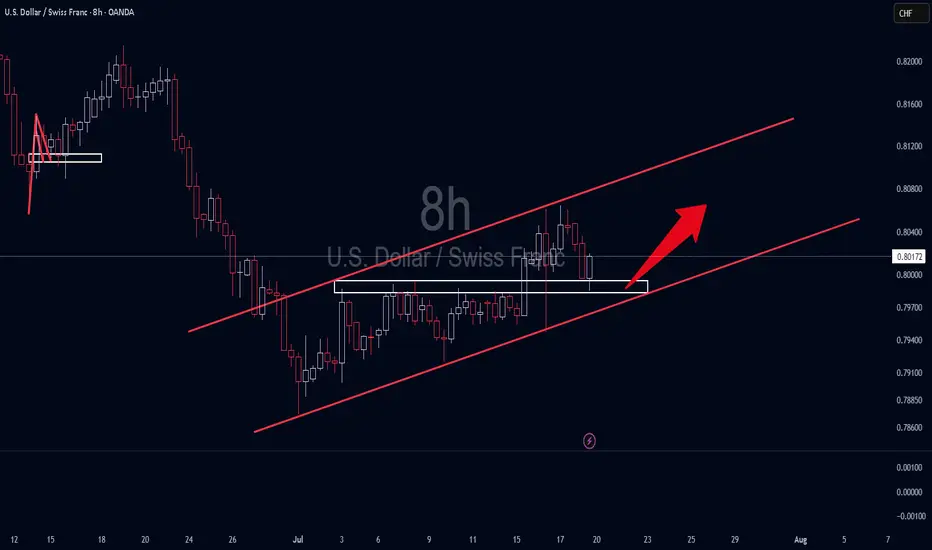
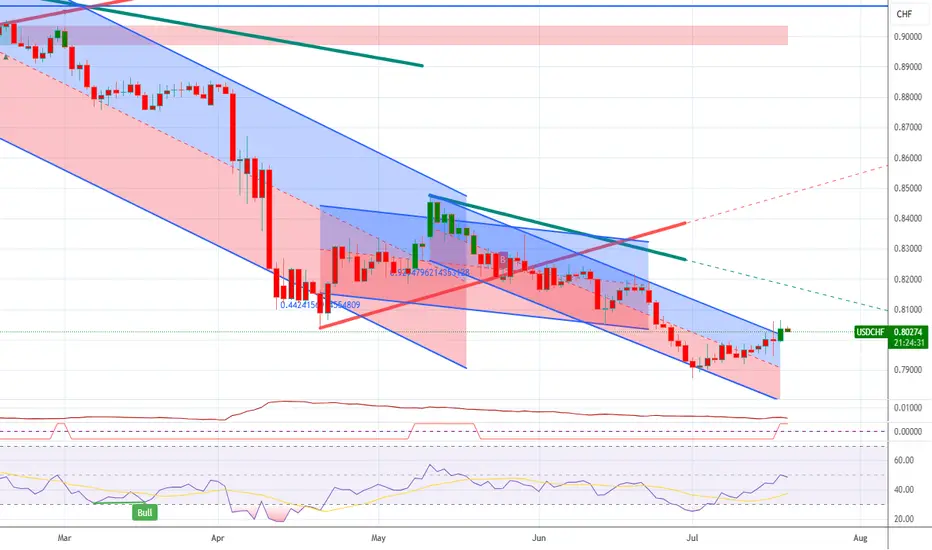
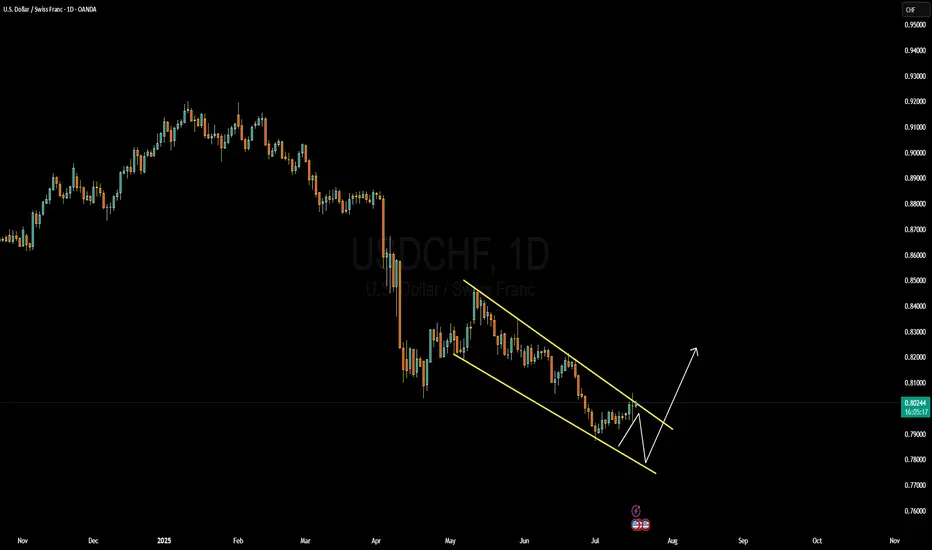
USDCHF Forming Descending ChannelUSDCHF is currently moving within a well-defined descending channel on the daily timeframe. The structure has been respecting this pattern for several months, and we are now approaching a potential breakout zone. Price recently tapped the midline of the channel and showed early signs of bullish rejection. I'm closely monitoring this pair as it builds momentum for a possible bullish reversal, either from a deeper retest at the lower channel boundary or directly breaking above the upper trendline.
On the fundamental side, today's shift in sentiment around the US dollar is quite clear. After a series of weaker US inflation reports and growing market anticipation of a Fed rate cut, USD has come under pressure. However, the Swiss franc is also showing signs of weakness, especially after the Swiss National Bank became the first major central bank to cut interest rates earlier this year and is likely to remain dovish through the remainder of 2025. This monetary policy divergence creates space for USDCHF to rally as investors price in a potential stabilization or rebound in the dollar.
Risk sentiment also plays a role here. With global equities slightly pulling back and geopolitical tensions simmering, safe haven demand is mixed. While CHF typically benefits in risk-off environments, the lack of recent SNB hawkishness gives USDCHF bulls a clearer edge, especially if US data stabilizes or improves.
Technically, I’m anticipating a potential false break to the downside before a sharp bullish wave toward 0.8300 and beyond. Momentum indicators are flattening, and with volume starting to pick up on bullish candles, this setup has potential. I’ll be looking to add further confirmation as price approaches the lower trendline or breaks out with clean structure. Keep a close eye — this setup could turn into a strong profit opportunity in the coming days.
Buy usdchf Strong buy expected
Weekly and monthly oversold pair
Here time reached to change the trend
Strong bullish correction expected from this area

7.16 WATCH USD/CHF 4H CHARTThis one came onto the radar yesterday, we want to see a pullback into the strong S/R zone, then see ALL of the indicators line up...(engulfing candle, volume, momentum, 50 EMA) to tell us this market is ready to go up. Keep watching for now.
