USDCHF trade ideas

SELLGod First
Minimum Risk Maximum Reward
Action Backed Believe
# faith, strategy, and execution all in one #
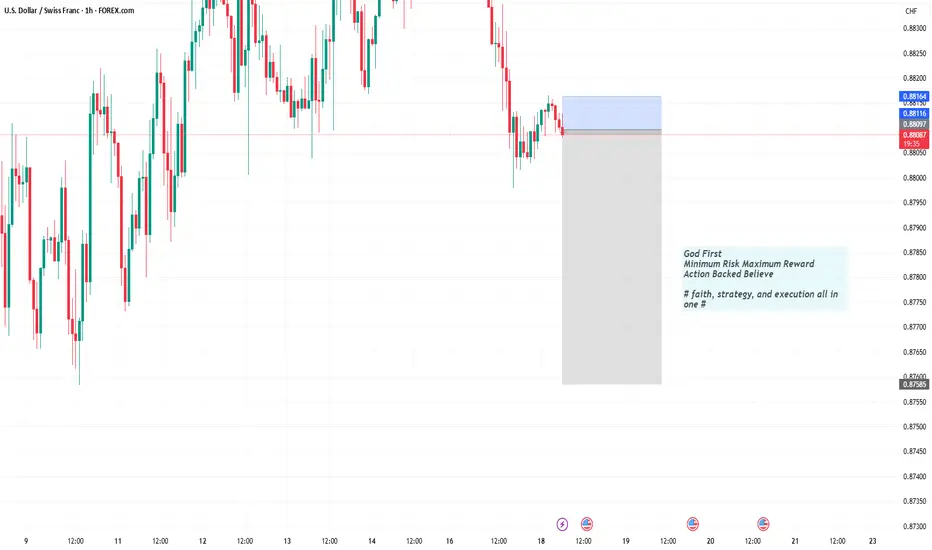
usdchf sell tradeThe Relative Strength Index (RSI) is showing a downward trend, indicating weakening momentum. Additionally, the Moving Average Convergence Divergence (MACD) is showing a bearish crossover, further supporting the potential for a downward move

CHF/USD 4H Analysis - Potential Bearish Reversal Setup
🔹 Market Structure & Price Action:
The price has been trending upwards inside a rising channel, forming higher highs and higher lows.
Recently, price tapped into a key resistance zone (black box), indicating a potential reversal.
A possible bearish correction could unfold from this level.
📉 Bearish Scenario:
If the price fails to hold the resistance, a bearish rejection could drive price downward.
The first major support target aligns with the previous demand zone around 1.10700.
A further drop could test the 1.09100 support area, as shown in the green zones.
📈 Bullish Alternative:
A break and hold above resistance could invalidate the bearish setup and signal further upside movement.
🔻 Trading Plan:
Sell bias near resistance with confirmations (e.g., rejection wicks, bearish engulfing, trendline break).
Targeting the marked support levels.
Invalidation if price breaks and closes above the resistance.

USD_CHF BEARISH BREAKOUT|SHORT|
✅USD_CHF is trading in a
Downtrend and we are seeing
A bearish breakout from the
Bearish wedge pattern which
Is why we are bearish biased and
We will be expecting the pair
To go further down
SHORT🔥
✅Like and subscribe to never miss a new idea!✅

USDCHF 4H timeframe forecastWe have an impulse pattern down following all of the Elliott Wave Theory Guidelines. Anticipating a further decline to make a 5th wave on the blue degree potentially breaks the previous lows.

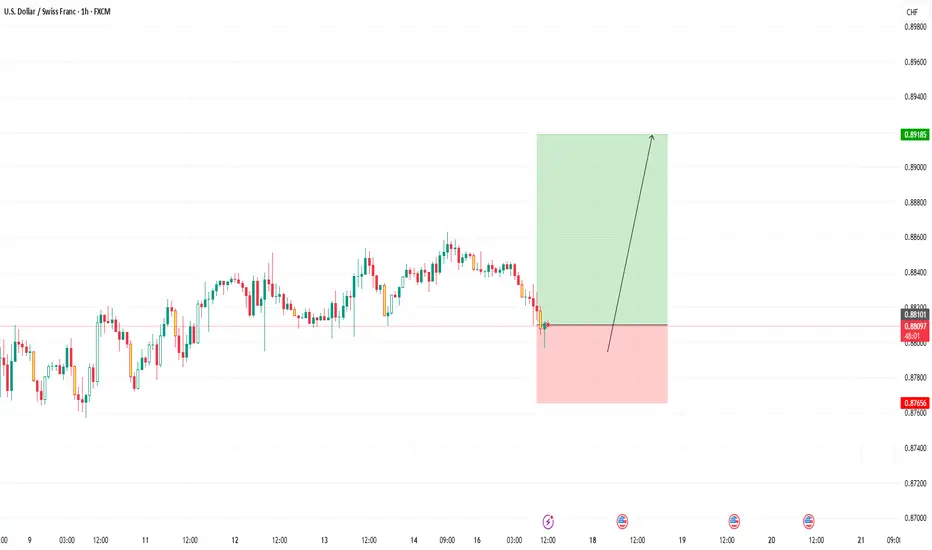
USDCHF Buy Opportunity!Market Structure Analysis:
Trend: The market has been in a short-term downtrend but is showing signs of a potential reversal.
Support Zone: Around 0.8800, where price has reacted strongly.
Resistance Zone: Next target area is 0.8918, and a strong resistance is near 0.9030.
Price Action:
The price tested the 0.8800 level and is forming a bullish setup.
The long lower wick on the recent candlestick indicates rejection from support.
A potential bullish breakout could occur if momentum continues.
🔹 Trade Setup: BUY (Bullish Reversal)
🔹 Entry: Buy at 0.8810 - 0.8800
🔹 Stop Loss: 0.8765 (Below recent low)
🔹 Take Profit 1: 0.8918 (Previous resistance)
🔹 Take Profit 2: 0.9025 (Major resistance)
🔹 Risk-Reward Ratio: 1:2 or higher
📌 Alternative Bearish Scenario: If the price breaks below 0.8765, a sell-off toward 0.8720 is possible.
Trade Confirmation:
Look for bullish candlestick formations (e.g., engulfing or pin bar).
Monitor USD fundamentals and market sentiment.

USDCHF: Expecting Bullish Continuation! Here is Why:
Looking at the chart of USDCHF right now we are seeing some interesting price action on the lower timeframes. Thus a local move up seems to be quite likely.
Disclosure: I am part of Trade Nation's Influencer program and receive a monthly fee for using their TradingView charts in my analysis.
❤️ Please, support our work with like & comment! ❤️

USDCHF INTRADAY Rising Wedge formingThe USD/CHF price action exhibits bearish sentiment, supported by the prevailing downtrend. The current intraday swing high at 0.8860 serves as a critical trading level, as the pair shows potential for an oversold rally before facing bearish rejection.
Key Levels to Watch:
Key Resistance: 0.8860 (current intraday swing high)
Immediate Support: 0.8760
Lower Support Levels: 0.8720, 0.8680
Upside Resistance Levels: 0.8890, 0.8930
Bearish Scenario:
An oversold rally toward the 0.8860 level, followed by a bearish rejection, could validate the downtrend and target the immediate support at 0.8760. Continued bearish momentum could extend the decline to 0.8720 and ultimately 0.8680 over the longer timeframe.
Bullish Scenario:
A confirmed breakout above the 0.8860 resistance level, accompanied by a daily close above this mark, would negate the bearish outlook. This scenario could trigger further rallies toward the next resistance levels at 0.8890 and 0.8930.
Conclusion:
The prevailing sentiment remains bearish amid the ongoing downtrend. Traders should closely monitor the 0.8860 level for potential bearish rejections or a bullish breakout. A sustained close above this resistance could signal a shift toward bullish momentum, while failure to break above would reinforce the bearish outlook.
This communication is for informational purposes only and should not be viewed as any form of recommendation as to a particular course of action or as investment advice. It is not intended as an offer or solicitation for the purchase or sale of any financial instrument or as an official confirmation of any transaction. Opinions, estimates and assumptions expressed herein are made as of the date of this communication and are subject to change without notice. This communication has been prepared based upon information, including market prices, data and other information, believed to be reliable; however, Trade Nation does not warrant its completeness or accuracy. All market prices and market data contained in or attached to this communication are indicative and subject to change without notice.

Trading balanceThe price of the asset is in the area of the balance zone. With the prospect of growth to the resistance zone. Targets are in the area of the resistance zone.

FURTHER LONG POSITIONS ON USD/CHFUSD/CHF 1H - I am looking to get involved in this market with further long positions, its just a case of waiting for the confirmation in order to add to our current positions.
This market treated us very well last week generating us with over 4RR in profit, I am wanting to take full advantage of this market again this week. I believe this longer term swing has only just started.
The original trade is currently running + 32 pips. (+ 2%) 2RR
As soon as price trades into this zone and delivers me with the confirmation I need I will be looking to get reintroduced. We want to see price break structure fractally to the upside after a penetration.
A big well done to anyone who jumped in on this last week, what a week we had generating us with some great profits and no drawdown. Any questions drop me a message or comment below!

USD/CHF: Selling the Head & Shoulders BreakdownSpotted a clear H&S pattern on USD/CHF 15m chart!
Selling at 0.8826 with stop above 0.8844.
Target: First 0.8815, then possibly lower to the -0.27 Fib level.
The neckline break looks solid and we're still in the channel. Risk-reward looks good here.
What do you think? Are you bearish on USD/CHF too?
#USDCHF #Forex #TradingIdea

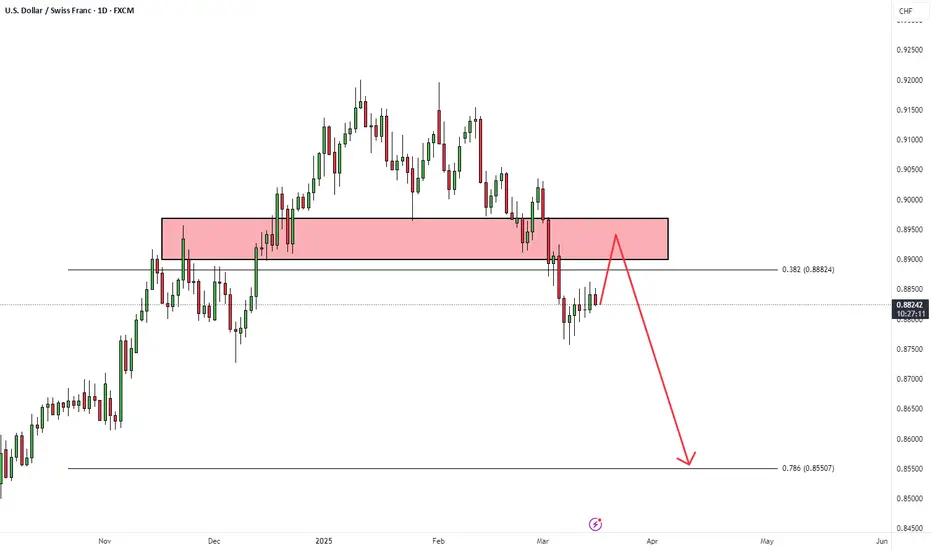
USDCHFHello Traders! 👋
What are your thoughts on USDCHF?
In the daily timeframe, USDCHF has broken a key support level, which has now turned into resistance.
The pair is currently forming a pullback to the broken level, retesting it as resistance.
We expect the price to complete its pullback to the broken level and then continue its decline toward the specified target.
Will USD/CHF resume its downtrend after the pullback, or will buyers regain control? Share your thoughts below!
Don’t forget to like and share your thoughts in the comments! ❤️
USDCHF 1H SHORT IDEAWhile forming a bearish pattern on the USDCHF 1H chart, the price reached and tested the previous key level around 0.88600 before dropping. This also aligned with the Fib 0.618 level. The pattern has now broken, and the price is currently retesting the 0.88394 level. It appears likely to drop further towards the 0.87322 zone, which is both a key level and the starting point of the previous pattern. Volume also aligns with this level.

USDCHF - Bearish Momentum or Reversal?Looking at the Daily Chart, price is currently retesting the 9 EMA after a downward move, which could signal a continuation of selling pressure. The MACD is attempting a bullish crossover, but it hasn’t fully confirmed yet. If price fails to close above the 9 EMA, the bearish bias remains intact.
On the 4H Chart, we see strong selling pressure, with the 9 and 50 EMA acting as dynamic resistance. The MACD is forming a strong sell signal, suggesting momentum is shifting downward. Even if price pushes slightly higher, the accumulation zone above could lead to consolidation, limiting further upside potential.
The 1H Chart doesn’t provide a clear trend direction but MACD is aligning for a stronger sell signal, reinforcing bearish sentiment.
Trade Outlook:
• Bearish Confirmation: If price fails to break above the 4H accumulation zone, we could see further downside.
• Potential Entry: Look for a break & retest of key levels on the 1H or 4H for confirmation.
• Invalidation: A daily close above the 9 EMA would indicate a possible shift in structure.
• Target: The next major support at 0.86433 (Daily Support).
Would love to hear your thoughts! Are we continuing bearish, or will bulls take control? 🚀👇 #USDCHF #Forex #Trading

USDCHFUSDCHF is trading in bearish parallel channel. Recently price retested the broken level and now showing some bearish momentum.. If the sellers took charge then the 1st downside target will be 0.8760 region.

USDCHF - Bearish IdeaUSDCHF is in bearish trend making LH & LL on 4H TF. Price has retraced to 0.5 level of and the trend could continue. Entry can be taken at CMP.

USD/CHF - Bullish Reversal Setup
This 4-hour chart of USD/CHF shows a potential bullish reversal from a key support level.
Support Zone: The price is approaching a strong support level around 1.10193 - 1.12261, where previous price action has reacted.
Reversal Expectation: A bounce from this level could trigger a bullish move toward the 1.15719 resistance level.
Target Projection: If price respects the support, a 3.00% potential upside is expected.
Trading Plan:
Buy Entry: Look for bullish confirmation signals at the support zone.
Stop-Loss: Below the support area to minimize risk.
Take Profit: First target at 1.15719.
Technical Indicators to Watch:
Bullish Candlestick Patterns at support.
RSI / MACD for momentum confirmation.
Trendline Breakout for additional bullish confirmation.

USDCHF 1W IdeaPotential for a bullish pullback on the USDCHF H4 which could lead to a price movement towards the resistance level at 0.95450. BUY levels from 0.88100

USDCHF- Forecast 17-21 March Hello Traders
USDCHF - H4 is Bearish
After a Bearish BOS, i can identify Premium price for possible short positions targeting the newly created swing low.
*Again the 50% level could provide strong resistance. There's valid IMB, Swing point has a clean LQ sweep.

USD/CHF 1HR // 16 March Analysis We can see a potential downtrend on USD/CHF on the 1 hour timeframe.
2 resistance zones have been identified, depending on how the market moves in the coming week and around which area the price touches the trend line, we can look for potential sells around the resistance zones if we can get a good rejection.
A good target could be the 0.87500 zone marked.

