USDCHF great idea Trendline touch the 3rd time
Liquidity sweep
Using my trendline strategies n parthen I really understand this will be a buy here
Using top down analysis its cool 😎
USDCHF trade ideas

Swiss GDP weakened as expected The GDP data released today shows that Switzerland's GDP grew by 0.1% QoQ in 2Q2025, following a stronger expansion of 0.8% in 1Q2025. This result confirms weak growth for the Swiss economy in the latest quarter, as gains in the services sector were offset by a downturn in industrial activity and export pressures, especially related to recent US tariffs. Weak GDP growth and deflation increase the likelihood of continued dovish SNB policy. Any signs of further slowdown or persistent deflation could trigger additional easing, possibly even negative rates again.
Meanwhile, the USD fell due to uncertainty about the Fed's independence, which drove the CHFUSD higher when Trump called to fire Fed Governor Cook.
Technically, the pair is trading near 1.2474, with price action consolidating just above several moving averages (EMA 20/50/100/200), indicating a possible emerging bullish bias if the pair maintains above these levels
Price recently broke above previous resistance at 1.2450–1.2460, pointing toward a short-term bullish trend continuation, with next resistance seen at 1.2500 and support at 1.2400.
By Van Ha Trinh - Financial Market Strategist at Exness

USD/CHF - Sell Trade Setup📉 USD/CHF – Sell Setup Breakdown
🔎 Bias
Currently leaning bearish. Price rejected from a higher-timeframe supply and continues to respect the descending trendline. Structure is pointing toward deeper liquidity grabs before any major reversal.
🏗 Technical Breakdown
Wave Structure: We completed Wave (4) inside a major supply zone and are now unfolding lower.
Liquidity Hunt: Multiple sweeps of liquidity have been taken on the upside. Current price is gravitating toward sell-side liquidity (SSL) marked below.
Fibonacci Confluence: Rejection aligned with the 71% retracement – classic continuation sell level.
Trendline Respect: Every attempt to break higher has been capped by the diagonal resistance.
🎯 Sell Zones
Entry Area: Any retracement back into the minor supply box (grey zone under the trendline).
Target 1: Sell-side liquidity resting below recent equal lows.
Target 2: Extended push toward the bigger demand block lower (the shaded SSS zone).
⚠️ Risk Notes
If price cleanly breaks and holds above the trendline + supply zone, the bearish idea invalidates.
Best confluence comes from waiting for rejection wicks / bearish order flow before entry.

Bullish bounce?USD/CHF is falling towards the support level, which is a pullback support that aligns with the 127.2% Fibonacci extension and the 100% Fibonacci projection and could bounce from this level to our take profit.
Entry: 0.7971
Why we like it:
There is a pullback support that lines up with the 127.2% Fibonacci extension and the 100% Fibonacci projection.
Stop loss: 0.7923
Why we like it:
There is a multi-swing low support.
Take profit: 0.8026
Why we ike it:
There is a pullback resistance.
Enjoying your TradingView experience? Review us!
Please be advised that the information presented on TradingView is provided to Vantage (‘Vantage Global Limited’, ‘we’) by a third-party provider (‘Everest Fortune Group’). Please be reminded that you are solely responsible for the trading decisions on your account. There is a very high degree of risk involved in trading. Any information and/or content is intended entirely for research, educational and informational purposes only and does not constitute investment or consultation advice or investment strategy. The information is not tailored to the investment needs of any specific person and therefore does not involve a consideration of any of the investment objectives, financial situation or needs of any viewer that may receive it. Kindly also note that past performance is not a reliable indicator of future results. Actual results may differ materially from those anticipated in forward-looking or past performance statements. We assume no liability as to the accuracy or completeness of any of the information and/or content provided herein and the Company cannot be held responsible for any omission, mistake nor for any loss or damage including without limitation to any loss of profit which may arise from reliance on any information supplied by Everest Fortune Group.
Please be advised that the information presented on TradingView is provided to Vantage (‘Vantage Global Limited’, ‘we’) by a third-party provider (‘Everest Fortune Group’). Please be reminded that you are solely responsible for the trading decisions on your account. There is a very high degree of risk involved in trading. Any information and/or content is intended entirely for research, educational and informational purposes only and does not constitute investment or consultation advice or investment strategy. The information is not tailored to the investment needs of any specific person and therefore does not involve a consideration of any of the investment objectives, financial situation or needs of any viewer that may receive it. Kindly also note that past performance is not a reliable indicator of future results. Actual results may differ materially from those anticipated in forward-looking or past performance statements. We assume no liability as to the accuracy or completeness of any of the information and/or content provided herein and the Company cannot be held responsible for any omission, mistake nor for any loss or damage including without limitation to any loss of profit which may arise from reliance on any information supplied by Everest Fortune Group.

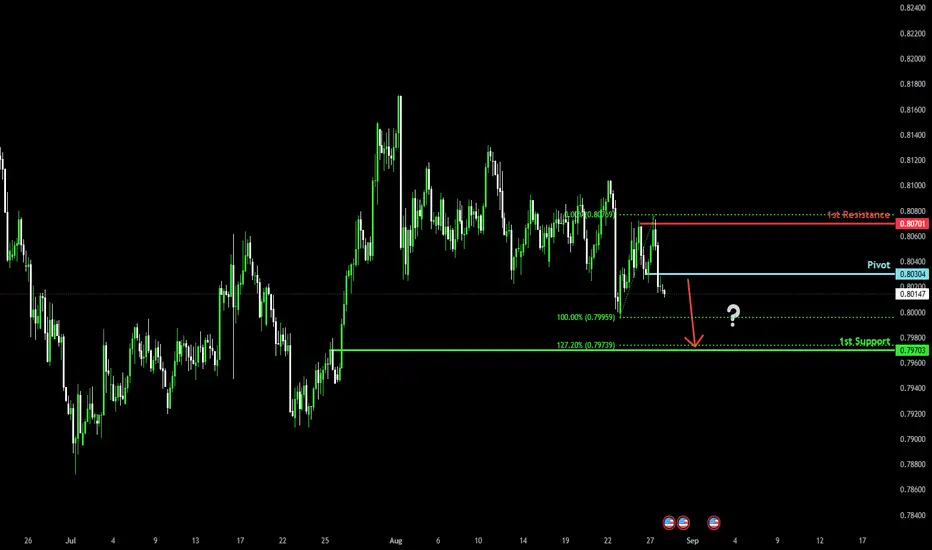
Potential bearish drop?The Swissie (USD/CHF) is rising towards the pivot which is a pullback resistance and could drop to the 1st support.
Pivot: 0.7030
1st Support: 0.7970
1st Resistance: 0.8070
Risk Warning:
Trading Forex and CFDs carries a high level of risk to your capital and you should only trade with money you can afford to lose. Trading Forex and CFDs may not be suitable for all investors, so please ensure that you fully understand the risks involved and seek independent advice if necessary.
Disclaimer:
The above opinions given constitute general market commentary, and do not constitute the opinion or advice of IC Markets or any form of personal or investment advice.
Any opinions, news, research, analyses, prices, other information, or links to third-party sites contained on this website are provided on an "as-is" basis, are intended only to be informative, is not an advice nor a recommendation, nor research, or a record of our trading prices, or an offer of, or solicitation for a transaction in any financial instrument and thus should not be treated as such. The information provided does not involve any specific investment objectives, financial situation and needs of any specific person who may receive it. Please be aware, that past performance is not a reliable indicator of future performance and/or results. Past Performance or Forward-looking scenarios based upon the reasonable beliefs of the third-party provider are not a guarantee of future performance. Actual results may differ materially from those anticipated in forward-looking or past performance statements. IC Markets makes no representation or warranty and assumes no liability as to the accuracy or completeness of the information provided, nor any loss arising from any investment based on a recommendation, forecast or any information supplied by any third-party.
USDCHF will be in the Bullish directionHello Traders
In This Chart USDCHF HOURLY Forex Forecast By FOREX PLANET
today USDCHF analysis 👆
🟢This Chart includes_ (USDCHF market update)
🟢What is The Next Opportunity on USDCHF Market
🟢how to Enter to the Valid Entry With Assurance Profit
This CHART is For Trader's that Want to Improve Their Technical Analysis Skills and Their Trading By Understanding How To Analyze The Market Using Multiple Timeframes and Understanding The Bigger Picture on the Chart

USDCHF Your comments on my Strategy would be much appreciated, let's hope the momentum keeps this going.

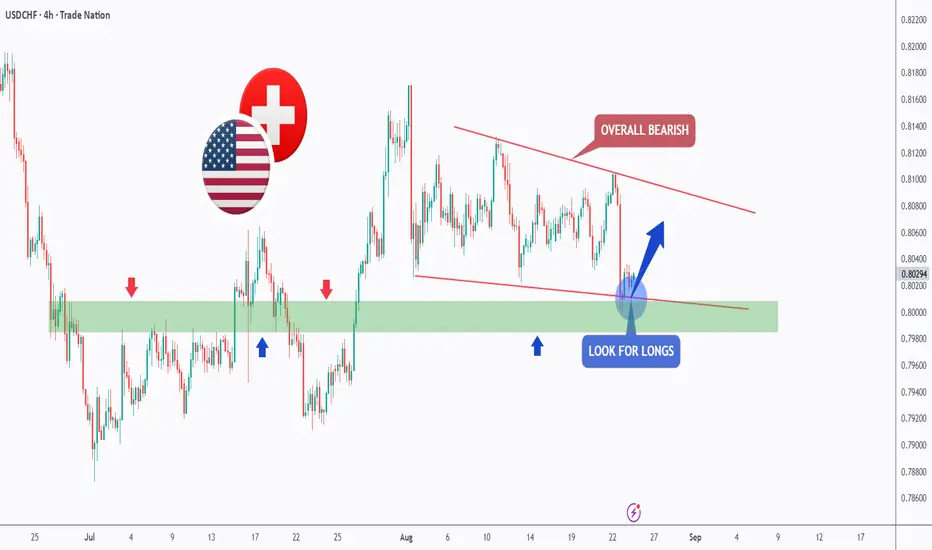
USDCHF at pivotal resistance?The USD/CHF pair is currently trading with a bearish bias, aligned with the broader downward trend. Recent price action shows a retest of the falling resistance, suggesting a temporary relief rally within the downtrend.
Key resistance is located at 0.8130, a prior consolidation zone. This level will be critical in determining the next directional move.
A bearish rejection from 0.8130 could confirm the resumption of the downtrend, targeting the next support levels at 0.8013, followed by 0.7985 and 0.7960 over a longer timeframe.
Conversely, a decisive breakout and daily close above 0.8130 would invalidate the current bearish setup, shifting sentiment to bullish and potentially triggering a move towards 0.8160, then 0.8200.
Conclusion:
The short-term outlook remains bearish unless the pair breaks and holds above 0.8130. Traders should watch for price action signals around this key level to confirm direction. A rejection favours fresh downside continuation, while a breakout signals a potential trend reversal or deeper correction.
This communication is for informational purposes only and should not be viewed as any form of recommendation as to a particular course of action or as investment advice. It is not intended as an offer or solicitation for the purchase or sale of any financial instrument or as an official confirmation of any transaction. Opinions, estimates and assumptions expressed herein are made as of the date of this communication and are subject to change without notice. This communication has been prepared based upon information, including market prices, data and other information, believed to be reliable; however, Trade Nation does not warrant its completeness or accuracy. All market prices and market data contained in or attached to this communication are indicative and subject to change without notice.

USDCHF Wave Analysis – 27 August 2025
- USDCHF reversed from support area
- Likely to rise to resistance level 0.8165
USDCHF currency pair reversed from the support area located between the support level 0.8000, lower daily Bollinger Band and the 50% Fibonacci correction of the upward impulse from July.
The upward reversal from this support area created the daily Japanese candlesticks reversal pattern Piercing Line.
Given the strength of the support level 0.8000, USDCHF currency pair can be expected to rise to the next resistance level 0.8165 (top of wave 2 from the end of July).

USDCHF Potential continuation down to the sell side.Price has been taking liquidity above the ranges in the 61.8 and followed by the dump. If scenario repeats again we have another chance around as highlighted on the charts. Will It repeat? Who knows, but it's a probability.
Good luck
David Perk

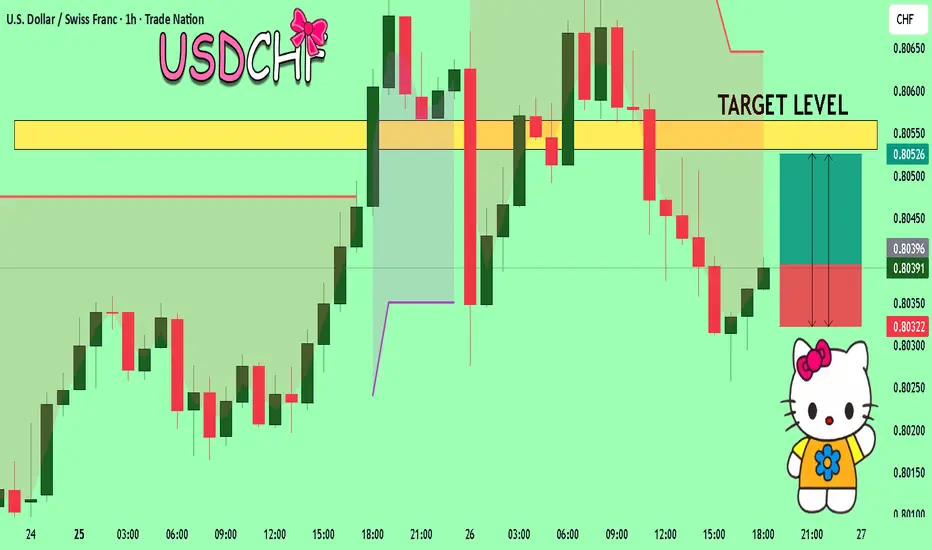
Sell USDCHFUSDCHF Sell Idea: USDCHF will short from this area of resistance down towards 0,80200. Price is currently fake pumping for the trend traders but will reverse soon.

USDCHF – Ranging Phase but Looking BullishThis time I am looking for a long buy in USDCHF.
The market was ranging for many days, but now I expect a bullish move from the lower zone. Price is trying to hold above the 200 MA and pushing higher.
From this point, my target is based on the Fibonacci extension levels:
- First target is around 0.8126
If buyers continue with strength, this level looks achievable in the next move. For me, this is a good setup to follow the bullish side after the range.

USDCHF H4 | Bearish reversalUSD/CHF is rising towards the sell entry, which is a pullback resistance and could reverse from this level to the downside.
Sell entry is at 0.8087, which is a pullback resistance.
Stop loss is at 0.8121, which is a pullback resistance that is slightly below the 127.2% Fibonacci extension.
Take profit is at 0.7996, which is a pullback support.
High Risk Investment Warning
Trading Forex/CFDs on margin carries a high level of risk and may not be suitable for all investors. Leverage can work against you.
Stratos Markets Limited (tradu.com ):
CFDs are complex instruments and come with a high risk of losing money rapidly due to leverage. 65% of retail investor accounts lose money when trading CFDs with this provider. You should consider whether you understand how CFDs work and whether you can afford to take the high risk of losing your money.
Stratos Europe Ltd (tradu.com ):
CFDs are complex instruments and come with a high risk of losing money rapidly due to leverage. 66% of retail investor accounts lose money when trading CFDs with this provider. You should consider whether you understand how CFDs work and whether you can afford to take the high risk of losing your money.
Stratos Global LLC (tradu.com ):
Losses can exceed deposits.
Please be advised that the information presented on TradingView is provided to Tradu (‘Company’, ‘we’) by a third-party provider (‘TFA Global Pte Ltd’). Please be reminded that you are solely responsible for the trading decisions on your account. There is a very high degree of risk involved in trading. Any information and/or content is intended entirely for research, educational and informational purposes only and does not constitute investment or consultation advice or investment strategy. The information is not tailored to the investment needs of any specific person and therefore does not involve a consideration of any of the investment objectives, financial situation or needs of any viewer that may receive it. Kindly also note that past performance is not a reliable indicator of future results. Actual results may differ materially from those anticipated in forward-looking or past performance statements. We assume no liability as to the accuracy or completeness of any of the information and/or content provided herein and the Company cannot be held responsible for any omission, mistake nor for any loss or damage including without limitation to any loss of profit which may arise from reliance on any information supplied by TFA Global Pte Ltd.
The speaker(s) is neither an employee, agent nor representative of Tradu and is therefore acting independently. The opinions given are their own, constitute general market commentary, and do not constitute the opinion or advice of Tradu or any form of personal or investment advice. Tradu neither endorses nor guarantees offerings of third-party speakers, nor is Tradu responsible for the content, veracity or opinions of third-party speakers, presenters or participants.


USDCHF (4H) – Institutional Supply & Demand Analysis📝 Market Context
USDCHF has been trading in a clear range between 0.8000 demand and 0.8140 supply. Every time price tapped into the upper supply, heavy sellers stepped in, pushing the market back down. On the other side, buyers have been consistently defending the 0.8000 handle, showing strong absorption of sell orders.
This kind of structure is typical of an accumulation/distribution phase, where institutions build their positions at wholesale prices (in demand) and unload them in supply.
---
🔍 Key Supply & Demand Zones
Supply (sellers in control)
0.8085 – 0.8100 → short-term reaction supply
0.8120 – 0.8140 → institutional supply, origin of the most recent strong sell-off
Demand (buyers in control)
0.8000 – 0.8020 → prime demand, where institutional buyers are most likely stacking orders
0.7940 – 0.7960 → deeper demand, last line of defense for buyers
---
📈 Institutional Trade Setups
✅ Primary Setup – Long from Demand
Entry: 0.8005 – 0.8020
Stop: below 0.7980 (20–25 pips risk)
Targets:
TP1: 0.8080 (≈ 60–70 pips, 1:3 R:R)
TP2: 0.8120–0.8140 (≈ 100–120 pips, 1:5 R:R)
This setup follows the logic that institutions will defend demand at 0.8000 to accumulate liquidity and push price back into supply.
---
⚠️ Alternative Setup – Short if Demand Breaks
Trigger: clean break & close below 0.7980
Entry: sell stop below 0.7980
Stop: above 0.8020
Target: 0.7940 → possible extension to 0.7900
If 0.8000 breaks, it means buyers have been absorbed and institutions are flipping to the short side, hunting liquidity below.
---
🧠 Institutional Bias
At the moment, USDCHF is sitting on a critical decision point:
Above 0.8000 → buyers remain in control → longs targeting 0.8080/0.8120.
Below 0.8000 → breakdown confirms institutional sellers → shorts targeting 0.7940 and beyond.
---
📌 Conclusion
USDCHF is at the heart of institutional decision-making. The 0.8000 demand zone is the battlefield. If defended, longs provide excellent risk-reward. If broken, expect an aggressive drop as liquidity gets unlocked.
🔑 Patience is key – wait for price to come to your zones. Institutions don’t chase price, they wait for liquidity to enter at wholesale levels.

Daily Updates 8/26/25 UCHFHello Traders! Great OSOK Idea today from the London Model. Study this price Action. Remember the name of the game is A.M.D

USDCHF Will Explode! BUY!
My dear friends,
Please, find my technical outlook for USDCHF below:
The price is coiling around a solid key level - 0.8039
Bias - Bullish
Technical Indicators: Pivot Points Low anticipates a potential price reversal.
Super trend shows a clear buy, giving a perfect indicators' convergence.
Goal - 0.8053
Safe Stop Loss - 0.8032
About Used Indicators:
The pivot point itself is simply the average of the high, low and closing prices from the previous trading day.
Disclosure: I am part of Trade Nation's Influencer program and receive a monthly fee for using their TradingView charts in my analysis.
———————————
WISH YOU ALL LUCK
USD/CHF Weekly Forecast: Investors Eye Swiss Labor Market DataTrend: Corrective, testing resistance of descending channel
Current Price: 0.8055
⸻
Bullish Scenario
• Entry: BUY STOP 0.8100
• Targets: 0.8300
• Stop-Loss: 0.8000
Bearish Scenario
• Entry: SELL STOP 0.8000
• Targets: 0.7870
• Stop-Loss: 0.8070
⸻
Key Levels
• Resistance: 0.8100, 0.8300
• Support: 0.8000, 0.7870
⸻
Indicators
• Alligator: fast EMAs crossed above signal → bullish bias
• AO Histogram: above baseline → momentum positive
• Trend: corrective, but room for extension higher if 0.8100 breaks
⸻
📌 Holding above 0.8100 confirms bullish momentum toward 0.8300.
Failure below 0.8000 opens the way to 0.7870.

USDCHF – Bearish Channel, But Bulls Eye This Zone!USDCHF has been sliding within a falling channel 📉 , keeping the broader outlook bearish. Yet, the pair is once again testing the 🟩 demand zone, an area that has acted as a strong base in the past.
If buyers manage to hold this level 💪 , we could see a short-term rebound toward the upper bound of the channel.
For now, the plan is simple: while the macro bias stays bearish, this zone offers a potential window for trend-following longs before the sellers step back in.
⚠️ Risk management remains key, as a clean break below the zone would signal that bears 🐻 are tightening their grip.
📚 Always follow your trading plan regarding entry, risk management, and trade management.
Good luck!
All Strategies Are Good; If Managed Properly!
~Richard Nasr
Disclosure: I am part of Trade Nation's Influencer program and receive a monthly fee for using their TradingView charts in my analysis.
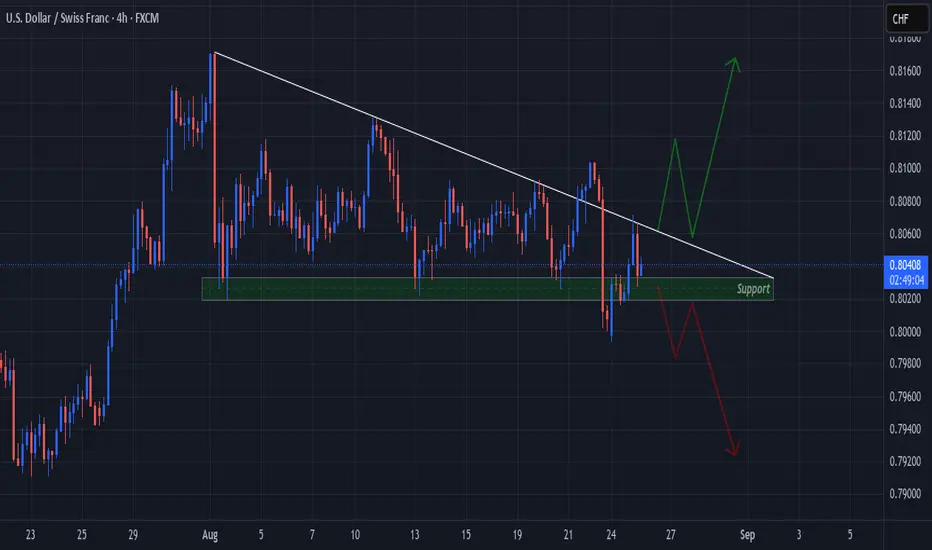
USDCHF "Descends" Into Multiple False Breakouts of the Triangle!Price on OANDA:USDCHF has been falling in a Descending Triangle Pattern shown here on the 4Hr Chart.
Price ending last week created 2 False Breakouts of both the Falling Resistance and Horizontal Support!
Price soon will be looking to make a Breakout with it consolidating tighter into the Apex of the Triangle.
Once a Breakout is validated, we will want to see a Retest!
USD/CHF - In depth breakdown🕰 Weekly Outlook
Context: Price is trading within a broad weekly swing range, rejecting resistance and leaning back into discount pricing.
Key Zones:
Resistance formed around 0.92 – 0.94 where sellers previously defended.
Weekly support sits near 0.78 – 0.80.
Bias: Weekly structure favors a return into discount after supply held.
Liquidity: Watch for sweeps into Sell Side Liquidity (SSL) before any deeper moves.
📉 Daily Structure
Price is consolidating sideways with both buy-side & sell-side liquidity building.
Notable level: 0.8024.
If this low breaks → bearish continuation.
If it holds → daily bias leans bullish back toward range highs.
Daily supply above suggests upside is corrective unless liquidity sweeps first.
⏱ 1H Breakdown
Strong supply formed around 0.8080 – 0.8100 (internal range high).
Multiple volume gaps and fair value inefficiencies visible — showing imbalance in recent bearish impulse.
Price recently retraced to 71% Fib zone and rejected, showing sellers active.
If intraday sellers step in here, downside targets are:
0.8051 intraday support
Then deeper into 0.8024 major level.
If bulls reclaim 0.8080 → likely squeeze toward 0.81+ (but still within higher-timeframe supply).
🎯 Trade Plan
Main Idea: Look for shorts off 0.8080 – 0.8100 supply with confluence from fib retracement + imbalance fill.
Targets:
TP1: 0.8051
TP2: 0.8024
Invalidation: Clean break and hold above 0.8110 (HTF supply invalidated).
Swing Option: If HTF bearish structure continues, possible extension toward 0.7950 – 0.7900 later.

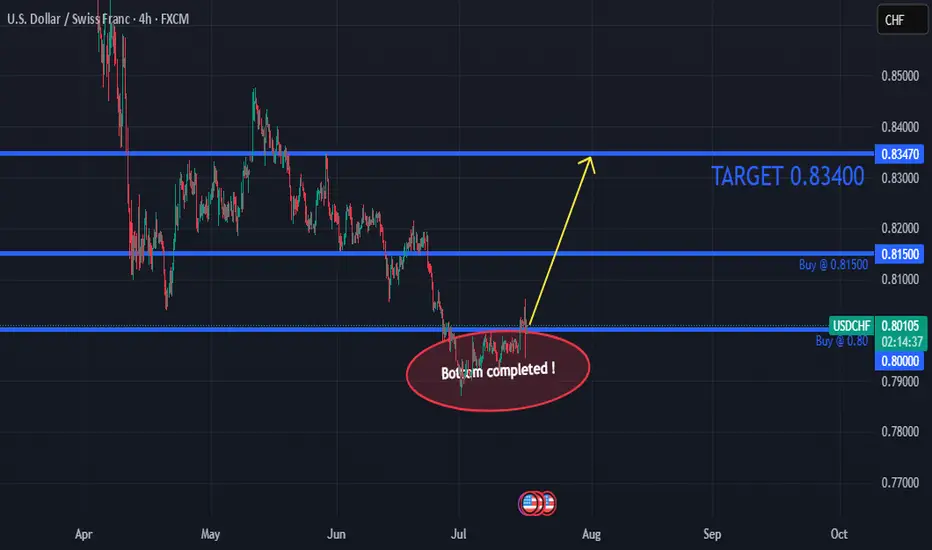
USDCHF Time for STRONG BUYBottom completed. It is now time to start opening buy positions ONLY... until 0.83400
USDCHF: Will Start Growing! Here is Why:
Balance of buyers and sellers on the USDCHF pair, that is best felt when all the timeframes are analyzed properly is shifting in favor of the buyers, therefore is it only natural that we go long on the pair.
Disclosure: I am part of Trade Nation's Influencer program and receive a monthly fee for using their TradingView charts in my analysis.
❤️ Please, support our work with like & comment! ❤️
