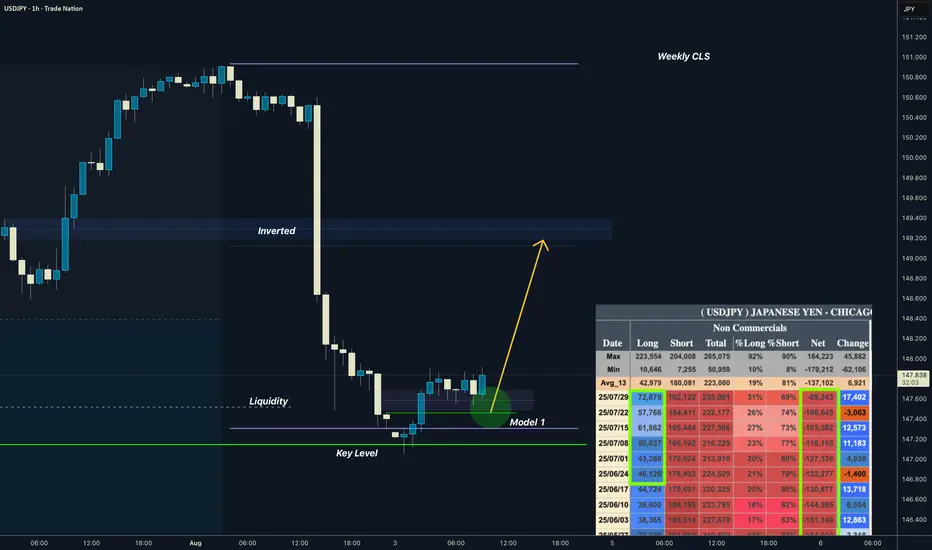
USDJPY I Weekly CLS Range I Model 1 I COT is BullishYo Market Warriors ⚔️
Fresh outlook drop — if you’ve been riding with me, you already know:
🎯My system is 100% mechanical. No emotions. No trend lines. No subjective guessing. Just precision, structure, and sniper entries.
🧠 What’s CLS?
It’s the real smart money. The invisible hand behind $7T/day — banks, algos, central players.
📍Model 1:
HTF bias based on the daily and weekly candles closes,
Wait for CLS candle to be created and manipulated. Switch to correct LTF and spot CIOD. Enter and target 50% of the CLS candle.
For high probability include Dealing Ranges, Weekly Profiles and CLS Timing.
Analysis done on the Tradenation Charts
Disclosure: I am part of Trade Nation's Influencer program and receive a monthly fee for using their TradingView charts in my analysis.
Trading is like a sport. If you consistently practice you can learn it.
“Adapt what is useful. Reject whats useless and add whats is specifically yours.”
David Perk aka Dave FX Hunter
💬 Don't hesitate to ask any questions or share your opinions
USDJPY trade ideas
USDJPY 30Min Engaged (Bullish Reversal Entry Detected )➕ Objective: Precision Volume Execution
Time Frame: 30-Minute Warfare
Entry Protocol: Only after volume-verified breakout
🩸 Bullish Reversal : 147.450
➗ Hanzo Protocol: Volume-Tiered Entry Authority
➕ Zone Activated: Dynamic market pressure detected.
The level isn’t just price — it’s a memory of where they moved size.
Volume is rising beneath the surface — not noise, but preparation.
🔥 Tactical Note:
We wait for the energy signature — when volume betrays intention.
The trap gets set. The weak follow. We execute.

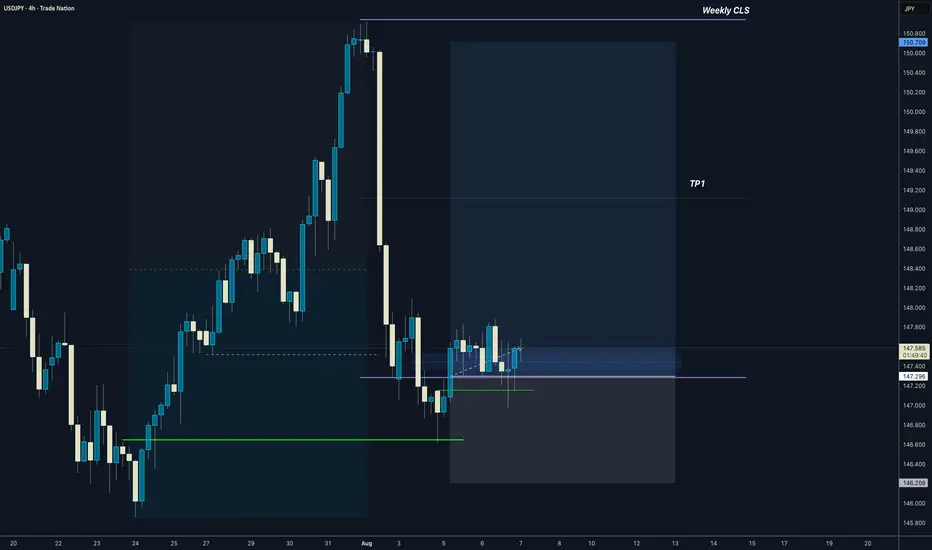
USDJPY I Weekly CLS I Model 1 I TP1 50% then full CLSYo Market Warriors ⚔️
Fresh outlook drop — if you’ve been riding with me, you already know:
🎯My system is 100% mechanical. No emotions. No trend lines. No subjective guessing. Just precision, structure, and sniper entries.
🧠 What’s CLS?
It’s the real smart money. The invisible hand behind $7T/day — banks, algos, central players.
📍Model 1:
HTF bias based on the daily and weekly candles closes,
Wait for CLS candle to be created and manipulated. Switch to correct LTF and spot CIOD. Enter and target 50% of the CLS candle.
For high probability include Dealing Ranges, Weekly Profiles and CLS Timing.
Analysis done on the Tradenation Charts
Disclosure: I am part of Trade Nation's Influencer program and receive a monthly fee for using their TradingView charts in my analysis.
Trading is like a sport. If you consistently practice you can learn it.
“Adapt what is useful. Reject whats useless and add whats is specifically yours.”
David Perk aka Dave FX Hunter
💬 Don't hesitate to ask any questions or share your opinions
USDJPY - Now or Never!Hello TradingView Family / Fellow Traders. This is Richard, also known as theSignalyst.
📈USDJPY has been overall bullish trading within the rising channel marked in blue and it is currently retesting the upper bound of the channel acting as an over-bought zone.
Moreover, the green zone is a strong weekly resistance.
📚 As per my trading style:
As #USDJPY is around the red circle zone, I will be looking for bearish reversal setups (like a double top pattern, trendline break , and so on...)
📚 Always follow your trading plan regarding entry, risk management, and trade management.
Good luck!
All Strategies Are Good; If Managed Properly!
~Rich
Disclosure: I am part of Trade Nation's Influencer program and receive a monthly fee for using their TradingView charts in my analysis.

USD/JPY 30Min Engaged ( Bullish Reversal Entry Detected )Time Frame: 30-Minute Warfare
Entry Protocol: Only after volume-verified breakout
🩸Bullish Reversal : 147.120
➗ Hanzo Protocol: Volume-Tiered Entry Authority
➕ Zone Activated: Dynamic market pressure detected.
The level isn’t just price — it’s a memory of where they moved size.
Volume is rising beneath the surface — not noise, but preparation.
🔥 Tactical Note:
We wait for the energy signature — when volume betrays intention.
The trap gets set. The weak follow. We execute.

USDJPY Is Showing a Potential Head & Shoulders PatternUSDJPY Is Showing a Potential Head & Shoulders Pattern
After the decline and speculation created by the US NFP, we can see that the USD wants to recover again. It seems that the buyers have returned and did not change the direction of the USDJPY just for the employment data.
However, it was all old in my opinion, despite the aggressive selling of the USD.
During the early European morning, the Japanese Yen lost momentum as disappointing wage data increased economic concerns in Japan.
Labor income in Japan grew by 2.5% year-on-year in June, although it came in below the expected growth of 3.2%.
On the other hand, the BOJ is not serious about raising interest rates again in order to fight inflation and this is still creating some pressure on the JPY.
In the short term, USDJPY looks set to rise as shown in the chart with targets at 148.60 and 149.50.
You may find more details in the chart!
Thank you and Good Luck!
PS: Please support with a like or comment if you find this analysis useful for your trading day
Disclosure: I am part of Trade Nation's Influencer program and receive a monthly fee for using their TradingView charts in my analysis.

USD/JPY 30Min Engaged ( Bullish Reversal Entry Detected )Time Frame: 30-Minute Warfare
Entry Protocol: Only after volume-verified breakout
🩸Bullish Reversal : 146.850
➗ Hanzo Protocol: Volume-Tiered Entry Authority
➕ Zone Activated: Dynamic market pressure detected.
The level isn’t just price — it’s a memory of where they moved size.
Volume is rising beneath the surface — not noise, but preparation.
🔥 Tactical Note:
We wait for the energy signature — when volume betrays intention.
The trap gets set. The weak follow. We execute.

USDJPY Breakout and Potential RetraceHey Traders, in today's trading session we are monitoring USDJPY for a selling opportunity around 148.300 zone, USDJPY was trading in an uptrend and successfully managed to break it out. Currently is in a correction phase in which it is approaching the retrace area at 148.300 support and resistance area.
Trade safe, Joe.

USDJPY Potential UpsidesHey Traders, in tomorrow's trading session we are monitoring USDJPY for a buying opportunity around 147.000 zone, USDJPY is trading in an uptrend and currently is in a correction phase in which it is approaching the trend at 147.000 support and resistance area.
Trade safe, Joe.

USD/JPY) support boost Bullish Trend Read The captionSMC Trading point update
Technical analysis of USD/JPY on the 4-hour timeframe, based on a rejection from a key support zone and signs of trend continuation toward a higher target.
---
Technical Breakdown:
1. Support Level:
Price has bounced from a clearly defined support zone around 146.00 – 146.50, which has held multiple times in the past.
This zone is acting as a strong demand area where buyers are stepping in.
2. Bullish Rejection + Structure:
A bullish candle has formed from the support area, signaling potential reversal.
The drawn projection suggests higher highs and higher lows forming — indicating bullish continuation.
3. EMA (200):
Price has respected the 200 EMA (blue line), bouncing off it — a strong confluence for bullish trend continuation.
EMA is slightly upward sloping, indicating a longer-term bullish bias remains intact.
4. RSI (14):
RSI is rising from oversold territory (42.09), indicating a bullish momentum shift.
A potential bullish divergence might be forming (price made lower low, RSI made higher low).
5. Target Point:
Price is projected to reach 150.904, giving a potential move of ~2.91% (426 pips) from current levels.
---
Trade Idea Summary:
Bias: Bullish
Entry Zone: 146.90 – 147.30 (current levels or slight pullback)
Stop Loss: Below the support zone (~145.90)
Take Profit (TP): 150.900 (key resistance / previous high)
Risk-to-Reward Ratio: Attractive, based on the size of the support zone vs. projected move
Mr SMC Trading point
---
Key Insights:
Strong confluence between price structure, support zone, and 200 EMA bounce.
Favorable risk-reward ratio for swing or intraday traders.
Best confirmation would come from a bullish engulfing candle or break above minor resistance near 147.80.
Please support boost 🚀 this analysis)

USD/JPY Rejection Trade: Short from ResistanceUSD/JPY 1H Short Setup
Price entered a key resistance zone near 148.700–148.850 and formed a rejection. A short position is triggered with a stop loss above the resistance and target at 147.856 support. Bearish momentum expected.

USD/JPY 1D CHART PATTERNThe USDJPY chart shows a clear bullish breakout from a long-term descending trendline, signaling a potential shift in momentum. The pair has formed higher lows, marked by multiple rejections near the ascending support trendline, confirming strong buying interest. Price has successfully broken through a key resistance zone, turning it into support, with Ichimoku cloud indicators supporting the upward movement. A bullish continuation is expected as the price maintains strength above the breakout zone. The recent breakout candle and upward arrow suggest bullish sentiment and room for further upside, aligning with the overall trend reversal pattern visible on the chart.
Entry Buy: 148.570
Target point: 151.500
If you found this analysis helpful, don’t forget to drop a like and comment . Your support keeps quality ideas flowing—let’s grow and win together! 💪📈

DeGRAM | USDJPY fixed above the descending channel📊 Technical Analysis
● Dollar-yen has punched through the 16-month descending channel top and twice retested it as support (false-break tags), carving a rising trend line that now guides price away from 144.90.
● Inside the break zone a smaller pennant is forming; a 4 h close above 147.18 completes the pattern and activates the channel-height target at 150.80 near the November swing cap.
💡 Fundamental Analysis
● US 2-yr yields pushed to a three-month high after hotter CPI core-services and Barkin’s “inflation progress has stalled”, while the BoJ July minutes flagged only “gradual” QT—widening the policy gap and reviving carry demand for yen shorts.
✨ Summary
Long 145.2-146.2; pennant break >147.18 targets 150.80. Bias void on a 4 h close below 142.80.
-------------------
Share your opinion in the comments and support the idea with like. Thanks for your support!

DeGRAM | USDJPY will retest the support level📊 Technical Analysis
● USDJPY is riding an ascending channel after a bullish breakout above the long-term descending trendline and successful retests of the 144.9–146.6 zone as support.
● Price is carving higher highs and higher lows, with the current bullish pennant pointing to a measured move toward the 150.8 resistance if 147.2 is breached on strong momentum.
💡 Fundamental Analysis
● The yen remains under pressure as US labor data stays firm and Fed officials hint at fewer cuts, reinforcing US-Japan rate divergence.
● BOJ’s dovish tone in recent speeches and widening trade deficit further weigh on JPY.
✨ Summary
Buy 145.2–146.2; confirmation >147.2 targets 150.8. Invalidation below 142.8 support zone.
-------------------
Share your opinion in the comments and support the idea with like. Thanks for your support!

USDJPY Weakening or a Correction to the Uptrend✏️ OANDA:USDJPY is approaching the old Break out support zone. The convergence zone of the 2 EMA lines. If there is a sweep to the support zone at the beginning of the week, it will be an opportunity to buy to continue the bullish wave structure. When this 146.200 zone is broken, the uptrend will be broken and we have to wait for new momentum to determine the next trend.
📉 Key Levels
Support: 146.200-143.200
Resistance: 150.800-154.500
Buy zone 146.300 (Support & Trendline)
Buy zone 143.200 Strong support zone
Target 154.500
Leave your comments on the idea. I am happy to read your views.

USDJPY Showing Bullish Correction USDJPY is currently testing a key support level, with the US dollar showing recovery since the beginning of the session. This bullish momentum is giving the pair a chance to climb higher.
Technical Overview:
The price is approaching the local support zone near 147.50. Bullish momentum is building from this level. If the price holds above 147.50, it could trigger further upside movement Upside Targets will be 148.50 and also 150.20
You May find more details in the chart,
Trade wisely Best of Luck Buddies.
Ps; Support with like and comments for better analysis Thanks Traders.

USDJPY 30Min Engaged (Buy & Sell Reversal Entry's Detected )Time Frame: 30-Minute Warfare
Entry Protocol: Only after volume-verified breakout
🩸Bullish Reversal - 148.750
🩸Bearish Reversal - 150.100
➗ Hanzo Protocol: Volume-Tiered Entry Authority
➕ Zone Activated: Dynamic market pressure detected.
The level isn’t just price — it’s a memory of where they moved size.
Volume is rising beneath the surface — not noise, but preparation.
🔥 Tactical Note:
We wait for the energy signature — when volume betrays intention.
The trap gets set. The weak follow. We execute.

USDJPY (Monthly/Weekly/Daily analysis)hi everyone welcome back to another week hope everyone had a great weekend and as always happy trading

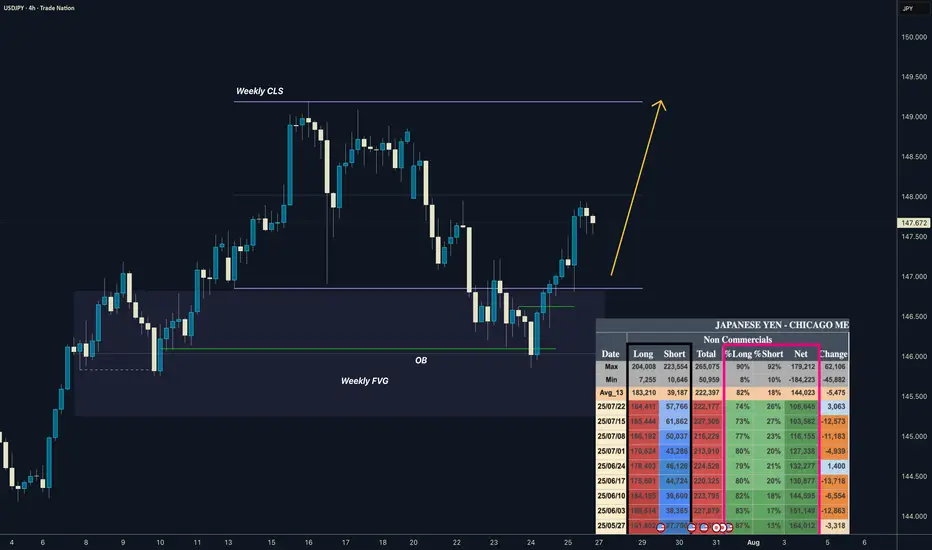
USDJPY I Weekly CLS I Model 1 / 2 I COT Bullish ASFYo Market Warriors ⚔️
Fresh Crypto Analysis— if you’ve been riding with me, you already know:
🎯My system is 100% mechanical. No emotions. No trend lines. No subjective guessing. Working all timeframes. Just precision, structure, and sniper entries.
🧠 What’s CLS?
It’s the real smart money. The invisible hand behind $7T/day — banks, algos, central players.
📍Model 1:
HTF bias based on the daily and weekly candles closes,
Wait for CLS candle to be created and manipulated. Switch to correct LTF and spot CIOD. Enter and target 50% of the CLS candle.
For high probability include Dealing Ranges, Weekly Profiles and CLS Timing.
Analysis done on the Tradenation Charts
Disclosure: I am part of Trade Nation's Influencer program and receive a monthly fee for using their TradingView charts in my analysis.
Trading is like a sport. If you consistently practice you can learn it.
COT Data
we can see reduced longs exposure and increasing shorts on JPY contract which is clear signs of bullishness confirmed by decreasing Net positions.
“Adapt what is useful. Reject whats useless and add whats is specifically yours.”
David Perk aka Dave FX Hunter
💬 Comment any Coin I ll give you my quick view
USDJPY BUYThe year will be politically marked by Trump’s return to the White House. A Republican government is seen as positive for financial markets, but Trump’s pledge to cut taxes and impose tariffs on foreign goods and services may introduce uncertainty to both the political and economic landscape.
In Japan, political uncertainty looms, as the ruling Liberal Democratic Party (LDP) lacks a parliamentary majority and may call fresh elections. An LDP victory could strengthen the Yen by ensuring stability, while opposition gains might lead to fiscal expansion and weaken the currency. If no elections occur, a modest budget would likely keep the Yen supported.
In terms of monetary policy, the Fed and BoJ are set to diverge in monetary policy. The Fed expects to deliver only two additional rate cuts in 2025, the BoJ is expected to maintain its dovish stance, avoiding rate hikes amid weak inflation and a shrinking economy, leaving the Yen vulnerable to market disappointment over policy inaction
SUPPORT 149.232
SUPPORT 148.598
SUPPORT 147.963
RESISTANCE 147.285
RESISTANCE 146.913

I sold USDJPY 147.5I sold USDJPY 147.5
Stoploss 148.00 50 pip
Take profit 144.6 290 pip
R:R 1:5.8
Good luck
Trade at your own risk with money management

USD/JPY FORMING BEARISH TREND STRUCTURE IN DAILY CHARTThe USD/JPY currency pair is currently exhibiting a bearish trend structure on the daily timeframe, signaling potential further declines in the upcoming trading sessions. Price action is trading near a lower high, reinforcing the bearish outlook as sellers appear to be gaining control. This downward momentum follows the recent formation of a bearish engulfing candlestick pattern near a significant resistance level, which often serves as a strong reversal signal. The presence of this pattern near resistance suggests that bullish momentum is weakening, increasing the likelihood of a sustained bearish move.
On the downside, the pair is expected to target the 142.300 level, which could act as a key support zone. A break below this level may accelerate selling pressure, opening the door for further declines. Traders should monitor price reactions around this level for potential consolidation or continuation of the downtrend. Conversely, if the pair attempts a recovery, the 151.300 price level stands as a major resistance barrier. Any bullish retracement towards this zone could attract renewed selling interest, reinforcing the bearish bias.
The overall technical structure suggests that USD/JPY remains vulnerable to additional downside, with bearish momentum likely to persist unless key resistance levels are convincingly breached. Traders may consider short positions on rallies towards resistance or breakdowns below key support levels, while maintaining tight risk management strategies. Given the current market dynamics, the path of least resistance appears to be downward, with 142.300 as the immediate target and 151.300 acting as a critical resistance to watch for any potential trend reversals.

Rebuy position* We set **entry above the current price**, at **147.150**, to avoid false breakouts and confirm bullish momentum continuation.
