USD/JPY Bearish Setup from Lower High RejectionUSD/JPY showing signs of rejection at previous resistance, forming a potential lower high. The bearish setup aligns with overall downward momentum. RSI remains below the 60 level, suggesting limited bullish strength. Watching for continuation to the downside, targeting a break below 142.00 while managing risk above 143.84 resistance.
USDJPY trade ideas

USD/JPY Bullish Reversal Setup | AB=CD -Week 7USD/JPY Bullish Reversal Setup | AB=CD -Week 7
wait for the breakout of point B and then Bullish divergence should be formed at point D, Once the trend gets reversed. we will put a buy stop order above point B and our sale stop will be below the LL.

CHECK USDJPY SIGNALS READ CAPTAIN USDJPY buy signals
TRADE
Entry point 👉 142.976
Take profit Target 145.100
Stop loss 142.314
20 pips already running profit
Follow money Menagment

USD/JPY Weekly: Approaching Critical Long-Term Confluence SupOVERVIEW:
The USD/JPY pair has been navigating a well-defined multi-year ascending channel on the weekly timeframe, signifying a strong underlying bullish trend. After reaching significant highs, the pair has entered a period of correction and is now rapidly approaching a crucial confluence zone of long-term support. This area is expected to be a pivotal point for the pair's next major move.
KEY OBSERVATIONS & MARKET STRUCTURE:
1. Long-Term Ascending Channel:
Since late 2022, USD/JPY has consistently respected the boundaries of a broad ascending channel. This channel defines the primary bullish trend, with price oscillating between higher highs and higher lows.
2. Current Corrective Downtrend:
From its recent peak around 161.95 (marked as 0 on the Fibonacci), price has been in a substantial decline, forming a clear bearish leg within the confines of the larger channel. This current downtrend highlights a period of profit-taking and yen strength (or dollar weakness) after an extended rally.
3. "Deciding Level: Trendline + Resistance":
During this bearish correction, price recently broke below a short-term descending trendline and a horizontal level which had previously offered support. This former support has now flipped into resistance, creating a "Deciding Level" that bears have defended around the 146.00-148.00 area. Any attempt to rally will likely face strong selling pressure here.
4. Critical Confluence Support Zone:
The most significant area on this chart is the "Long-Term Support + Fib Retracement Zone" (highlighted grey rectangle) situated approximately between 137.00 and 140.00. This zone represents a powerful confluence of multiple technical factors:
Historical Horizontal Support: A clear zone where buyers previously stepped in, initiating strong rallies.
Lower Channel Boundary: The bottom trendline of the multi-year ascending channel. This is the natural area where the long-term bullish trend is expected to find new demand.
Fibonacci Retracement Levels: This zone aligns perfectly with the 0.618 Fibonacci retracement (140.399) and extends to the 0.71 Fib level (137.186), drawn from the swing low of 127.059 to the swing high of 161.980. The 0.618 Fibonacci is often referred to as the "golden ratio" and is a high-probability reversal point in strong trends.
POTENTIAL OUTLOOK & TRADE SCENARIOS:
1. Bullish Reversal (High Probability):
Given the robust confluence of support, the most probable scenario is a strong bounce from this "Long-Term Support + Fib Retracement Zone." We would be looking for clear signs of bullish price action on the weekly or daily charts (e.g., large bullish engulfing candles, hammer formations, bullish divergence on oscillators, or a break of the short-term bearish trendline leading into this zone).
If support holds, initial targets would be the "Deciding Level" resistance (146.00-148.00), fol
lowed by a retest of the previous highs or the upper boundary of the channel.
2. Bearish Continuation (Lower Probability, but Critical Invalidation):
A sustained weekly close below the entire "Long-Term Support + Fib Retracement Zone" and the lower boundary of the ascending channel would be a significant bearish development. This would invalidate the long-term bullish structure of the channel and suggest a deeper correction is underway.
In such a scenario, the next levels of support would be the 0.71 Fib (137.186) if not already broken, and potentially even the origin of the Fib move at 127.059. This outcome would necessitate a re-evaluation of the overall long-term bias.
KEY LEVELS TO WATCH:
• Critical Confluence Support: 139.00 - 141.00
• Deeper Fib Support: 137.18 (0.71 Fib)
• Immediate Resistance: 146.00 - 148.00 ("Deciding Level")
CONCLUSION:
USD/JPY is at a critical juncture. The "Long-Term Support + Fib Retracement Zone" represents a high-probability area for buyers to re-enter and potentially reverse the current corrective move. Traders should closely monitor price action at this zone for confirmation of a bounce or, less likely but equally important, a decisive break.
Risk Management is Paramount : As always, ensure proper risk management with well-placed stop-losses relative to the identified support and resistance levels.
________________________________________
Disclaimer:
The information provided in this chart is for educational and informational purposes only and should not be considered as investment advice. Trading and investing involve substantial risk and are not suitable for every investor. You should carefully consider your financial situation and consult with a financial advisor before making any investment decisions. The creator of this chart does not guarantee any specific outcome or profit and is not responsible for any losses incurred as a result of using this information. Past performance is not indicative of future results. Use this information at your own risk. This chart has been created for my own improvement in Trading and Investment Analysis. Please do your own analysis before any investments.

Trading Signals for USD/JPY sell below 146.41The price test at 144.06 coincided with the moment when the MACD indicator had just started moving downward from the zero line, confirming a correct entry point for selling the dollar. As result, the pair plunged toward the target level of 143.39.
Yesterday was marked by significant fluctuations in the currency market, triggered by the release of disappointing data from the United States. The ADP employment report showed a much smaller job increase than expected, and weak ISM services sector figures created a domino effect, leading to a rise in the Japanese yen and a corresponding decline in the US dollar. The market's reaction was swift. Concerned about slowing US economic growth, traders began shedding dollar assets and shifting into traditional "safe-haven" currencies like the yen. This process was further intensified by revised expectations regarding the Federal Reserve's future monetary policy.
Today's weak wage growth data had little impact on the currency market. It appears that market participants had already factored such results into their forecasts, expecting a correction after previously more optimistic reports. Overall, investors are currently focused on more significant indicators of economic health, such as inflation and GDP growth, rates.
USD/JPY - SHORTDear Friends in Trading,
How I see it: (Upside seems limited)
Key Resistance @ 143.350
Potential Targets - "SHORT"
1] 142.400
2] 142.100 (maybe)
I sincerely hope my point of view offers you a valued insight.
Thank you for taking the time to study my analysis.

USDJPY: Will This CRT FVG Hold After the PWL Sweep?Price action on USDJPY reflects a clean execution of Candle Range Theory (CRT). Following a sweep of the Previous Week’s Low (PWL), price reacted from a higher timeframe demand zone, grabbing sell-side liquidity before printing a bullish Break of Structure (BOS). This BOS confirmed a shift in market intent and set the stage for a retracement into a clearly defined Fair Value Gap (FVG). I refined the entry on the 4H chart, waiting for price to return to the FVG zone, with risk placed just below the sweep wick. The target is mapped to the next logical supply above a cluster of equal highs and prior inefficiency. This setup reflects a high-conviction CRT play, built from top-down analysis and confluences rooted in market structure, liquidity, and imbalance logic.

Thursday thoughts Not much to share here today more so waiting for the Non-Farm Payrolls report before any serious movements.
Targets:
Buy open and close above 143.481
Sell open and close below 142.559
I'll post a recap of the week June 6th and more information on Non-Farm Payrolls
I hope anybody who took my calls this week locked in profits. If you are viewing my ideas, please follow. Ideally building a community is my main concern all of our ideas are important and would like to help anywhere I can.
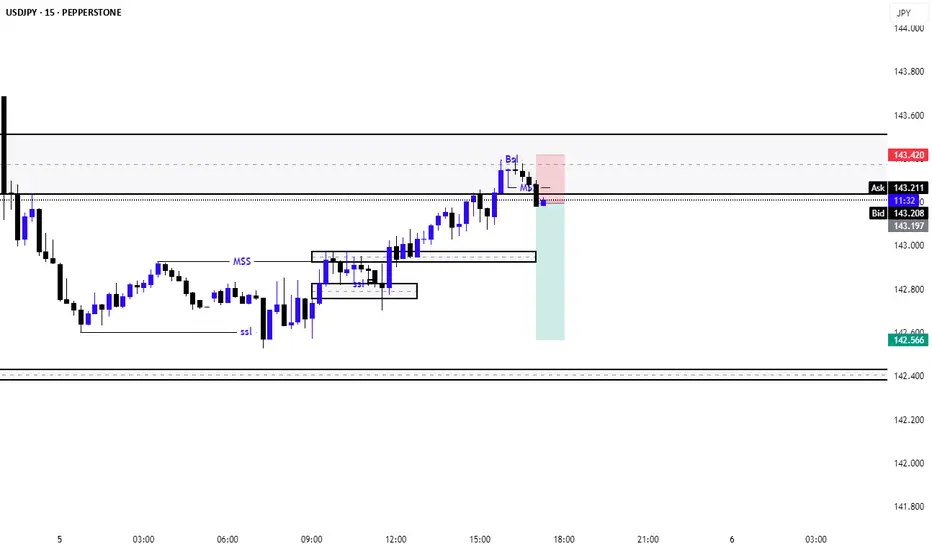
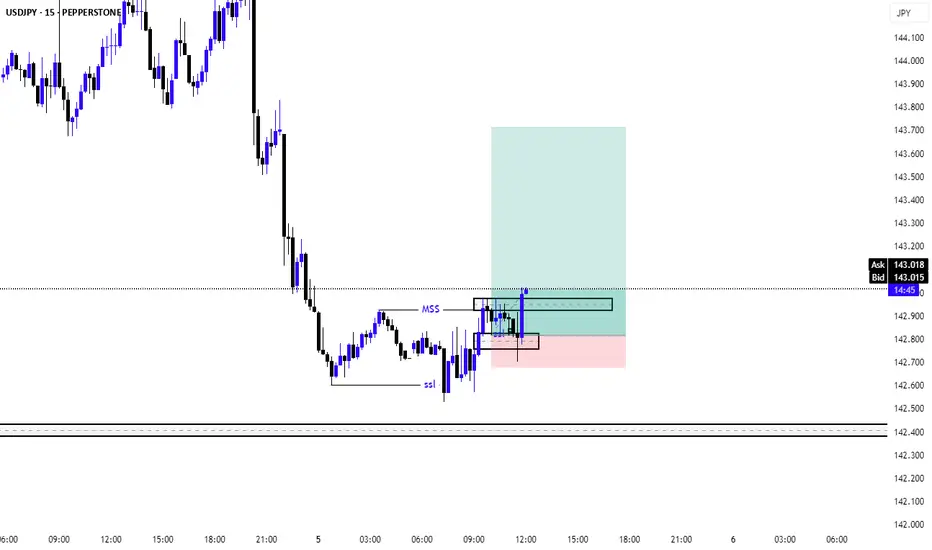
USDJPY sellPEPPERSTONE:USDJPY 15m chart price reached to FVG level. As bias already on sell side im looking for sell from here.
Senario
1. trend bias sell
2. 15m price reached previous FVG level
USD/JPY Analysis: Bears Put Pressure on Key SupportUSD/JPY Analysis: Bears Put Pressure on Key Support
As shown on the USD/JPY chart, the pair is hovering near key support at ¥142.50 per US dollar.
While demand was strong enough at the end of May to lift the exchange rate from this level to a peak around ¥146.00, USD/JPY has once again retreated to the ¥142.50 area.
Why has USD/JPY declined?
On one hand, the US dollar has weakened following disappointing economic data released yesterday. The figures revealed a sharp slowdown in private sector hiring and an unexpected contraction in the US services sector, fuelling concerns over a possible recession.
On the other hand, yen strength is being driven by the Bank of Japan's apparent willingness to raise interest rates — reaffirmed on Tuesday by Governor Kazuo Ueda — which has reinforced expectations of a tightening cycle.
USD/JPY Technical Analysis
In early June, the ¥142.50 level had already shown its role as support (as indicated by the arrow), but it is once again under pressure — a sign of bearish dominance.
Yesterday, sellers broke through local support at ¥143.57, which may now act as resistance.
More US economic data is due on Friday, with key labour market figures set to be released at 15:30 GMT+3. These could potentially trigger a bearish attempt to break below the ¥142.50 level on the USD/JPY chart.
This article represents the opinion of the Companies operating under the FXOpen brand only. It is not to be construed as an offer, solicitation, or recommendation with respect to products and services provided by the Companies operating under the FXOpen brand, nor is it to be considered financial advice.

USDJPY Will Go Lower From Resistance! Sell!
Please, check our technical outlook for USDJPY.
Time Frame: 4h
Current Trend: Bearish
Sentiment: Overbought (based on 7-period RSI)
Forecast: Bearish
The market is approaching a key horizontal level 143.365.
Considering the today's price action, probabilities will be high to see a movement to 142.144.
P.S
We determine oversold/overbought condition with RSI indicator.
When it drops below 30 - the market is considered to be oversold.
When it bounces above 70 - the market is considered to be overbought.
Disclosure: I am part of Trade Nation's Influencer program and receive a monthly fee for using their TradingView charts in my analysis.
Like and subscribe and comment my ideas if you enjoy them!

CHECK USDJPY SIGNAL READ CAPTAIN(usdjpy) buy zone
(trade satup)
entry point (143.300) to (143.200) 📊
first target (143.650)📊
2nd target (144.200) 📊
last target (144.800) 📊
stop loss (142.750)❌

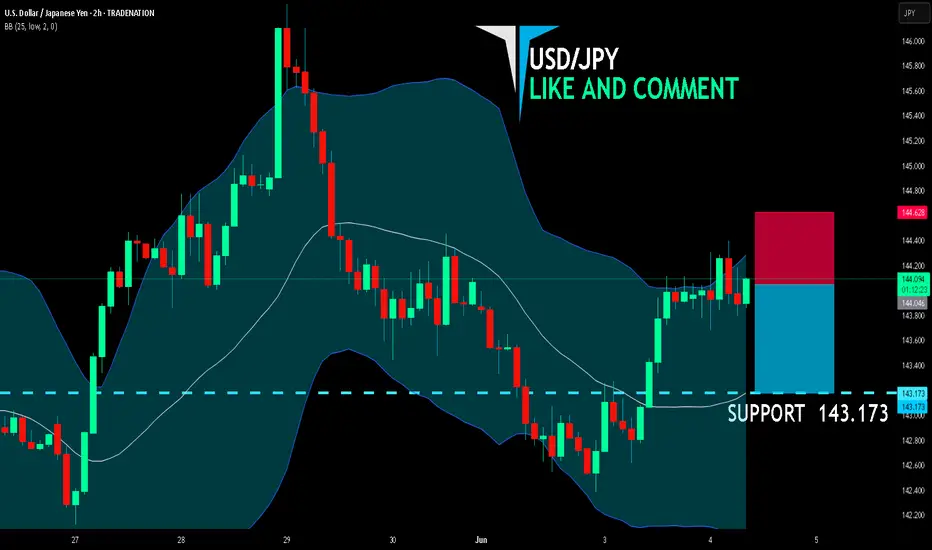
USD/JPY SELLERS WILL DOMINATE THE MARKET|SHORT
USD/JPY SIGNAL
Trade Direction: short
Entry Level: 144.046
Target Level: 143.173
Stop Loss: 144.628
RISK PROFILE
Risk level: medium
Suggested risk: 1%
Timeframe: 2h
Disclosure: I am part of Trade Nation's Influencer program and receive a monthly fee for using their TradingView charts in my analysis.
✅LIKE AND COMMENT MY IDEAS✅
USDJPY swing sell idea on 1HOn USDJPY we are currently in down trend market on Daily and all time frames bellow. On 1H we can see 3 moving averages that points to downside and give us more probability to price move lower. We need to sell at highest price. We want first ressistance area touch and then on lower time frame wait to price change direction from bull to bear. Have a nice day!

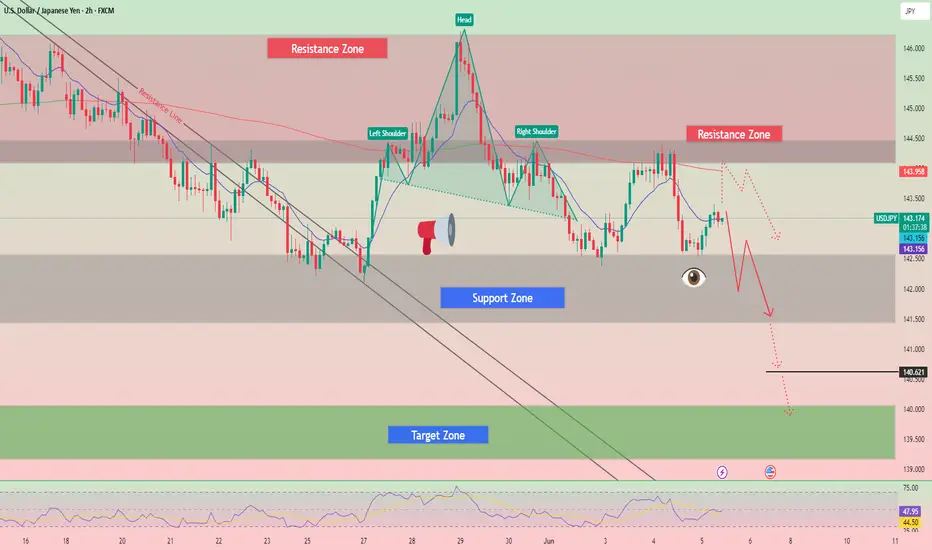
USD/JPY) breakout bearish trand analysis Read The captionSMC trading point update
Technical analysis of the USD/JPY (US Dollar / Japanese Yen) pair on a 2-hour timeframe. Here's the idea behind the analysis:
---
Overall Idea: Bearish Move Toward Support
---
Key Levels
Resistance Zone (Yellow Box, Top): Marked with two red arrows — shows strong price rejection around 146.00–147.00 area.
Support Zone (Yellow Box, Bottom): Around 139.85, marked as a target point and support level.
These two zones form the range in which price has been reacting.
---
Current Price Action
Price is currently trading at 142.649, well below the 200 EMA (at 144.190), which is a bearish signal.
It has broken below the mid-range and seems to be heading toward the lower support zone (139.85).
---
Trend & Structure
The price is following a downward trend after rejecting from the resistance zone.
The channel suggests a further leg down is likely to complete a measured move.
A temporary retest of the broken trendline might occur before continuation down.
---
RSI (Relative Strength Index)
Currently around 31.83, nearing oversold territory, indicating the potential for:
A short-term bounce before further downside, or
A reversal near the key support zone.
---
Projection
The projection arrow (blue) suggests a bullish rebound from the 139.85 support zone.
This aligns with a potential buy opportunity once support is confirmed.
Mr SMC Trading point
---
Conclusion (Trade Idea Summary)
Short-Term Bias: Bearish
Medium-Term Setup: Look for a buy opportunity around 139.85, if price reacts well.
Key Steps:
1. Watch for price to reach 139.85.
2. Look for bullish reversal patterns or confirmations at that level (e.g., bullish engulfing, RSI divergence).
3. If confirmed, a potential long trade could target back toward the 144–145 zone.
Please Support boost this analysis )

USD/JPY potential to go upMinor timeframe formed base after reject from support and now trying to break upwards, potential for longs.

USDJPY buyPEPPERSTONE:USDJPY 15m chart liquidity grab & market structure shift. looking for buy with in intraday setup. idea valied untill asian season close. time zone base on malaysian time.
USD/JPY Triangle Squeeze – Watch for Breakout or BreakdownThe USD/JPY pair is currently trading within a symmetrical triangle pattern, with a descending resistance line (red) and a rising support line (green), clearly defining a consolidation phase. This type of price structure indicates growing indecision in the market, where buyers are stepping in at higher lows, while sellers are capping gains at lower highs. Such formations usually precede a strong breakout or breakdown move, as pressure builds up toward the apex of the triangle.
🔼 Bullish Breakout Scenario
If the price breaks above the descending resistance trendline, it will confirm a bullish breakout from the triangle. This would signal that buyers are regaining control and could trigger an impulsive rally toward the 145.50–146.50 area. The upside potential is supported by the structure of higher lows forming from May 27th onward, suggesting building bullish pressure. A successful breakout above 143.30–143.50, ideally with a retest and bullish candle confirmation, could offer a high-probability long setup with targets extending toward the previous swing highs.
🔽 Bearish Breakdown Scenario
On the flip side, if the price breaks below the rising support line, a bearish continuation could unfold, targeting levels as low as 140.00–139.50. This would indicate that sellers have overcome the ascending demand and could lead to a retest of prior support levels. A breakdown below 142.30 with strong bearish volume would be a key signal to short, especially if the market rejects further attempts to climb back into the triangle zone.
🧠 Strategy Outlook
This is a neutral setup until either side is broken. Traders should wait for confirmation of breakout or breakdown before entering. Once confirmed, a simple breakout trading strategy can be applied:
For longs: buy after breakout and retest above resistance
For shorts: sell after breakdown and retest below support
Stop losses can be placed just below the support for bullish trades and just above the resistance for bearish ones, ensuring clean invalidation levels.
=================================================================
Disclosure: I am part of Trade Nation's Influencer program and receive a monthly fee for using their TradingView charts in my analysis.

USDJPY Elliott Wave Forecast: Bearish Trend Set to ResumeThe USDJPY pair has exhibited a bearish sequence since its high on July 3, 2024, signaling potential for further downside. In the near term, the cycle from the May 13, 2025, high is unfolding as a double three Elliott Wave structure, a complex corrective pattern. From the May 13, 2025, peak, the initial decline, labeled wave ((a)), concluded at 144.91. It is then followed by a corrective bounce in wave ((b)) to 146.1. The subsequent drop, wave ((c)), completed at 142.10, finalizing the larger wave W, as illustrated on the 1-hour chart below.
Following this, the pair entered a corrective phase, wave X, structured as a zigzag. From the wave W low, wave ((a)) advanced to 144.46 and wave ((b)) pulled back to 143.84. Wave ((c)) rallied to 146.28, completing wave X in the higher degree. This zigzag correction temporarily halted the bearish momentum. The pair has now turned lower, initiating wave Y, which is also unfolding as a zigzag structure with sub-waves ((a))-((b))-((c)).
From the wave X high, wave (i) of ((a)) declined to 142.37, and the corrective wave (ii) of ((b)) reached 144.39. The pair is expected to continue lower in wave (iii) of ((a)). As long as the pivot high at 146.28 remains intact, any rally is likely to fail in a 3, 7, or 11 swing pattern, setting the stage for further declines. A break below the wave (i) low at 142.37 and the wave W low at 142.10 would reinforce the bearish sequence from the May 29 and May 13 peaks, respectively. Such a move would further confirm and validate the bearish outlook, strengthening the case for continued downside in the USDJPY pair.

USD-JPY Free Signal! Buy!
Hello,Traders!
USD-JPY went down to
Retest a horizontal support
Level of 142.245 from where
A rebound is to be expected
So we can go long on the
Pair with the Take Profit
Of 143.360 and the Stop
Loss of 141.936
Buy!
Comment and subscribe to help us grow!
Check out other forecasts below too!
Disclosure: I am part of Trade Nation's Influencer program and receive a monthly fee for using their TradingView charts in my analysis.

Japanese Yen to Da Moon!I compared the yen to every single currency pair and USDJPY is the most volatile. BOJ will raise interest rates to 0.75%-1% by late 2025/early 2026. And IF the FED chooses to lower rates that will further exacerbate Yen strength.
103.156 TP, but TBH I see price breaking well past that point and yen will make new all time highs. The dollar will get desecrated across all currencies, the yen will destroy it the hardest. Most likely BTC will also peak around this same time period and youll see and end to the bull cycle and we will enter BTC bear cycle but that is beside the point.
Potential Black Swan Event: the US enters into a recessionary environment, while I dont think this is likely bc everyone is saying that, it will be possible if we see a further escalation in the Ukraine conflict or if the US chooses to enter war with Iran. War is the only situation I see potential US recession.
I predicted then yen would get dusted during COVID, now I predict yen will make never seen before gains for the next 5 years minimum. Let's see how this plays out.

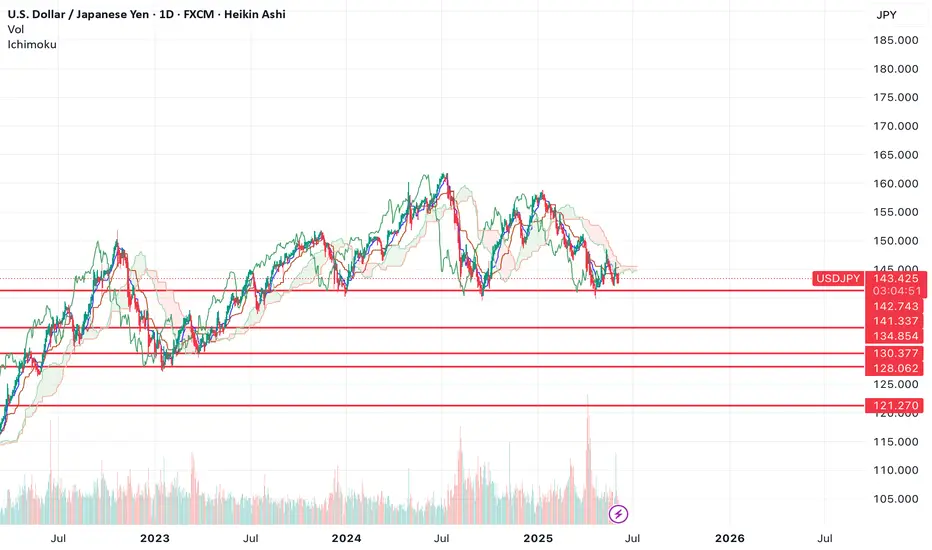
The Yen the cause of the next decline?The yen strengthening is what preceded the last market selloff and it looks like it could also be the cause of the next one.
If we look at the chart, it seems like we've now formed a massive top.
If USDJPY breaks through support at 141.33 that should be the initial trigger for a short. Below $139, under the wicks would be the safer play.
I could see the move going all the way down to the lower support levels.
Let's see how it plays out.
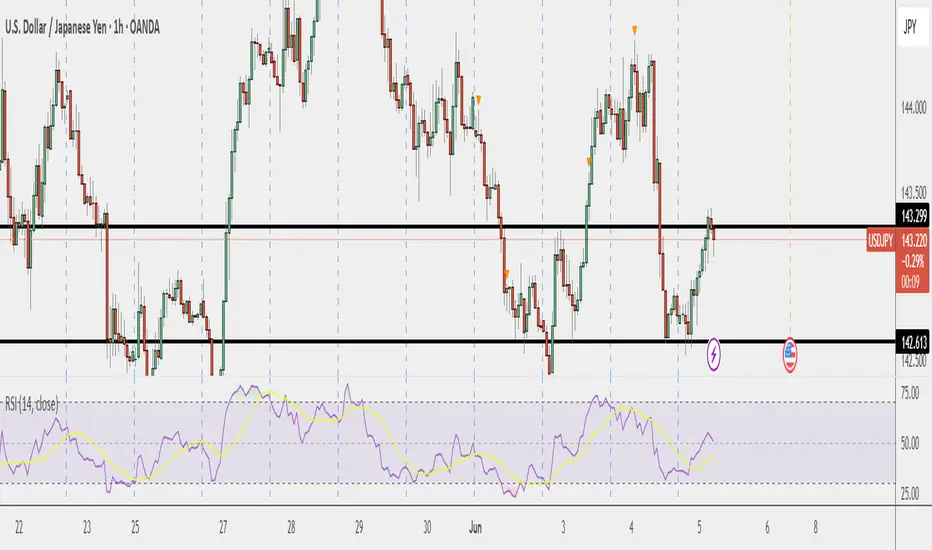
USD/JPY back at neckline as soft US data narrows yield spreadToday's soft US data releases weighed on US yields, which helped to further narrow the US-Japan spreads on the long dated bond yields. In turn, the USD/JPY gave up its entire gains from the day before when it was boosted by the JOLTS data. Next move could be defendant on the nonfarm payrolls report on Friday.
From a technical point of view, this is text book stuff. Price is testing a key area of support at the time of writing, between 142.00 to 142.70, as marked in grey on the chart. This zone has provided strong support on multiple occasions, preventing rates from sliding towards 140.00 zone. Now the more a level or an area is tested, the more likely it will break down. Will we see a break here in the next few days? Or will support continue to hold, as improving risk appetite gives US dollar some breathing space?
Well, the pair is down quite a lot on the session, so i wouldn't rule out a bounce here heading into US close. But the trend direction is clear: bearish.
By Fawad Razaqzada, market analyst with FOREX.com
