USDJPY trade ideas

Trading Ideas USDJPY 4H [Disc On]Technical Analysis:
The presence of a Hidden Bullish Divergence on the 4-hour timeframe suggests a strong likelihood of bullish trend continuation. Additionally, the price has broken through a key support level on the 1-hour chart, with upside potential targeting the Fibonacci cluster at the psychological zone of 144.500–145.000 .
Conclusion:
A BUY opportunity is favored, with entry consideration around the 144.500–145.000 Fibonacci cluster zone. Suggested risk management includes a stop loss at 142.000 and a take profit target at 150.000.
技术分析:
在4小时周期中出现隐藏的看涨背离,表明上涨趋势有较大延续的可能性。同时,价格已突破1小时图中的关键支撑位,上行目标指向 144.500–145.000 的斐波那契密集区域(心理价位区间)。
结论:
当前倾向于寻找BUY机会,入场参考区域为斐波那契密集区144.500–145.000。建议设置止损位于142.000,目标价为150.000,以控制风险并优化利润空间。
OANDA:USDJPY

USDJPY Analysis (prediction)Hi everyone sorry I am sick so just have to bear with me. Please note this is not financial advice and for my own educational purposes. happy trading evertone

BULLISH. Liquidity has been taken and has moved to the upside, if price comes back to the zone marked, i will lookout for entry to continue on the bullish side.

Usdjpy at key near-term support zone?The USD/JPY pair faces a sharp sell-off and slides to near 144.00 on Tuesday. The pair dives significantly as the US Dollar (USD) underperforms its peers after a ceasefire between Israel and Iran.
Easing geopolitical tensions diminish demand for safe-haven assets, such as the US Dollar. During European trading hours, the US Dollar Index (DXY), which tracks the Greenback’s value against six major currencies, slumps to near 98.00.
The demand for the Japanese Yen (JPY) should have weakened too, given its safe-haven status. However, the Asian-Pacific currency is outperforming its peers, except antipodeans, due to the decline in oil prices. ( Dua, 2025)
USD/JPY is trading below the 145.00 mark at the time of writing, during American trading hours, and staying afloat above its 100-day Moving Average, which remains a key near-term support zone.
Market next target ⚠️ Disruption & Counterpoints:
1. Premature Breakout Bias:
The chart shows price repeatedly rejecting the resistance zone (highlighted in red).
The arrow assumes a clean breakout without confirmation — this is speculative, as the price hasn’t closed convincingly above the resistance.
This could easily turn into a false breakout or double top if price fails again.
2. Volume Mismatch:
A breakout should be backed by strong bullish volume. However, the current volume is mixed and not showing a clear surge in buyer strength.
Lack of volume confirmation makes the breakout less reliable.
3. Ignoring Recent Rejections:
The red zone was tested multiple times in the last sessions without success. That typically signals strong supply or institutional selling.
Repeating this setup without accounting for historical failure adds downside risk.
4. Missing Bearish Scenario:
No alternate path is considered. A failed breakout could lead to a pullback toward 144.00 or lower, especially with U.S. news events (indicated by the flag).
A balanced analysis should always prepare for both breakout and rejection.
5. Macroeconomic Event Risk:
Similar to the GBP/USD chart, this one also shows an upcoming U.S. economic event. That could heavily move USD/JPY, and technical setups may become invalid fast.
The analysis ignores the need to wait for the news catalyst or confirmation after the release.

USD JPY --->>> SHORT!Sell on dollar against yen. Analysis based on the daily chart. Entry based on the hourly time frame.

USDJPY 15M BUY FRIDAY DELIGHT LOLEvery pips count Scalping 15m
Reason to buy
Strong SUPPORT 144.22
Lets hope we get PAID @ THIS LOVELY SUNNY LONDON :))))

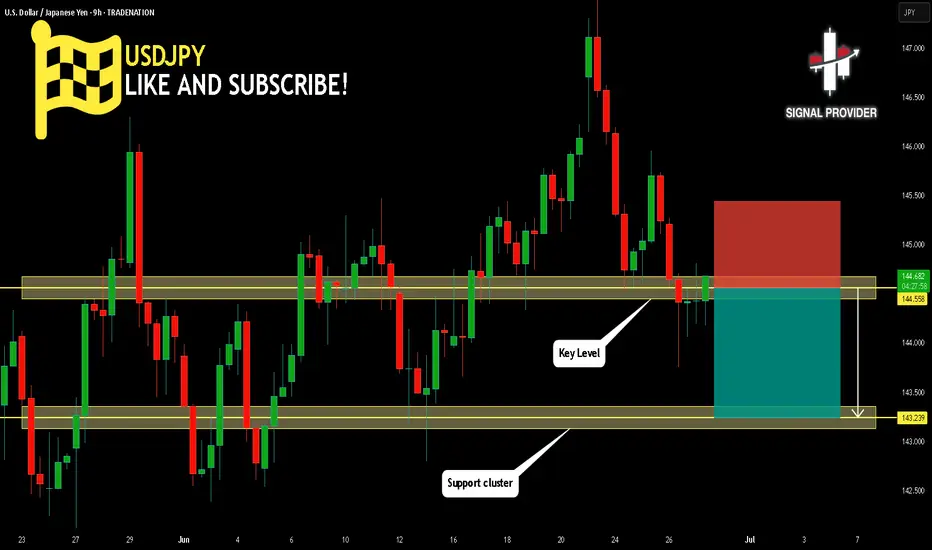
USDJPY Will Go Lower From Resistance! Sell!
Take a look at our analysis for USDJPY.
Time Frame: 9h
Current Trend: Bearish
Sentiment: Overbought (based on 7-period RSI)
Forecast: Bearish
The market is testing a major horizontal structure 144.558.
Taking into consideration the structure & trend analysis, I believe that the market will reach 143.239 level soon.
P.S
Overbought describes a period of time where there has been a significant and consistent upward move in price over a period of time without much pullback.
Disclosure: I am part of Trade Nation's Influencer program and receive a monthly fee for using their TradingView charts in my analysis.
Like and subscribe and comment my ideas if you enjoy them!
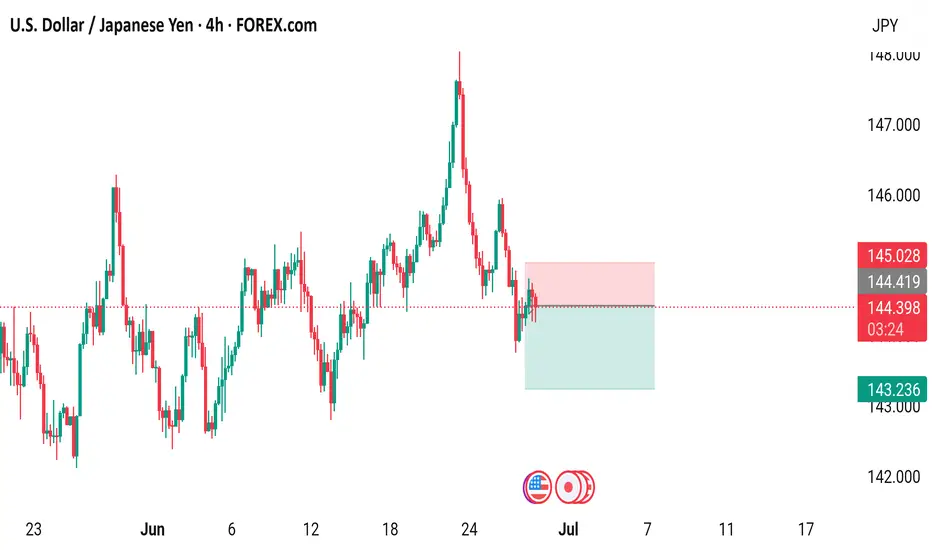
USD/JPY 4-Hour Forex Chart4-hour performance of the U.S. Dollar (USD) against the Japanese Yen (JPY) from FOREX.com, showing a current exchange rate of 144.351 with a slight decrease of 0.063 (-0.04%). The chart highlights a recent sharp upward movement followed by a decline, with key support and resistance levels marked around 144.419 and 145.028, respectively. The time frame spans from late June to early July 2025.
US$ Carry Trade BLOWUP IS SETTING UP The chart posted is the Yen/US$ I have NOT changed the labeling see forecast I feel something is about to Break in the markets ! best of trades WAVETIMER

Is USDJPY in a Downtrend?USDJPY is supported by the trendline and the price is facing the resistance zone of 144.500. If the candle cannot close above this resistance zone, the sellers can push the price to break the trendline and head towards the support zone of 142.700. This support zone plays an important role in shaping the trend if broken the downtrend can be extended and no support zone can be strong enough to push the price of the pair until 140.300.
There is still a high possibility of a reaction so the BUY strategy at the support zone of 142.700 is still ready
On the other hand, if the candle closes above the resistance zone of 144.500, the uptrend is still maintained and heading towards this week's peak around 147.500. Pay attention to the price reaction at 146.000.

USDJPY – Uptrend Still Intact, But Waiting for a BounceUSDJPY is currently pulling back toward the key support zone at 142.244 after being rejected from the 148.000 resistance area. This recent drop reflects strong selling pressure from the dense FVG zones near Resistance 2.
However, the overall structure remains bullish, with a series of higher highs and higher lows still intact. The current support zone is crucial—if it holds, USDJPY could rebound toward 145.800 and potentially retest the 148.000 level.
On the news front:
– A fragile ceasefire between Iran and Israel has improved global risk sentiment, reducing demand for USD as a safe haven.
– The Bank of Japan kept interest rates unchanged and signaled caution in reducing bond purchases—supporting the yen, but not enough to reverse the dollar's edge.
– The wide interest rate differential still favors the USD.
Strategy: Watch for bullish confirmation at 142.244. If buyers step in clearly, it may present a long opportunity in line with the dominant uptrend.

CHECK USDJPY SIGNAL READ CAPTAINPair: USDJPY
Direction: Short (Sell Setup)
Entry Zone: Around 145.900\146.000
Stop Loss: 146.350
Take Profits:
TP1: ~145.600
TP2: ~145.100
Final Target: 144.700

OANDA:USDJPY Buy SetupUSDJPY Buy Setup – Bullish Structure & Daily Rebound
USDJPY is showing signs of renewed bullish momentum after rejecting a significant daily low. Price action on the 1-hour timeframe has confirmed the formation of a higher low, followed by a clean break above a key daily support level—now turned support once again. This shift in market structure indicates a potential continuation of the uptrend, supported by higher highs and higher lows on the intraday chart.
Technical Highlights:
Strong rejection from a daily low zone
Bullish structure confirmed on the 1H timeframe
Price reclaiming a key support level and holding above it
Momentum suggests potential continuation toward higher targets
Trade Setup:
Entry: 145.110
Stop Loss: 144.754
Target Levels:
Take Profit 1: 145.709
Take Profit 2: 146.747
Take Profit 3: 148.014
This setup offers a favorable risk-to-reward ratio within a well-defined bullish context. Wait for a solid candle confirmation if not already entered, and always manage your risk according to your trading plan.
Drop your thoughts or questions in the comments, and if you found this valuable, hit boost and follow for more structured trade ideas. Wishing you precision and profits!

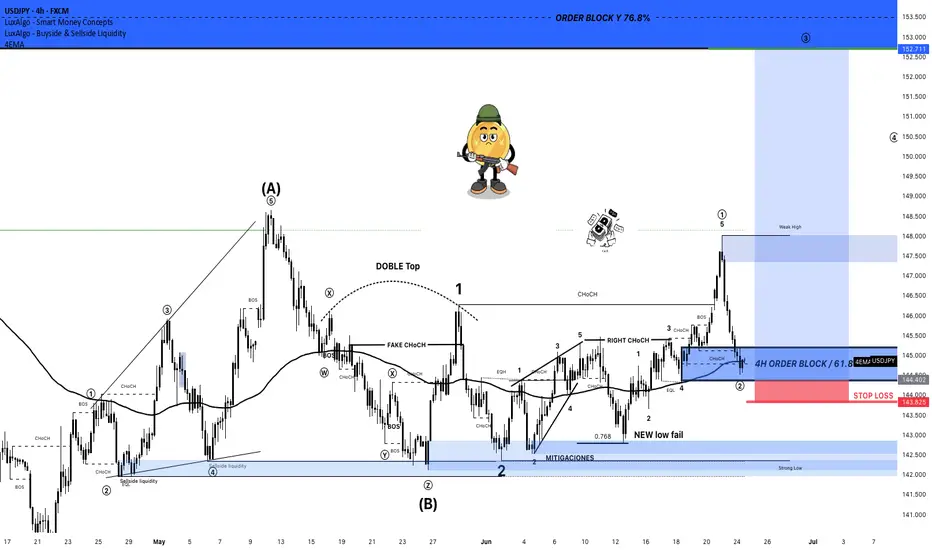
LONG - USD/JPYCurrently in the 4H timeframe I can see that the price itself has given me a shift of momentum and this indicates that there could a chance for a possible bullish movement.
Now I have marked my zones base on fibonacci levels and gotten my zones to participate in the market.
Base on the market structure we can see that the price has now shifted its direction coming from a bearish momentum and now is pushing into a bullish momentum. This is where we can try to look for an opportunity to buy within those zones.
Why I am looking for a buy is because the price has already touched our support zone and respected the zone itself. Combining it together with Market Structure there seems to be a much more clearer view of how the market is moving.
Entry Point - 144.341
Stop Loss - 142.387
Take Profit - 148.585

USD/JPY Bearish Setup: Target 144.309USD/JPY Technical Analysis (30-Min Chart)
Current Price: 145.157
Chart Pattern: The chart shows a bearish structure forming after a sharp drop from the recent high near 147.9. The price is currently consolidating below a resistance zone.
Key Resistance Zone: ~145.70 – 146.00 (highlighted by the orange box)
Support Zone: ~144.30 (target area)
Bearish Outlook:
The price formed a lower high after the drop from the recent peak, indicating selling pressure.
A potential bearish flag or lower high rejection is forming.
The forecasted path suggests a downward move towards 144.309, aligning with the previous support area.
Conclusion:
The setup favors short positions if the price fails to break above the 145.70–146.00 resistance.
Target remains 144.309, with a break below that possibly opening the way to 143.50.
Watch for price action near the blue zone to confirm the downward continuation.

UJ correlating with the dollar?We see price creating LL's and LH's heading to the downside. Structure retested at a LH with a perfect bearish engulfing printing right after the retest of support which turned resistance! Counter trend line was broken. I was also looking at multiple brokers & it looks like the 4hr bearish engulfing only printed on a select few brokers . . Although we did align on a 15 min which is lower time frame. Trade management is key, we shall see what happens next!

USDJPY is ready to go down to 143.834USDJPY is ready to follow my strategy and is already going down to 143.834

The trend is more important than the exact high to shortCatching the precise high to short is a tough game. I prefer to leave this to the expert. In the day chart, we have a nice bearish candle and here in the 1H chart, you can see my short position is more than halfway from the exact fall (coz I really can't predict the market movement).
So, I have two targets for those keen to short, the 2nd one upon breaking down from the bullish trend line.
Again, I stressed the volatility of this pair so if you cannot stomach it, it is better to go for my EURUSD pair. See next chart.

USD/JPY Trendline TestAs USD has broken down against most major currencies, USD/JPY continues to hold on to higher-lows as taken from a trendline connecting April and early-June swing lows.
The intra-day reversal on Monday was stunning, with price rejected at 148.00 and going all the way down to 145.00 for a mild bounce on Tuesday morning. But sellers reacted to that, as well, holding highs at 145.92 on the way to fresh lower-lows.
That 145.00 level is now set up as short-term lower-high resistance potential; and for those looking for Yen-weakness, there could be more attractive setups elsewhere, such as EUR/JPY or GBP/JPY.
For USD/JPY, there's data on both sides of the pair as Tokyo CPI is set for release later tonight, followed by U.S. Core PCE tomorrow morning. - js

USD/JPY Profit Heist – Are You In or Missing Out?"🔥💰 "USD/JPY NINJA HEIST: Bullish Loot Before the Trap! (Thief Trading Style)" 💰🔥
🌟 Attention Market Robbers & Profit Takers! 🌟
🚨 Thief Trading Alert: USD/JPY "The Ninja" is primed for a BULLISH HEIST!
Based on our stealthy technical & fundamental analysis, we’re locking in a long entry strategy. The plan? Loot profits before the RED ZONE danger hits! Overbought? Maybe. Risky? Sure. But the real robbery happens before the bears wake up! 🏴☠️💸
🎯 ENTRY: The Vault is OPEN!
Buy Limit Orders: Swipe the dip on pullbacks or jump in at key swing lows.
Aggressive? Enter now & ride the wave!
🛑 STOP LOSS (Thief-Style Escape Plan):
Swing Low (5H TF): 143.600 (Adjust based on your risk & lot size!)
Multiple orders? Scale SL wisely—don’t get caught!
🎯 TARGETS:
Main Take-Profit: 151.000 (Or escape earlier if the trap triggers!)
Scalpers: Only play LONG—trail your SL & lock in quick loot!
📢 SCALPERS & SWING TRADERS:
Got deep pockets? Ride the wave now!
Small account? Join the swing heist & rob the trend slowly!
📈 WHY USD/JPY?
Bullish momentum + Macro/Fundamental tailwinds!
COT Report, Sentiment, & Intermarket Analysis all hint at more upside! go ahead to check 👉🔗🌏
⚠️ WARNING: NEWS = VOLATILITY!
Avoid new trades during high-impact news!
Trailing SL = Your best friend! Protect profits & avoid jail (stop-out)!
💥 BOOST THIS IDEA TO SUPPORT THE HEIST!
More boosts = More robberies = More profits for YOU!
Stay tuned—next heist coming soon! 🚀💰
🔥 Like, Share, & Follow for Daily Steals! 🔥

Market next move Disruption of the Bullish USD/JPY Analysis
1. Weak Bullish Momentum
The current bullish attempt is showing small-bodied candles with low follow-through.
Disruption: This suggests a lack of conviction from buyers. If there’s no strong bounce soon, it could indicate distribution rather than accumulation.
2. Volume Imbalance
Notice the recent spike in bearish volume (red bars), especially during the last price drop.
Disruption: Volume is supporting the downtrend, not the rebound. This suggests sellers are still in control.
3. Lower High Structure
The price recently failed to form a higher high and continues forming lower highs and lower lows.
Disruption: This pattern is a classic sign of a continuing bearish trend, contradicting the bullish target.
4. Fundamental Headwinds
The U.S. economic icon (flag) suggests an upcoming high-impact event — likely NFP, GDP, or rate decision.
Disruption: If U.S. data is weak or if there's talk of the Fed pausing rate hikes, USD could weaken, pushing USD/JPY further below 144.000.
