USDNOK (DAILY HEAD AND SHOULDERS RETEST)(USDNOK) Is coming back for a potential retest the daily is bearish the weekly is bearish everything in sink
USD/NOK
No trades
Market insights


USDNOK--LONG--Long bias, weekly bullish,daily bullish
--entry and tp levels are as shown on the chart


USD/NOK bears on wedge watchUSD/NOK finds itself coiling within a rising wedge following a prolonged downtrend earlier this year, fitting the textbook definition of a bearish continuation pattern. With the pair now testing uptrend support, traders should be alert to the risk of a bearish breakdown that may open the door to lower levels.
While an eventual bearish break is favoured, traders may want to wait for confirmation of the breakdown before entry, with support at 10.1000 and the important 50DMA located just beneath. The preference would be to wait for a close beneath the latter before considering the setup, allowing for a stop to be placed above the 50DMA or 10.1000 to protect against reversal.
The psychologically important 10.0000 level looms as a key nearby hurdle for bears, with 9.9525 support another level to keep on the radar. Should the pair eventually clear the June low of 9.8650, the September lows would loom as the eventual trade target.
There is no definitive signal from RSI (14) and MACD when it comes to directional bias, other than upside strength is waning quickly, placing more emphasis on price action and signals to determine how to proceed.
Good luck!
DS

Building Rock-Solid Confidence: The Trader’s Unshakable EdgeConfidence is the foundation of every great trader — not because it guarantees wins, but because it guarantees consistency. In this session, we break down the psychology of self-belief and how to build confidence that doesn’t crumble when the market tests you.
Learn why confidence isn’t built from profits but from disciplined execution. We’ll cover how to stop second-guessing your trades, rebuild trust in your system, and detach your self-worth from your results. This episode shows you how professional traders use repetition, reflection, and recovery to stay calm, clear, and confident — even in drawdowns.
You’ll learn:
The difference between ego and true confidence
How to rebuild trust in your trading plan
Why the market manipulates your confidence and how to protect it
The 3-step framework for building self-trust in trading
If you’ve ever felt anxious before pressing “Buy” or “Sell,” or you constantly question your setups, this discussion will help you develop the rock-solid mindset needed to execute with precision and confidence.
Tags: trading psychology, trading confidence, self-belief for traders, trading mindset, forex psychology, discipline in trading, consistency in trading, emotional control, trader development, performance mindset

Banishing Greed From Trading: Why Wanting More Keeps You LosingGreed is one of the most destructive emotions in trading — it convinces you to ignore your plan, hold too long, and overleverage after a win. In this session, we break down how greed quietly sabotages traders and how to build the mental discipline needed to trade with clarity.
This episode of The Trader’s Therapist explores the psychological roots of greed, how it distorts decision-making, and how professional traders use stoic principles to detach from the outcome and focus purely on execution.
You’ll learn:
The real psychology behind greed and overtrading
How to spot greed before it costs you
Why the “enough” mindset is key to long-term consistency
Practical tools to eliminate emotional trading habits
If you’ve ever turned a winning trade into a loss because you wanted just a little more, this discussion will hit home.
Tags: trading psychology, greed in trading, emotional control, trading discipline, forex mindset, risk management, stoic trading, consistency in trading, mindset for traders, professional trading habits

NOK/USD Long-Term Elliott Wave OutlookThis weekly chart of the Norwegian Krone against the U.S. Dollar (NOK/USD) shows a clear long-term bearish structure within a descending Elliott Wave channel. The pair has been in a sustained downtrend since 2008, forming a five-wave impulsive pattern.
Wave (1) and (3) are already completed, with Wave (3) extending to the 1.618 Fibonacci projection level — a typical target for a strong third wave. The recent corrective structure suggests the completion of Wave (2) of a larger degree, likely retracing between the 0.382 and 0.618 Fibonacci levels.
The projection anticipates the start of a new bearish cycle with the unfolding of Wave (3) → (4) → (5), targeting the 0.055–0.06 zone. This region aligns with long-term Fibonacci confluence and the lower boundary of the descending channel, representing a potential final low before a major trend reversal.
Traders should monitor confirmation signals on lower timeframes to validate the start of Wave (3) down.
Disclaimer: The charts I post are based on Elliott Wave Principle and are intended to be self-explanatory. TradingView requires a meaningful description, and this text was AI-generated to provide accessible context for those less familiar with Elliott Wave concepts. This is not financial advice.

USDNOK Completes A Corrective RecoveryUSDNOK Completes A Corrective Recovery that can resume its bearish trend from a technical point of view and from Elliott wave perspective.
USDNOK made some recovery recently, but in three legs only, which indicates for a correction within the downtrend by Elliott wave theory, called a zig-zag. It stopped perfectly at equal wavelength of waves (A)=(C) and at the channel resistance line, so bears can be back, especially if it breaks below 10.0 level.
A zig-zag correction within a bearish trend is a temporary upward retracement that moves against the main downtrend. It follows the A-B-C (5-3-5) structure, where waves A and C are impulsive bullish moves, while wave B is a smaller bearish correction between them. It represents a sharp countertrend rally within a larger bearish cycle, after which the main downtrend typically resumes.

USD/NOK: Triple Harmonic Convergence at Bulls' Revenge Point💡 To see my confluences and/or linework:
📌 Step 1: Grab chart
📌 Step 2: Unhide Group 1 in object tree
📌 Step 3: Hide and unhide specific confluences one by one
🔍 Step 4: Double-click the screen to show RSI, MFI, CVD, and OBV indicators alongside divergence markings 📊
🎯 USD/NOK: Triple Harmonic Convergence at Bulls' Revenge Point
The Market Participant Battle:
Bears have successfully trapped bulls at the 15-minute timeframe support level, demonstrating their control by pushing price below the established uptrend channel. However, with bulls regrouping at proven support zones (Point 2 acting as the local center of control) and showing increasing buying interest through volume indicators, we're positioned for a powerful counter-attack. The expected return sees bulls reclaiming their territory with a measured move targeting the 0.62-0.79 Fibonacci retracement zone. The appearance of THREE harmonic patterns at the exact same reversal zone signals institutional algorithms are locked and loaded for the reversal.
Confluences:
Confluence 1: TRIPLE Harmonic Pattern Convergence 🦇🦈🦢
An extraordinary alignment of THREE harmonic patterns all completing at our entry zone:
- BAT Pattern (Blue) - Entry: 9.96071, Targets: 9.99046 (T1) / 10.04996 (T2), Stop: 9.93096
- WHITE SWAN Pattern (Red) - Entry: 9.95095, Targets: 9.97094 (T1) / 10.01093 (T2), Stop: 9.93096
- BLACK SWAN Pattern (Green) - Entry: 9.95027, Targets: 9.98734 (T1) / 10.06148 (T2), Stop: 9.91321
When multiple harmonic patterns converge this precisely, it indicates algorithmic trading systems from multiple institutions are targeting the same reversal zone - a MASSIVE bullish signal!
Confluence 2: Volume Profile Magnet Effect ⚡
The volume profile from Points 2→3 reveals a critical insight: Point 4 reacts perfectly to the Point of Control (POC), with price unable to pierce through the value high-low range. This magnetic attraction to high-volume nodes indicates institutional participants are defending this zone aggressively. When price respects volume-based support this precisely, it signals accumulation by strong hands preparing for the next leg up.
Confluence 3: Fibonacci Golden Zone Alignment 🎯
Using Fibonacci retracement from the major swing (Points 0→3), we've returned to the highly significant 0.62-0.79 pullback zone. This "golden pocket" historically acts as a launching pad for trend continuations. The mathematical precision of this retracement, combined with price stabilization in this zone, suggests algorithmic and systematic buyers are entering positions here.
Confluence 4: Multi-Indicator Bullish Divergence Symphony 📈
A rare quadruple bullish divergence is forming across RSI, MFI, and CVD candles - all showing higher lows while price makes lower lows. The RSI and MFI both sit in oversold territory, creating a compressed spring effect. This divergence constellation typically precedes explosive moves as selling exhaustion meets renewed buying interest.
Confluence 5: OBV Breakout & Bollinger Band Pierce 🚀
The On-Balance Volume (OBV) has crossed above its downtrending line, signaling increasing buying interest despite price weakness. Simultaneously, price has pierced the lower Bollinger Band - a classic mean reversion setup. When OBV leads price with a breakout while price tests extreme boundaries, smart money is typically positioning for the reversal.
Confluence 6: Local Center of Control Proven ✅
Point 3 closing above Point 1 mathematically proves Point 2 as the local center of control. This pivot now acts as a magnetic price attractor. With Point 4 returning to this proven zone, market makers who control this level are likely to defend it vigorously, setting up for the next impulse move higher.
Web Research Findings:
- Technical Analysis: USD/NOK currently trading near 9.97, with technical indicators showing "Strong Sell" on daily but oversold on shorter timeframes
- Recent News/Earnings: Norway's Norges Bank cut rates to 4% (September 2025), signaling dovish shift - USD maintains 4.25% advantage
- Analyst Sentiment: Major resistance at 10.12-10.23 zone, support holding at current levels around 9.90-9.94
- Data Releases & Economic Calendar: US GDP remains resilient at 1.7% growth forecast vs Norway's oil-dependent vulnerability
- Interest Rate Impact: 25bp rate differential favors USD, with Fed at 4.00-4.25% vs Norges Bank at 4.00%
Layman's Summary:
Imagine three different GPS systems (the harmonic patterns) all pointing to the exact same destination - that's what we have here! When multiple advanced pattern recognition systems all say "BUY HERE," it's like having three expert traders all agreeing on the perfect entry point. Combined with oversold indicators, volume support, and interest rates favoring the dollar, this is like finding a coiled spring that's been compressed to its limit and is about to explode upward.
Machine Derived Information:
- Image 1-3: 15M/1H timeframes showing numbered pivot points with clear support/resistance - Significance: Confirms multi-timeframe setup alignment - AGREES ✔
- Image 4: Triple harmonic pattern convergence (Bat, White Swan, Black Swan) - Significance: Algorithmic trading systems from multiple sources targeting same zone - STRONGLY AGREES ✔
- Pattern Risk/Reward: All three patterns show minimum 1:3 R/R with aligned stop losses - Significance: Institutional-grade setup with defined risk - AGREES ✔
Actionable Machine Summary:
The convergence of THREE harmonic patterns at the same price level is an extremely rare occurrence that signals major algorithmic interest. With the Bat pattern's 12-bar age showing maturity, and both Swan patterns freshly formed (3 bars), we have both momentum and structure confirming the reversal. All patterns share similar stop-loss levels around 9.91-9.93, creating a clear risk definition with targets extending to 10.05-10.06 zone.
Conclusion:
Trade Prediction: SUCCESS ✅
Confidence: VERY HIGH
This setup has evolved from excellent to exceptional with the addition of triple harmonic convergence. When three different harmonic patterns (Bat, White Swan, Black Swan) all complete at the same zone, combined with volume support, Fibonacci alignment, and multiple divergences, you have institutional-grade confirmation. The risk/reward across all patterns averages 1:3+, making this a premier trading opportunity. Triple harmonic convergence is one of the strongest reversal signals in technical analysis.

USDNOK Bearish Continuation Setup USDNOK Bearish Continuation Setup
🗓 Published: June 26, 2025
🕒 Timeframes: 1D & 4H
📍 Instrument: USD/NOK
📊 Technical Bias: Bearish
🧠 Analysis Summary
USDNOK has failed to reclaim the previous support-turned-resistance zone around 10.12–10.23 (highlighted in red). This rejection confirms a continuation of the broader downtrend that started in Q2 2025.
The current retracement into resistance provides a high-probability area for a trend continuation trade, targeting multiple support levels below. This setup aligns on both the 4H and Daily charts, increasing confidence in bearish continuation.
📍 Key Levels
Level Description
10.2336 Daily supply high / key resistance
10.1215–10.1191 Breaker block (supply zone)
10.0103 Minor support flip level
9.8500 Short-term target (horizontal level)
9.7565 Previous demand level
9.7469 Final target (major support)
🔁 Trade Setup
Entry Zone:
🔴 Enter between 10.12 – 10.23 (supply rejection)
🔄 OR enter on confirmation below 10.01
Take Profit Targets:
✅ TP1: 9.8500
✅ TP2: 9.7565
✅ TP3: 9.7469
Stop Loss:
❌ SL above 10.24 (above supply zone)
📦 Confluence Factors
Major breakdown from multi-year support zone (April–June 2025)
Retest of bearish order block (supply)
Large bearish volume in recent weeks
Continuation pattern with lower highs and lower lows
⚠️ Risk Note
If price reclaims and closes above 10.24 on the daily timeframe, this bearish setup is invalidated. Use position sizing accordingly and trail stops as new swing lows form.
💬 What do you think about USDNOK’s breakdown? Drop a comment and share your thoughts.
📉 Stay safe and trade smart.
Let me know if you'd like this formatted for direct pasting into a TradingView "Publish Idea" form or posted alongside another pair for a multi-chart setup.
Rendon1

long of courseAfter multi times lower lows I think a major support emerge. I step in with the bulls.


USDNOK LongUSDNOK is now net long the regression break.
I am considering this trade and will look at my EA options that suit it best.


USDNOK short potential setupUSDNOK recently broke down below the monthly 50ema (overlayed on this 4h chart) and has rejected off the daily 20ema (overlayed) twice this week. RSI is showing bearish momentum after a brief overbought period while the PA has remained in a strong downtrend. Short setup potential is evident but not certain.
I'm a cat not a financial advisor.

USDNOK--LONG--break of asccending trendline
--entry at the bottom side of ascending channel
--TP at the upper side of ascending channel

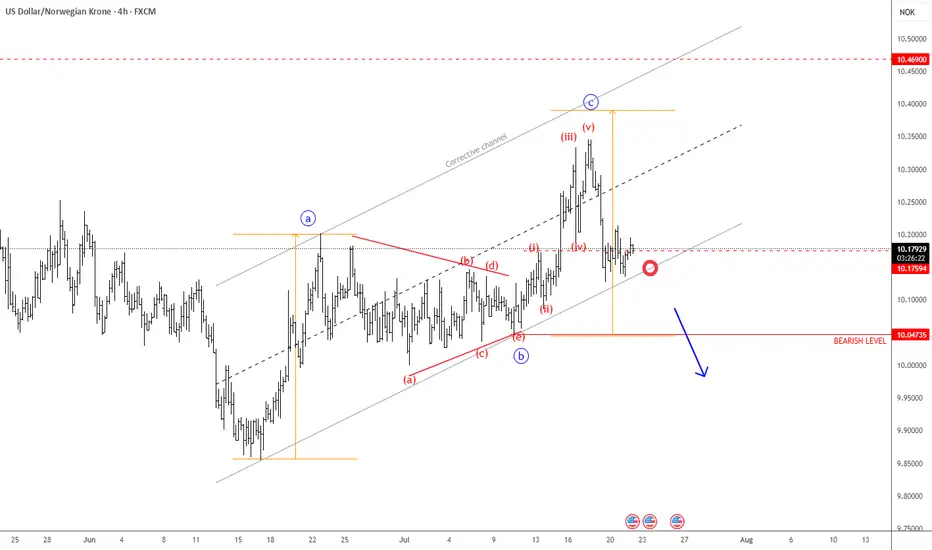
USDNOK Remains BearishUSDNOK made a three-wave rise from the recent low, indicating an abc correction within a downtrend—especially considering the triangle in wave "b" in the middle, and the current sharp decline following a completed five-wave impulse in wave "c". As long as this structure remains intact, there is still a risk of another leg lower. Therefore, we can expect further weakness toward the June lows, especially if it breaks below the channel support line. Just watch out for short-term intraday pullbacks.

USDNOK SHORT OUTLOOK WEEKLYcurrency looks like its breaking support levels and heading to the downside on weekly chart. good holds for great profits right now. what do you guys think?

USDNOKOn the monthly charts we have a confirmed bearish trend with a bullish correction in play.
On the weekly charts we have a shift in order flow confirming our bearish bias though its a long term view. We have an impulsive bearish move that has necessitated a bullish correction to clear previous disequilibrium.
The break in daily structure confirms shift in order flow from bullish to bearish. Presently we are bearish, in consonance with our monthly and weekly view.

USD/NOK- Bullish Reversal- Double Bottom -Week 5USD/NOK- Bullish Reversal- Double Bottom -Week 5
Pair: USD/NOK
🟢 Technical Pattern: Double Bottom
🟢 Confirmation Signal: Bullish Divergence (on RSI/MACD)
🟢 Market Bias: Trend Reversal – Bearish ➡ Bullish
