NZDUSD oversold bounce back support at 0.5887The NZDUSD remains in a bullish trend, with recent price action showing signs of a corrective pullback within the broader uptrend.
Support Zone: 0.5887 – a key level from previous consolidation. Price is currently testing or approaching this level.
A bullish rebound from 0.5887 would confirm ongoing upside momentum, with potential targets at:
0.6020 – initial resistance
0.6040 – psychological and structural level
0.6056 – extended resistance on the longer-term chart
Bearish Scenario:
A confirmed break and daily close below 0.5887 would weaken the bullish outlook and suggest deeper downside risk toward:
0.5865 – minor support
0.5840 – stronger support and potential demand zone
Outlook:
Bullish bias remains intact while the NZDUSD holds above 0.5887 A sustained break below this level could shift momentum to the downside in the short term.
This communication is for informational purposes only and should not be viewed as any form of recommendation as to a particular course of action or as investment advice. It is not intended as an offer or solicitation for the purchase or sale of any financial instrument or as an official confirmation of any transaction. Opinions, estimates and assumptions expressed herein are made as of the date of this communication and are subject to change without notice. This communication has been prepared based upon information, including market prices, data and other information, believed to be reliable; however, Trade Nation does not warrant its completeness or accuracy. All market prices and market data contained in or attached to this communication are indicative and subject to change without notice.
USDNZD trade ideas

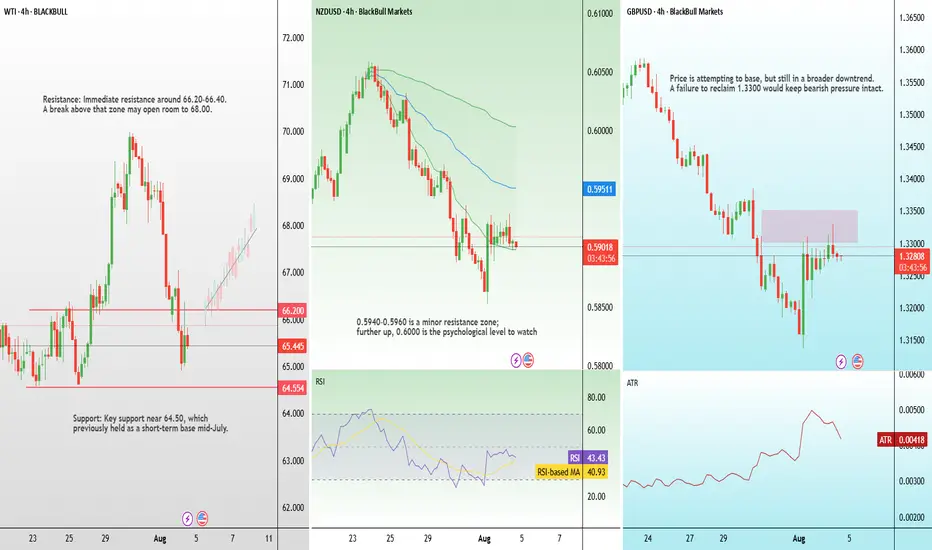
Tariffs, NZ unemployment, and rate cuts: Highlights for the weekAfter a packed calendar last week, this one looks lighter—but there are still key events across major economies likely to drive FX market movement.
India Tariffs and Oil Prices
U.S. President Donald Trump has announced plans to raise tariffs on Indian imports, citing India’s continued purchase and resale of Russian oil. The White House rightly claims this undermines sanctions and helps fund the war in Ukraine. India’s Ministry of External Affairs called the move “unjustified and unreasonable.”
New Zealand Jobs Data — Wednesday
New Zealand’s Q2 unemployment rate is expected to rise from 5.1% to 5.3%, the highest level since late 2015. With inflation back within the RBNZ’s 1–3% target range, a soft labour print could provide the final justification for a rate cut at the next policy meeting.
Bank of England Rate Decision — Thursday
The BoE is widely expected to cut its policy rate by 25 basis points this week, responding to slowing economic momentum despite ongoing inflation concerns. Traders will closely watch Governor Bailey’s remarks to gauge whether this marks the start of a broader easing cycle or a single adjustment.
NZDUSD longOn the NZD/USD chart, we see a bullish Gartley pattern aligning with an upward trendline. I expect the price to move higher.

NZD/USD SELLERS WILL DOMINATE THE MARKET|SHORT
Hello, Friends!
NZD-USD uptrend evident from the last 1W green candle makes short trades more risky, but the current set-up targeting 0.594 area still presents a good opportunity for us to sell the pair because the resistance line is nearby and the BB upper band is close which indicates the overbought state of the NZD/USD pair.
Disclosure: I am part of Trade Nation's Influencer program and receive a monthly fee for using their TradingView charts in my analysis.
✅LIKE AND COMMENT MY IDEAS✅

Price is heading towards the upper boundary of the price channel✏️ OANDA:NZDUSD is trading in a bullish wave on H4 chart towards the upper boundary of the ascending price channel. The trendline reaction to the support zone of 0.598 will form a nice corrective wave for the uptrend. If the nearest trendline is broken, the price will soon reach our take profit zone.
📉 Key Levels
Buy trigger: Reject and Trading above 0.598
BUY zone 0.592 ( vùng hỗ trợ biên dưới)
Target: 0.610
Leave your comments on the idea. I am happy to read your views.
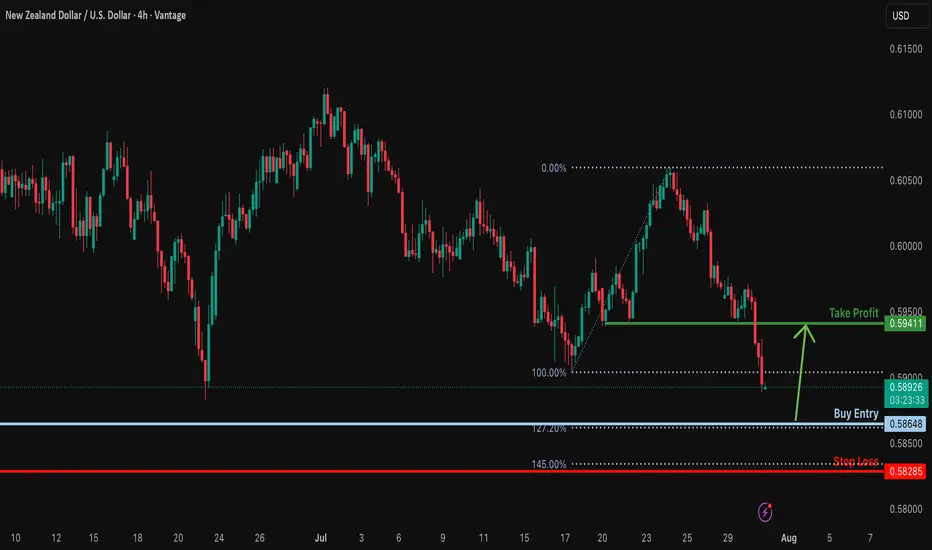
Bullish reversal?NZD/USD is falling towards the support level, which is a swing low support that lines up with the 127.2% Fibonacci extension. Could NZD/USD bounce from this level to our take profit?
Entry: 0.5864
Why we like it:
There is a swing low support that lines up with the 127.2% Fibonacci extension.
Stop loss: 0.5828
Why we like it:
There is a pullback support that lines up with the 145% Fibonacci extension.
Takeprofit: 0.5941
Why we like it:
There is a pullback resistance level.
Enjoying your TradingView experience? Review us!
Please be advised that the information presented on TradingView is provided to Vantage (‘Vantage Global Limited’, ‘we’) by a third-party provider (‘Everest Fortune Group’). Please be reminded that you are solely responsible for the trading decisions on your account. There is a very high degree of risk involved in trading. Any information and/or content is intended entirely for research, educational and informational purposes only and does not constitute investment or consultation advice or investment strategy. The information is not tailored to the investment needs of any specific person and therefore does not involve a consideration of any of the investment objectives, financial situation or needs of any viewer that may receive it. Kindly also note that past performance is not a reliable indicator of future results. Actual results may differ materially from those anticipated in forward-looking or past performance statements. We assume no liability as to the accuracy or completeness of any of the information and/or content provided herein and the Company cannot be held responsible for any omission, mistake nor for any loss or damage including without limitation to any loss of profit which may arise from reliance on any information supplied by Everest Fortune Group.
Pullback tradeThe price has broken out of a triangle pattern followed by a pullback and now the price has been rejected and now the bears look to be back in control
WE ONLY TRADE PULLBACKS

NZDUSD Expected bullish trend On the basis of trend line and price action there is expectation of bullish trend.

NZDUSD Short SwingOANDA:NZDUSD Short Swing Trade, with my back testing of this strategy, it hits multiple possible take profits, manage your position accordingly.
This is good trade, don't overload your risk like greedy, be disciplined trader.
I manage trade on daily basis.
this is good trade, lets see, don't be greedy, risk what you can afford.
Use proper risk management
Looks like good trade.
Lets monitor.
Use proper risk management.
Disclaimer: only idea, not advice

Choppy week NZDUSD BuyHello traders I hope you are doing well
As you can see the inverted head and shoulders.
Multiple touches on the top trendline.
Lets just be patient and let the market come to us.

NZDUSD SHORTsMarket structure bearish on HTFs DW
Entry on Weekly and Daily AOi
Weekly Rejection at At AOi
Previous Weekly Structure Point
Daily Rejection at AOi
Daily EMA retest
Previous Structure point Daily
Around Psychological Level 0.59500
H4 Candlestick rejection
Levels 3.67
Entry 100%
REMEMBER : Trading is a Game Of Probability
: Manage Your Risk
: Be Patient
: Every Moment Is Unique
: Rinse, Wash, Repeat!
: Christ is King.

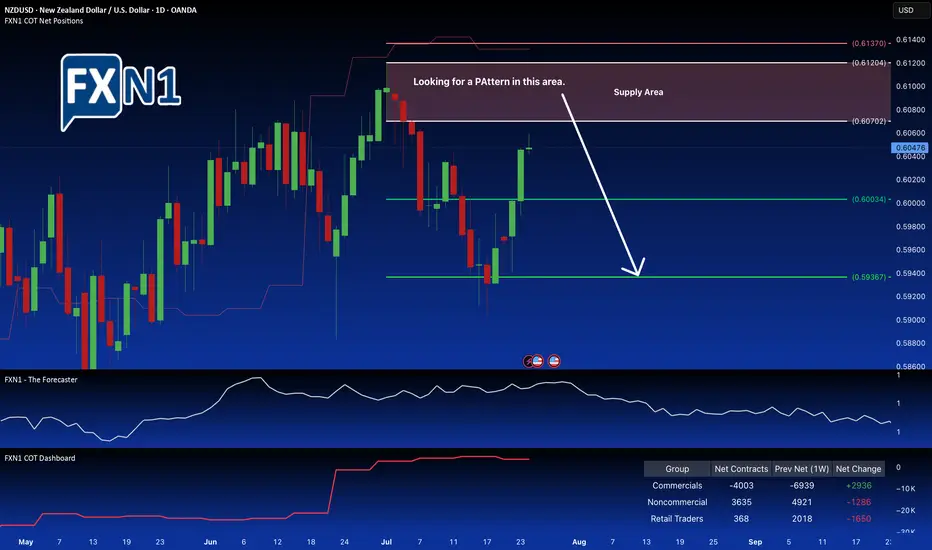
NZD/USD Weekly Bearish Trend Faces Critical Supply LevelThe NZD/USD pair is nearing a significant supply zone near 0.6070, where notable market activity is unfolding. Non-commercial traders are beginning to trim their holdings, signaling a potential shift in market sentiment. Conversely, commercial traders are at their lowest net positions since August 2024 and are starting to accumulate again, creating a divergence between these two groups.
This divergence, combined with the presence of a defined supply area and seasonal factors, suggests a possible reversal point in the current downtrend. On the weekly chart, the overall trend remains bearish, but the confluence of these technical and seasonal signals points toward a potential reversal pattern forming within the supply zone.
Traders may consider monitoring this area for signs of a reversal, potentially setting up for a short position if a clear pattern confirms the shift in momentum. Overall, the setup indicates a cautious opportunity for a bearish trade, provided the price action confirms the anticipated reversal.
✅ Please share your thoughts about NZD/USD in the comments section below and HIT LIKE if you appreciate my analysis. Don't forget to FOLLOW ME; you will help us a lot with this small contribution.
Bullish bounce for the Kiwi?The price is falling towards the pivot, which has been identified as an overlap support and could bounce to the 1st resistance, which acts as a pullback resistance.
Pivot: 0.6038
1st Support: 0.5999
1st Resistance: 0.6079
Risk Warning:
Trading Forex and CFDs carries a high level of risk to your capital and you should only trade with money you can afford to lose. Trading Forex and CFDs may not be suitable for all investors, so please ensure that you fully understand the risks involved and seek independent advice if necessary.
Disclaimer:
The above opinions given constitute general market commentary, and do not constitute the opinion or advice of IC Markets or any form of personal or investment advice.
Any opinions, news, research, analyses, prices, other information, or links to third-party sites contained on this website are provided on an "as-is" basis, are intended only to be informative, is not an advice nor a recommendation, nor research, or a record of our trading prices, or an offer of, or solicitation for a transaction in any financial instrument and thus should not be treated as such. The information provided does not involve any specific investment objectives, financial situation and needs of any specific person who may receive it. Please be aware, that past performance is not a reliable indicator of future performance and/or results. Past Performance or Forward-looking scenarios based upon the reasonable beliefs of the third-party provider are not a guarantee of future performance. Actual results may differ materially from those anticipated in forward-looking or past performance statements. IC Markets makes no representation or warranty and assumes no liability as to the accuracy or completeness of the information provided, nor any loss arising from any investment based on a recommendation, forecast or any information supplied by any third-party.
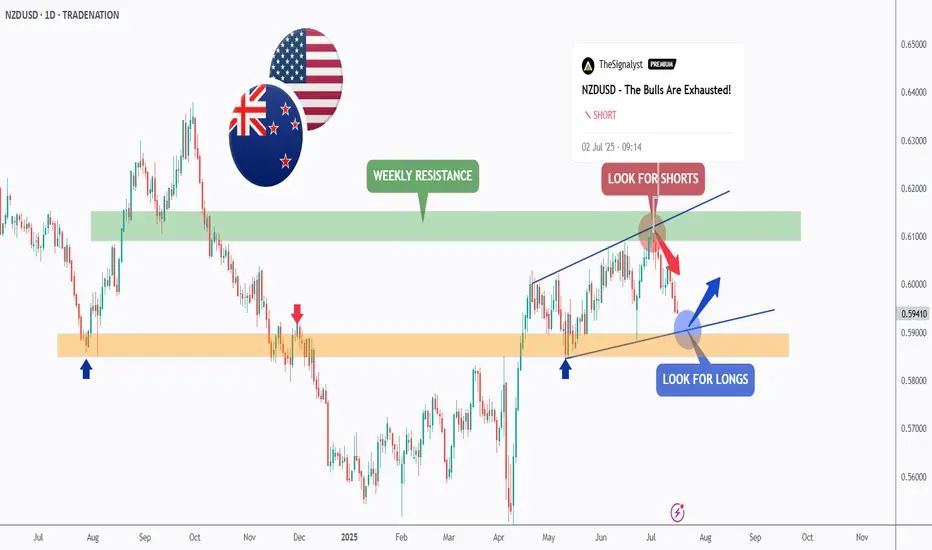
NZDUSD - It is Time!Hello TradingView Family / Fellow Traders. This is Richard, also known as theSignalyst.
As per our last NZDUSD analysis, attached on the chart, it rejected the upper bound of the blue wedge pattern and traded lower.
📈This week, NZDUSD is retesting the lower bound of the wedge.
Moreover, the orange zone is a strong weekly support.
🏹 Thus, the highlighted blue circle is a strong area to look for buy setups as it is the intersection of the lower blue trendline and orange support.
📚 As per my trading style:
As #NZDUSD approaches the blue circle zone, I will be looking for bullish reversal setups (like a double bottom pattern, trendline break , and so on...)
📚 Always follow your trading plan regarding entry, risk management, and trade management.
Good luck!
All Strategies Are Good; If Managed Properly!
~Rich
Disclosure: I am part of Trade Nation's Influencer program and receive a monthly fee for using their TradingView charts in my analysis.
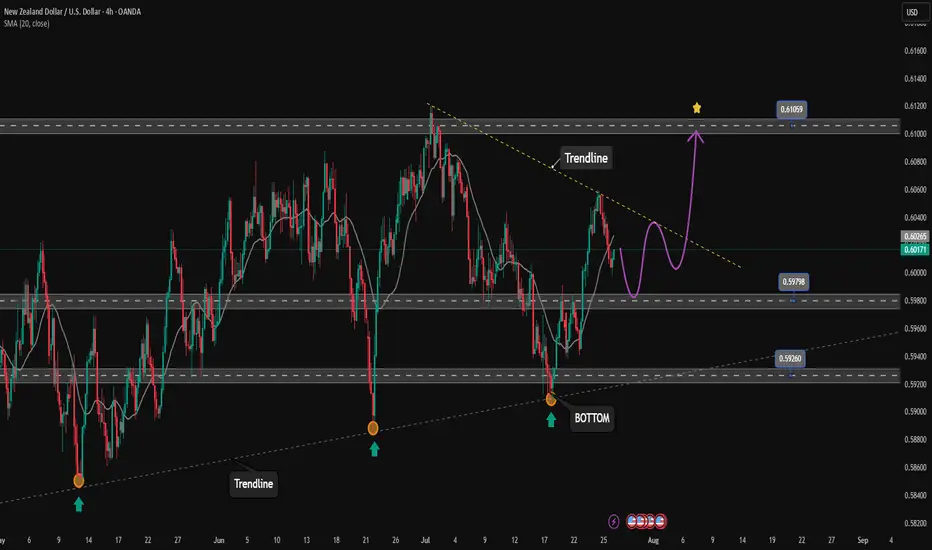
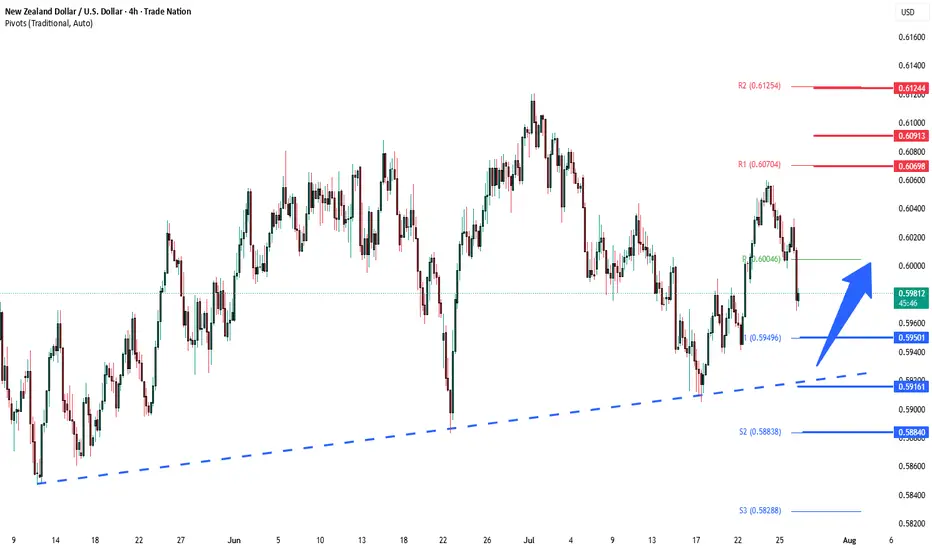
NZDUSD overbought pullback support at 0.5950The NZDUSD remains in a bullish trend, with recent price action showing signs of a corrective pullback within the broader uptrend.
Support Zone: 0.5950 – a key level from previous consolidation. Price is currently testing or approaching this level.
A bullish rebound from 0.5950 would confirm ongoing upside momentum, with potential targets at:
0.6070 – initial resistance
0.6090 – psychological and structural level
0.6125 – extended resistance on the longer-term chart
Bearish Scenario:
A confirmed break and daily close below 0.5950 would weaken the bullish outlook and suggest deeper downside risk toward:
0.5915 – minor support
0.5885 – stronger support and potential demand zone
Outlook:
Bullish bias remains intact while the NZDUSD holds above 0.5950 A sustained break below this level could shift momentum to the downside in the short term.
This communication is for informational purposes only and should not be viewed as any form of recommendation as to a particular course of action or as investment advice. It is not intended as an offer or solicitation for the purchase or sale of any financial instrument or as an official confirmation of any transaction. Opinions, estimates and assumptions expressed herein are made as of the date of this communication and are subject to change without notice. This communication has been prepared based upon information, including market prices, data and other information, believed to be reliable; however, Trade Nation does not warrant its completeness or accuracy. All market prices and market data contained in or attached to this communication are indicative and subject to change without notice.
NZDUSD Potential UpsidesHey Traders, in today's trading session we are monitoring NZDUSD for a buying opportunity around 0.59800 zone, NZDUSD is trading in an uptrend and currently is in a correction phase in which it is approaching the trend at 0.59800 support and resistance area.
Trade safe, Joe.

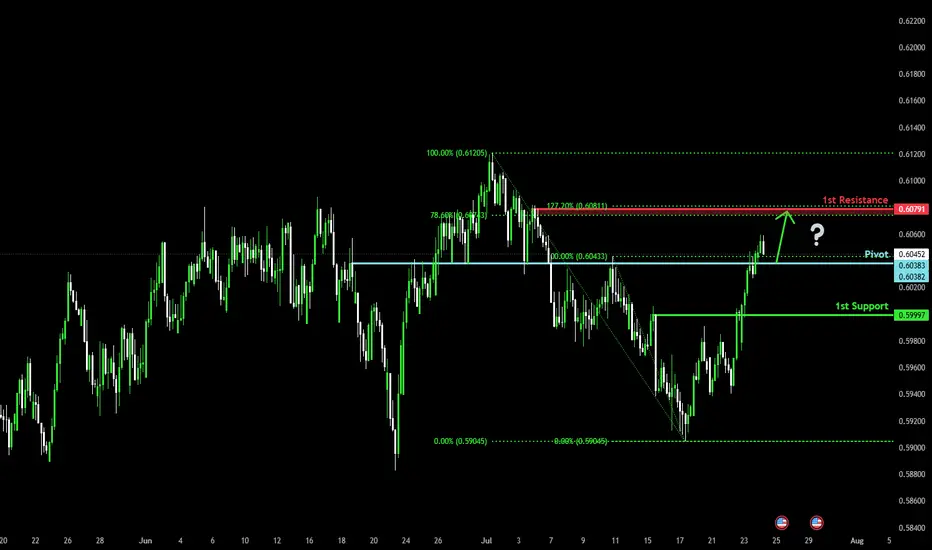
Could the Kiwi reverse from here?The price is rising towards the pivot, which acts as an overlap resistance that aligns with the 61.8% Fibonacci retracement and could reverse to the 1st support which is an overlap support.
Pivot: 0.6038
1st Support: 0.5979
1st Resistance: 0.6115
Risk Warning:
Trading Forex and CFDs carries a high level of risk to your capital and you should only trade with money you can afford to lose. Trading Forex and CFDs may not be suitable for all investors, so please ensure that you fully understand the risks involved and seek independent advice if necessary.
Disclaimer:
The above opinions given constitute general market commentary, and do not constitute the opinion or advice of IC Markets or any form of personal or investment advice.
Any opinions, news, research, analyses, prices, other information, or links to third-party sites contained on this website are provided on an "as-is" basis, are intended only to be informative, is not an advice nor a recommendation, nor research, or a record of our trading prices, or an offer of, or solicitation for a transaction in any financial instrument and thus should not be treated as such. The information provided does not involve any specific investment objectives, financial situation and needs of any specific person who may receive it. Please be aware, that past performance is not a reliable indicator of future performance and/or results. Past Performance or Forward-looking scenarios based upon the reasonable beliefs of the third-party provider are not a guarantee of future performance. Actual results may differ materially from those anticipated in forward-looking or past performance statements. IC Markets makes no representation or warranty and assumes no liability as to the accuracy or completeness of the information provided, nor any loss arising from any investment based on a recommendation, forecast or any information supplied by any third-party.

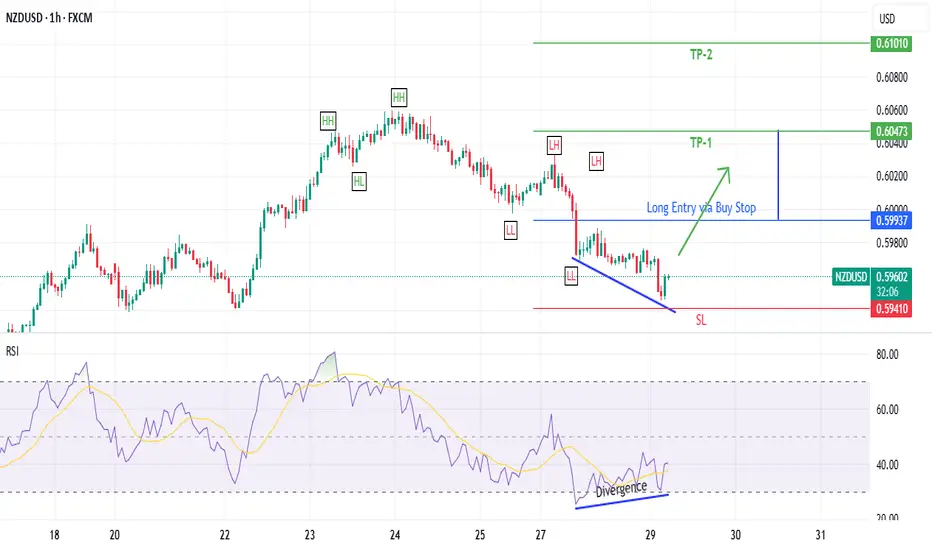
NZD/USD – 1H | Bearish Setup at Breakout of LL| AB=CD HarmonicsWe’re currently eyeing a bearish continuation on NZD/USD based on clear market structure and harmonic confirmation.
📉 Trend: Bearish
🔍 Divergence: Bearish
📐 Harmonics: AB=CD pattern
📊 Bias: Bearish
🧠 Technical Breakdown
✅ Price has broken the previous Higher Low , confirming a structural shift.
✅ A Lower High is about to form — Now we’re waiting for the breakout of the previous Lower Low to confirm trend continuation.
✅ We’ve placed a Sell Stop below that Lower L ow, targeting bearish continuation.
✅ The AB=CD harmonic pattern shows potential for extended downside — reversal zone still far.
📌 Trade Setup
🔹 Entry: Sell Stop @ 0.59965 (breakout of Lower Low)
🔹 Stop Loss: 0.60614
🔹 Take Profit: 0.59316
🔹 Risk/Reward: 1:1
🔹 Lot Size: 0.38
🔹 Risk: $200
🔹 Reward: $200
⚠️ Note: This is a pending setup. Trade only triggers on the breakout of the previous Lower Low, keeping the bearish structure intact.
#NZDUSD #ForexSetup #BearishBreakout #LowerLow #PriceAction #SmartMoney #ABCDPattern
#HarmonicTrading #ForexStrategy #SellSetup #TradingView #FXMarket #ForexSignals
#DayTrading #SwingTrading #ChartAnalysis #TradeSmart #ForexTrader #RiskManagement
#ForexEducation #BearishStructure #FibonacciTrading #MarketStructure #BreakoutTrade
#TradersOfInstagram #TradersOfTradingView #CryptoAndForex

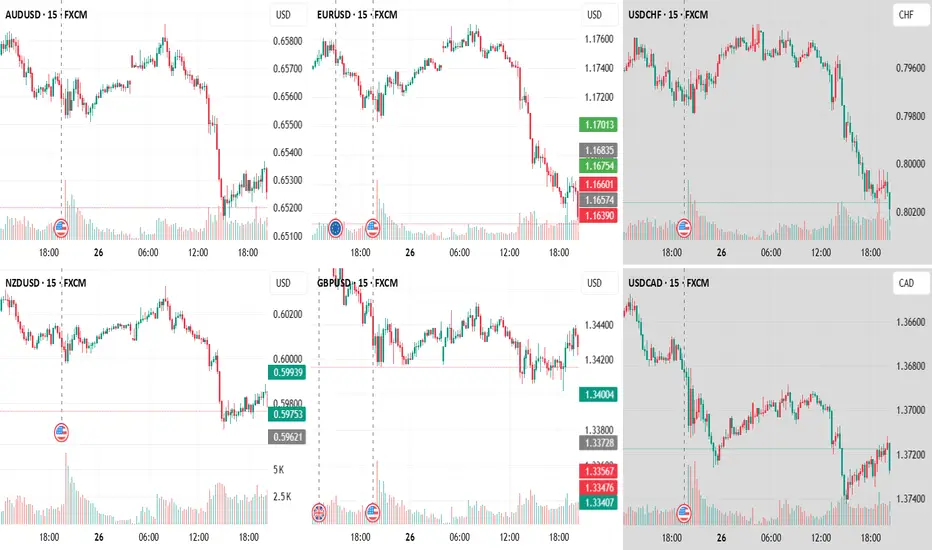
looking at usd groupnzdusd seems to be going up. with sister pair audusd and usdcad
+ usd showing immediate strength
- going up movement slow
- previous down is very strong
waiting the sellers to die out
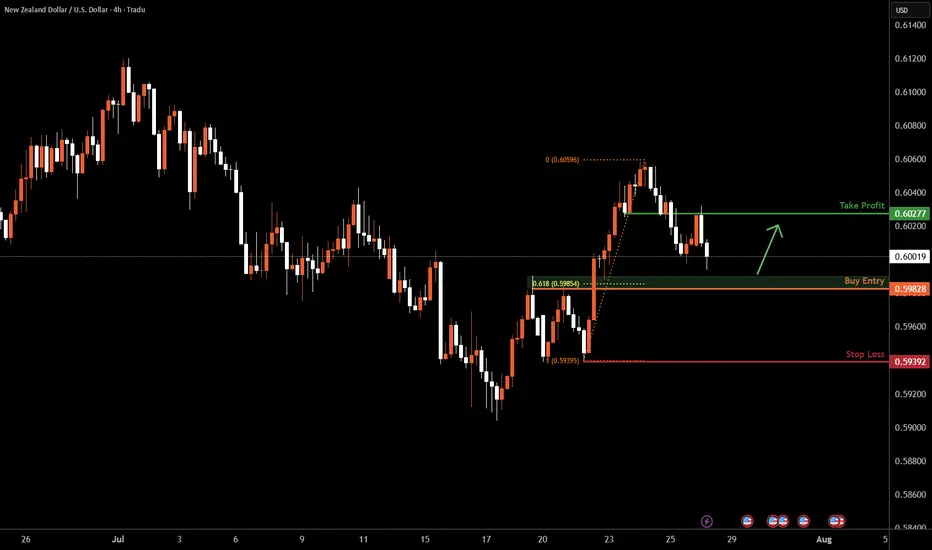
NZDUSD H4 I Bullish Bounce off the 61.8% Based on the H4 chart analysis, we can see that the price is falling toward our buy entry at 0.5982, which is a pullback support that aligns with the 61.8% Fib retracement.
Our take profit will be at 0.6027, which is an overlap resistance level.
The stop loss will be placed at 0.5939, a swing low support.
High Risk Investment Warning
Trading Forex/CFDs on margin carries a high level of risk and may not be suitable for all investors. Leverage can work against you.
Stratos Markets Limited (tradu.com ):
CFDs are complex instruments and come with a high risk of losing money rapidly due to leverage. 66% of retail investor accounts lose money when trading CFDs with this provider. You should consider whether you understand how CFDs work and whether you can afford to take the high risk of losing your money.
Stratos Europe Ltd (tradu.com ):
CFDs are complex instruments and come with a high risk of losing money rapidly due to leverage. 66% of retail investor accounts lose money when trading CFDs with this provider. You should consider whether you understand how CFDs work and whether you can afford to take the high risk of losing your money.
Stratos Global LLC (tradu.com ):
Losses can exceed deposits.
Please be advised that the information presented on TradingView is provided to Tradu (‘Company’, ‘we’) by a third-party provider (‘TFA Global Pte Ltd’). Please be reminded that you are solely responsible for the trading decisions on your account. There is a very high degree of risk involved in trading. Any information and/or content is intended entirely for research, educational and informational purposes only and does not constitute investment or consultation advice or investment strategy. The information is not tailored to the investment needs of any specific person and therefore does not involve a consideration of any of the investment objectives, financial situation or needs of any viewer that may receive it. Kindly also note that past performance is not a reliable indicator of future results. Actual results may differ materially from those anticipated in forward-looking or past performance statements. We assume no liability as to the accuracy or completeness of any of the information and/or content provided herein and the Company cannot be held responsible for any omission, mistake nor for any loss or damage including without limitation to any loss of profit which may arise from reliance on any information supplied by TFA Global Pte Ltd.
The speaker(s) is neither an employee, agent nor representative of Tradu and is therefore acting independently. The opinions given are their own, constitute general market commentary, and do not constitute the opinion or advice of Tradu or any form of personal or investment advice. Tradu neither endorses nor guarantees offerings of third-party speakers, nor is Tradu responsible for the content, veracity or opinions of third-party speakers, presenters or participants.
NZD/USD – A Bullish Opportunity You Shouldn't MissNZD/USD is showing a clear bullish structure across multiple timeframes:
Weekly: Overall trend remains bullish.
Daily: Structure flipped bullish on July 23, 2025, confirmed by a strong bullish engulfing candle.
4H: Also aligned bullish, adding further confluence.
We are now anticipating a retest near the previous Daily Higher Low (HL) — likely around a round psychological level. This zone may offer a textbook HL formation and a high-probability long setup.
📍 Potential Trade Plan
Entry: Around 0.6000
Take Profit: 0.6160
Stop Loss: 0.5960
⚠️ This is not financial advice. Please do your own research and analysis before entering any trade. I am not responsible for any potential losses.

NZDUSD TRADE SETUPWait for retest the entry and bullish momentum then take a trade for Buy otherwise skip this setup
