USDNZD trade ideas

NZDUSD Massive Bullish Breakout!
HI,Traders !
#NZDUSD is trading in a strong
Uptrend and the price just
Made a massive bullish
Breakout of the falling
Resistance line and the
Breakout is confirmed
So after a potential pullback
We will be expecting a
Further bullish continuation !
Comment and subscribe to help us grow !

7.25 NZD/USD ADDED TO WATCHLIST👀 NZD/USD – Watchlist Setup Forming (VMS Strategy)
Monitoring NZD/USD as it pulls back toward a key support/resistance zone.
What we need to see for a valid setup:
✅ Price to reach the S/R zone
✅ Strong volume building in the trade direction
✅ Momentum aligned or hooking down
✅ A clean engulfing candle near the 50EMA
📌 The setup isn’t ready yet—but it’s developing. Patience pays.
We’ll keep watching and follow the VMS rules without compromise.

NZDUSD: Free Trading Signal
NZDUSD
- Classic bullish setup
- Our team expects bullish continuation
SUGGESTED TRADE:
Swing Trade
Long NZDUSD
Entry Point - 0.6013
Stop Loss - 0.6004
Take Profit - 0.6028
Our Risk - 1%
Start protection of your profits from lower levels
Disclosure: I am part of Trade Nation's Influencer program and receive a monthly fee for using their TradingView charts in my analysis.
❤️ Please, support our work with like & comment! ❤️

NZDUSDNZDUSD price is near the support zone 0.59197-0.58790. If the price cannot break through the 0.58790 level, it is expected that the price will rebound. Consider buying the red zone.
🔥Trading futures, forex, CFDs and stocks carries a risk of loss.
Please consider carefully whether such trading is suitable for you.
>>GooD Luck 😊
❤️ Like and subscribe to never miss a new idea!

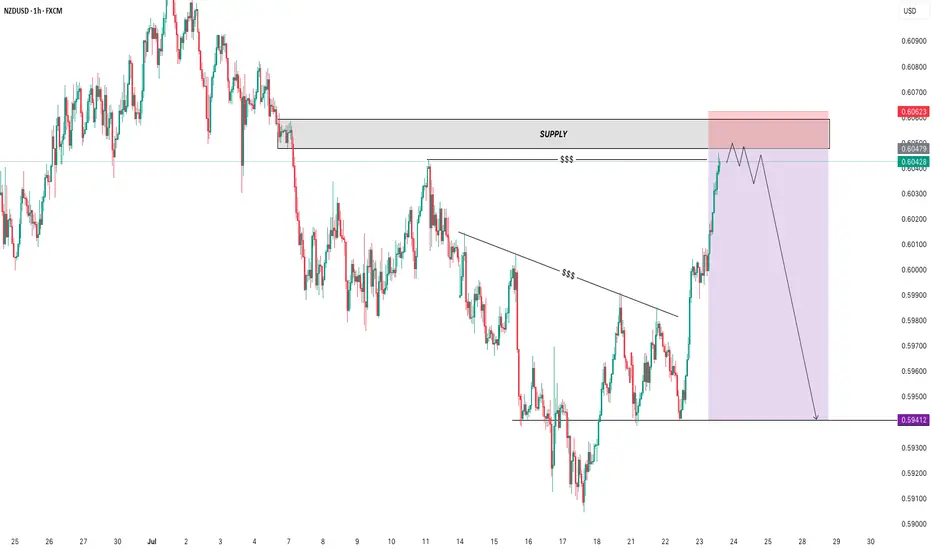
SELL NZDUSDIn todays session we are actively monitoring NZDUSD for selling opportunity. Our first entry in ASIA session is at 0.60478 we anticipate a short rally up to our second re-entry at 0.60750. Our stops are above 0.6100 and our targets are at 0.59540. Use your own risk management and entry criteria and best of luck.
New algo entry model is under testing.

Lingrid | NZDUSD Potential Market Correction From ResistanceFX:NZDUSD has approached a key resistance zone at 0.6040 after completing an A-B-C upward move and forming a potential lower high. Price is testing both horizontal and trendline resistance, suggesting exhaustion within the broader upward move. A failure to hold above the 0.6040 area may trigger a reversal toward the 0.5991 support zone. The structure favors a bearish pullback if the breakout is rejected.
📉 Key Levels
Sell trigger: Rejection from 0.6045
Sell zone: 0.6035–0.6045
Target: 0.5991
Invalidation: Close above 0.6055
💡 Risks
Clean breakout above resistance zone
Strengthening NZD from risk sentiment shift
Holding above upward trendline support
If this idea resonates with you or you have your own opinion, traders, hit the comments. I’m excited to read your thoughts!

NZDUSD What Next? SELL!
My dear subscribers,
This is my opinion on the NZDUSD next move:
The instrument tests an important psychological level 0.6033
Bias - Bearish
Technical Indicators: Supper Trend gives a precise Bearish signal, while Pivot Point HL predicts price changes and potential reversals in the market.
Target - 0.5987
My Stop Loss - 0.6061
About Used Indicators:
On the subsequent day, trading above the pivot point is thought to indicate ongoing bullish sentiment, while trading below the pivot point indicates bearish sentiment.
Disclosure: I am part of Trade Nation's Influencer program and receive a monthly fee for using their TradingView charts in my analysis.
———————————
WISH YOU ALL LUCK

NZDUSD: Time For Pullback 🇳🇿🇺🇸
I think that NZDUSD will retrace from the underlined resistance.
As a confirmation, I spotted a bearish imbalance candle on an hourly time frame
after its test.
There is a high chance to see a retracement.
Goal - 0.602
❤️Please, support my work with like, thank you!❤️

SELL NZDUSD SELL NZDUSD , without negleting the power of barish movement in NZDUSD the market has managed to make a maium retst towards a POI with liquidty swap where i expect the market to tur into a very shapbearish movement
remember to manage ur trades , use proper risk management and good luck family
23.07.25 Morning ForecastPairs on Watch -
FX:GBPUSD
CAPITALCOM:DE40
FX:NZDUSD
A short overview of the instruments I am looking at for today, multi-timeframe analysis down to what I will be looking at for an entry. Enjoy!

NZDUSD BUY 0.5990On the 4-hour chart, NZDUSD formed a bullish bat pattern and then stabilized and rebounded, and short-term bulls have the upper hand. Currently, you can pay attention to the support near 0.5990. If it stabilizes, you can consider going long. The upper resistance is 0.6080-0.6120 area.

NZDUSD BUY SETUP LOOOONGLook in this photo
The price
The price on the four-hour frame has a strong upward momentum and is in a cheap area relative to the consolidation area it is in, but it should have broken the downtrend on the quarter-hour frame.

NZDUSD SELLTook a sell on NZDUSD. The long-term price action is bearish, and the price has already returned, looking for a continuation lower. With DXY expecting to rise, you should see this pair drop due to weakness in NZD.

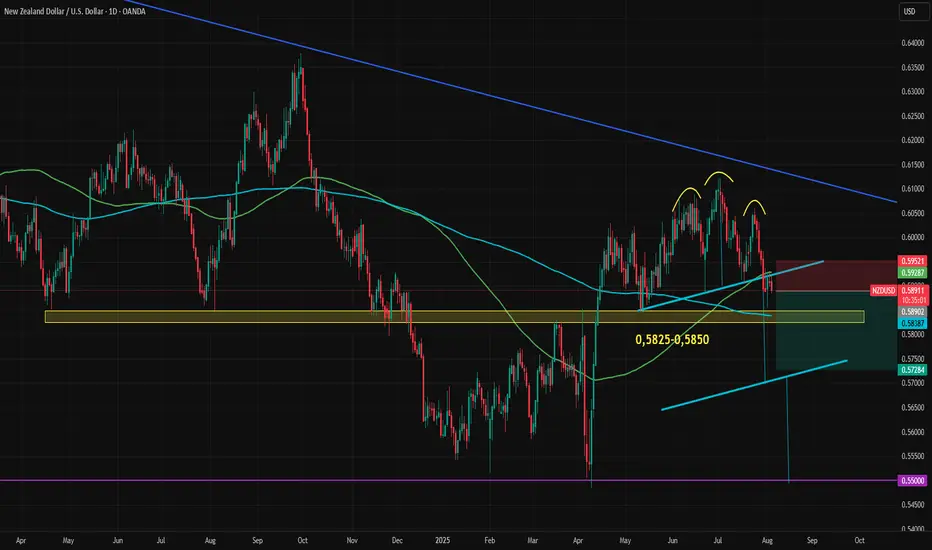
NZDUSD Stuck with Conflicting SignalsNZDUSD is at a key technical junction. The previously broken and retested head and shoulders formation is exerting downward pressure, but the important support zone between 0.5825 and 0.5850 is holding for now. The 100-day and 200-day moving averages have also formed a tight support-resistance range, causing the currency to remain trapped in a narrow range.
Both the Federal Reserve and the Reserve Bank of New Zealand are expected to cut rates twice this year. Growth expectations for 2025 are closely aligned, with only a 0.3-point advantage for the U.S., and the gap is narrowing. Inflation expectations are also similar, with U.S. figures slightly higher, mirroring the GDP trend.
The 2-year bond yield spread between the U.S. and New Zealand has remained flat since April. During that time, NZDUSD climbed from 0.55 to 0.61 before pulling back to the current level near 0.5890.
Similar fundamental statistics and conflicting technical signals have caused NZDUSD to form an uncertain range between 0.5930 on the upside and the 0.5825–0.5850 support zone on the downside. If either of these key levels breaks, volatility may return quickly.
A break above 0.5930, which coincides with both the broken neckline and the 100-day moving average, could push the price toward the descending trendline from the 2021 top (highlighted in blue on the chart). On the other hand, a break below the 0.5825–0.5850 zone which also includes the 200-day moving average, could trigger a move toward the head and shoulders pattern target, currently near 0.57.
The first two weeks of August will be crucial for the dollar index, following the sharp downward revision in payrolls data. Market reaction, revisions to expectations, commentary from Federal Reserve members, and the release of July inflation data will provide greater clarity. This wave of information could finally break NZDUSD out of its current indecisive range.
NZD/USD Analysis Based on Volume, Fibonacci & Stochastic
This NZD/USD setup is developed using:
Volume analysis to highlight market participation zones
Fibonacci levels to confirm technical structure
Stochastic indicator to find precise entry timing
🔹 Entry: 0.5892
🔹 Take-Profit: 0.5864
🔹 Stop-Loss: 0.5909
🔹 Risk-to-Reward Ratio: 1.64
⚠️ Disclaimer: This analysis is for educational purposes only and is not financial advice. Always trade with proper risk management.

NZDUSD long trade dated 29 July 2025- Breakout of last LH will suggest that the odds are in favour of the long trade
- Presence of a bullish AB=CD pattern increases our chances. However entry set via Buy Stop after confirmed trend reversal

ENTRY NZDUSDDisclaimer:
This is merely a chart-based analytical trading idea and is not considered investment advice. Please manage your risks carefully and conduct your own research before making any trading decisions.


NZDUSD Short ProjectHi guys...😎
It's time to do a Short Project on NZDUSD with 3 key reasons:
1. Price Drivers: institutional shorting
2. Trend: down
3. Momentum: bearish
Action: waiting for entry on the intraday timeframe (entry will be published further)
Nzdusd We hv price on a down trend so we are expecting a retracment back to de zone and a change of structure on the 4h then I sell

NZD/USDThis analysis is based on a combination of volume analysis, Fibonacci retracement levels, and Stochastic oscillator signals to identify a high-probability entry point. The trade setup suggests a potential bearish move following confirmation from volume patterns and momentum indicators.
Entry: 0.5907 area
Stop-Loss: 0.5916 area
Take-Profit: 0.5893 area
This setup targets a short-term downward correction within a key Fibonacci zone, supported by weakening volume and an overbought signal from the Stochastic indicator.
⚠️ Disclaimer:
This is not financial advice. Trading involves risk and may not be suitable for all investors. Always conduct your own analysis and use proper risk management.

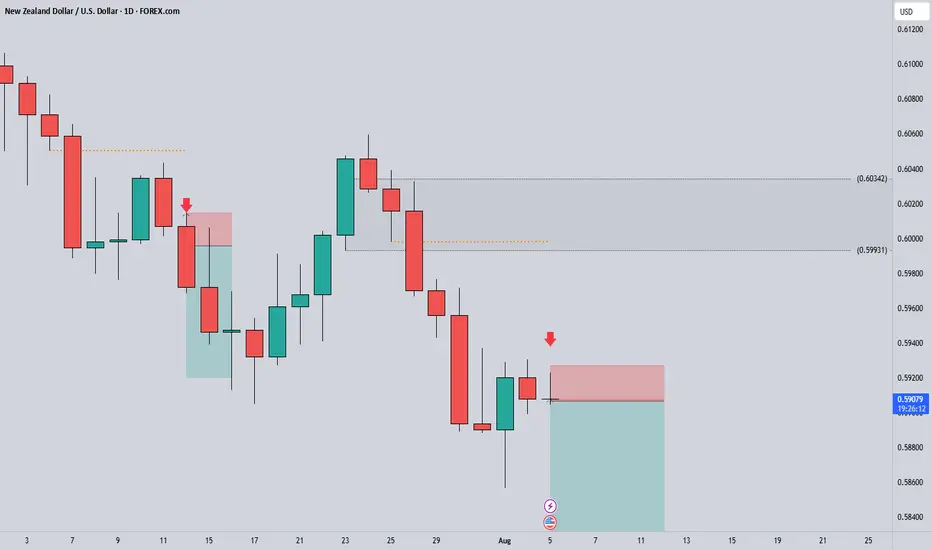
NZDUSD BUY TRADE PLAN (PULLBACK)📋 TRADE PLAN – NZDUSD (SHORT-TERM BUY SCENARIO)
📅 Date Issued: August 4, 2025
🔍 1. TOP-DOWN STRUCTURAL CONTEXT
🟣 D1 TIMEFRAME
Price has printed a strong rejection wick near 0.5885 support zone.
Structure: Currently in a D1 pullback phase within broader bearish context.
Reaction: First clean bullish candle printed after 3 consecutive bearish days.
🔵 H4 TIMEFRAME
Bullish engulfing printed (August 2, 12:00) from support at ~0.5880.
Price is now consolidating above this reaction zone, respecting structure.
Micro higher low formed; potential to extend pullback toward 0.5950–0.5975 range.
🟢 H1 TIMEFRAME
Retest structure forming between 0.5895 – 0.5908.
Multiple wick rejections showing buyers defending liquidity pocket.
Price forming tight intraday range post bullish impulse.
🧠 2. INSTITUTIONAL ZONE CLASSIFICATION
Type Level Status Freshness RR Quality Origin Timeframe
Demand (Primary) 0.5880–0.5890 ✅ Mitigated Clean Good H4
Supply (Target Zone) 0.5950–0.5970 🟡 Pending Fresh High H4
Demand (Backup) 0.5850 🟡 Untapped Fresh Moderate D1
✅ 3. TRADE PLAN STATUS:
🟢 ACTIVE – Confirmation Printed
H4 Bullish Engulfing confirmed on August 2 (12:00 candle) from 0.5880 zone.
H1 is consolidating post-impulse, showing compression + wick defense.
Structure supports short-term pullback upside.
🧭 4. EXECUTION DETAILS
Parameter Value
Entry Zone 0.5900 – 0.5908 (H1 compression)
Stop Loss 0.5875 (below H4 demand wick)
TP1 0.5950 (first H4 supply)
TP2 0.5970 (full imbalance fill)
Risk Model 0.5–1.0% per entry
Trade Type Pullback Continuation (Intraday)
🔁 5. CONFIRMATION DETAILS
Candle Type: H4 Bullish Engulfing
Candle Time: H4, August 2 @ 12:00
Behavior: Large rejection wick + body close above previous structure
Volume Context: Expansion candle → first impulsive buy leg from demand
🧠 6. RISK NOTES
This is not a long-term reversal, but a pullback trade.
Invalidation on clean close below 0.5875.
Failure to break 0.5950 decisively may indicate early reversal or range continuation.
🔄 7. ZONE ESCALATION REMINDER
📌 High-Probability Sell Zone (Future Conditional Setup)
Zone: 0.5975–0.5995 (D1–H4 origin supply)
Status: 🟡 Conditional – Awaiting price arrival
Setup Type: HTF Mean Reversion (probability increase if compression into zone)
✅ FINAL TRADE LABEL
🟢 NZDUSD INTRADAY BUY PLAN
Entry: 0.5900–0.5908 | SL: 0.5875 | TP1: 0.5950 | TP2: 0.5970
Status: ACTIVE – H4 Bullish Engulfing confirmed
Context: Short-term continuation from demand. Risk managed pullback play.
