NZDUSD BUY TRADE PLAN (PULLBACK)📋 TRADE PLAN – NZDUSD (SHORT-TERM BUY SCENARIO)
📅 Date Issued: August 4, 2025
🔍 1. TOP-DOWN STRUCTURAL CONTEXT
🟣 D1 TIMEFRAME
Price has printed a strong rejection wick near 0.5885 support zone.
Structure: Currently in a D1 pullback phase within broader bearish context.
Reaction: First clean bullish candle printed after 3 consecutive bearish days.
🔵 H4 TIMEFRAME
Bullish engulfing printed (August 2, 12:00) from support at ~0.5880.
Price is now consolidating above this reaction zone, respecting structure.
Micro higher low formed; potential to extend pullback toward 0.5950–0.5975 range.
🟢 H1 TIMEFRAME
Retest structure forming between 0.5895 – 0.5908.
Multiple wick rejections showing buyers defending liquidity pocket.
Price forming tight intraday range post bullish impulse.
🧠 2. INSTITUTIONAL ZONE CLASSIFICATION
Type Level Status Freshness RR Quality Origin Timeframe
Demand (Primary) 0.5880–0.5890 ✅ Mitigated Clean Good H4
Supply (Target Zone) 0.5950–0.5970 🟡 Pending Fresh High H4
Demand (Backup) 0.5850 🟡 Untapped Fresh Moderate D1
✅ 3. TRADE PLAN STATUS:
🟢 ACTIVE – Confirmation Printed
H4 Bullish Engulfing confirmed on August 2 (12:00 candle) from 0.5880 zone.
H1 is consolidating post-impulse, showing compression + wick defense.
Structure supports short-term pullback upside.
🧭 4. EXECUTION DETAILS
Parameter Value
Entry Zone 0.5900 – 0.5908 (H1 compression)
Stop Loss 0.5875 (below H4 demand wick)
TP1 0.5950 (first H4 supply)
TP2 0.5970 (full imbalance fill)
Risk Model 0.5–1.0% per entry
Trade Type Pullback Continuation (Intraday)
🔁 5. CONFIRMATION DETAILS
Candle Type: H4 Bullish Engulfing
Candle Time: H4, August 2 @ 12:00
Behavior: Large rejection wick + body close above previous structure
Volume Context: Expansion candle → first impulsive buy leg from demand
🧠 6. RISK NOTES
This is not a long-term reversal, but a pullback trade.
Invalidation on clean close below 0.5875.
Failure to break 0.5950 decisively may indicate early reversal or range continuation.
🔄 7. ZONE ESCALATION REMINDER
📌 High-Probability Sell Zone (Future Conditional Setup)
Zone: 0.5975–0.5995 (D1–H4 origin supply)
Status: 🟡 Conditional – Awaiting price arrival
Setup Type: HTF Mean Reversion (probability increase if compression into zone)
✅ FINAL TRADE LABEL
🟢 NZDUSD INTRADAY BUY PLAN
Entry: 0.5900–0.5908 | SL: 0.5875 | TP1: 0.5950 | TP2: 0.5970
Status: ACTIVE – H4 Bullish Engulfing confirmed
Context: Short-term continuation from demand. Risk managed pullback play.
USDNZD trade ideas

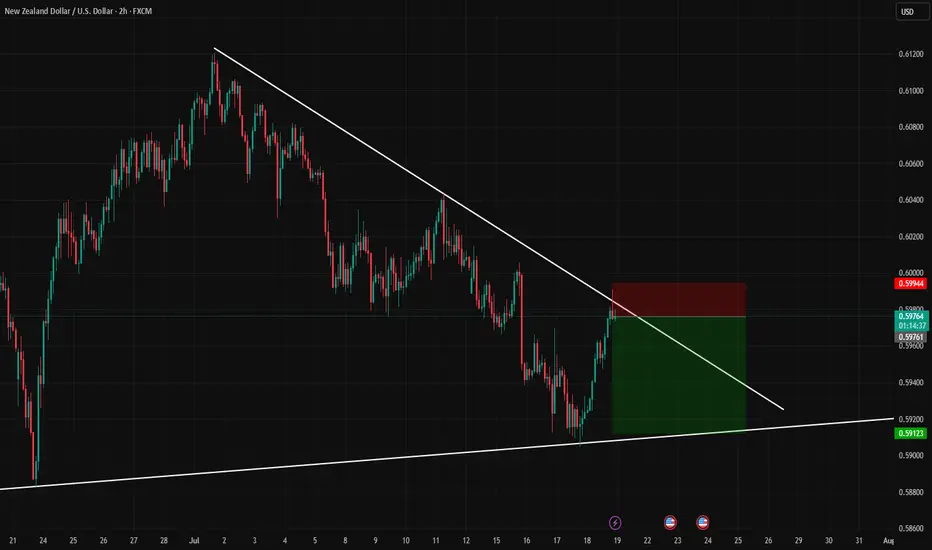
NZDUSD LTF Triangle being formedNZDUSD is going up in all TF's.
A very small triangle is spotted in this case, we will wait for break to the upside to enter into the market.

Head and Shoulders on NZDUSDWe are seeing a Head and Shoulders Reversal Pattern on the NZDUSD 1D chart.
If the price goes below the 0.58900, we will see a further downtrend.

NZDUSD is in the Selling DirectionHello Traders
In This Chart NZDUSD HOURLY Forex Forecast By FOREX PLANET
today GBPUSD analysis 👆
🟢This Chart includes_ (NZDUSD market update)
🟢What is The Next Opportunity on NZDUSD Market
🟢how to Enter to the Valid Entry With Assurance Profit
This CHART is For Trader's that Want to Improve Their Technical Analysis Skills and Their Trading By Understanding How To Analyze The Market Using Multiple Timeframes and Understanding The Bigger Picture on the Charts

NZD/USDThis is a trade setup for NZD/USD, based on volume and trend analysis.
Entry Price: 0.58742
Stop-Loss (SL): 0.58892
Take-Profit (TP): 0.58582
The trade is intended to be executed instantly at the mentioned price, in alignment with both volume behavior and the current trend direction.
Disclaimer: This setup is shared purely for backtesting purposes and to document trade ideas. It is not financial advice. Always perform your own analysis before making any trading decisions.

NZDUSD in bearish trend NZDUSD in bearish trend with bullish RSI diversion and 91% long bias, entry with a Buy stop above the last Lower High RR 1:1

ENTRY NZDUSDDisclaimer:
This is merely a chart-based analytical trading idea and is not considered investment advice. Please manage your risks carefully and conduct your own research before making any trading decisions.


NZDUSD potential 600 pips in makingPrice of NZDUSD have made a structure that has a high probability to be a triangle just after a leading diagonal. If this view is favored then we should expect price to regain its bullish momentum to make wave C. To take advantage of this possibility a trade should find areas of support to go long. One of the places is as marked on the chart on lower trendline of the triangle.

NZDUSD: Market Sentiment & Price Action
Looking at the chart of NZDUSD right now we are seeing some interesting price action on the lower timeframes. Thus a local move up seems to be quite likely.
Disclosure: I am part of Trade Nation's Influencer program and receive a monthly fee for using their TradingView charts in my analysis.
❤️ Please, support our work with like & comment! ❤️

NZDUSDT Long Looking to enter NZD/USD around 0.59250 at the Order Block due to a liquidity inducement zone and potential Market Structure Shift (MSS).

NZDUSD LongNZDUSD broke the initial downtrend structure channel , which is where we started looking for buying opportunities.
the pair then created a retracement move.
it then created a reversal head and shoulders pattern.
signalling a move to the the upside again.

NZDUSD is forming an upward cycle trendKiwi dollar is strong at the moment.
It is in an upward trend. If the trend completes 2 cycles and maintains the upward trajectory, I will get in the trade as a Long/Buy.
Patiently watching if the trend continues or breaks down.

Kiwi H4 | Potential bullish bounceThe Kiwi (NZD/USD) is falling towards a pullback support and could potentially bounce off this level to climb higher.
Buy entry is at 0.6032 which is a pullback support.
Stop loss is at 0.5985 which is a level that lies underneath a pullback support and the 38.2% Fibonacci retracement.
Take profit is at 0.6078 which is a pullback resistance that aligns closely with the 78.6% Fibonacci retracement.
High Risk Investment Warning
Trading Forex/CFDs on margin carries a high level of risk and may not be suitable for all investors. Leverage can work against you.
Stratos Markets Limited (tradu.com ):
CFDs are complex instruments and come with a high risk of losing money rapidly due to leverage. 66% of retail investor accounts lose money when trading CFDs with this provider. You should consider whether you understand how CFDs work and whether you can afford to take the high risk of losing your money.
Stratos Europe Ltd (tradu.com ):
CFDs are complex instruments and come with a high risk of losing money rapidly due to leverage. 66% of retail investor accounts lose money when trading CFDs with this provider. You should consider whether you understand how CFDs work and whether you can afford to take the high risk of losing your money.
Stratos Global LLC (tradu.com ):
Losses can exceed deposits.
Please be advised that the information presented on TradingView is provided to Tradu (‘Company’, ‘we’) by a third-party provider (‘TFA Global Pte Ltd’). Please be reminded that you are solely responsible for the trading decisions on your account. There is a very high degree of risk involved in trading. Any information and/or content is intended entirely for research, educational and informational purposes only and does not constitute investment or consultation advice or investment strategy. The information is not tailored to the investment needs of any specific person and therefore does not involve a consideration of any of the investment objectives, financial situation or needs of any viewer that may receive it. Kindly also note that past performance is not a reliable indicator of future results. Actual results may differ materially from those anticipated in forward-looking or past performance statements. We assume no liability as to the accuracy or completeness of any of the information and/or content provided herein and the Company cannot be held responsible for any omission, mistake nor for any loss or damage including without limitation to any loss of profit which may arise from reliance on any information supplied by TFA Global Pte Ltd.
The speaker(s) is neither an employee, agent nor representative of Tradu and is therefore acting independently. The opinions given are their own, constitute general market commentary, and do not constitute the opinion or advice of Tradu or any form of personal or investment advice. Tradu neither endorses nor guarantees offerings of third-party speakers, nor is Tradu responsible for the content, veracity or opinions of third-party speakers, presenters or participants.

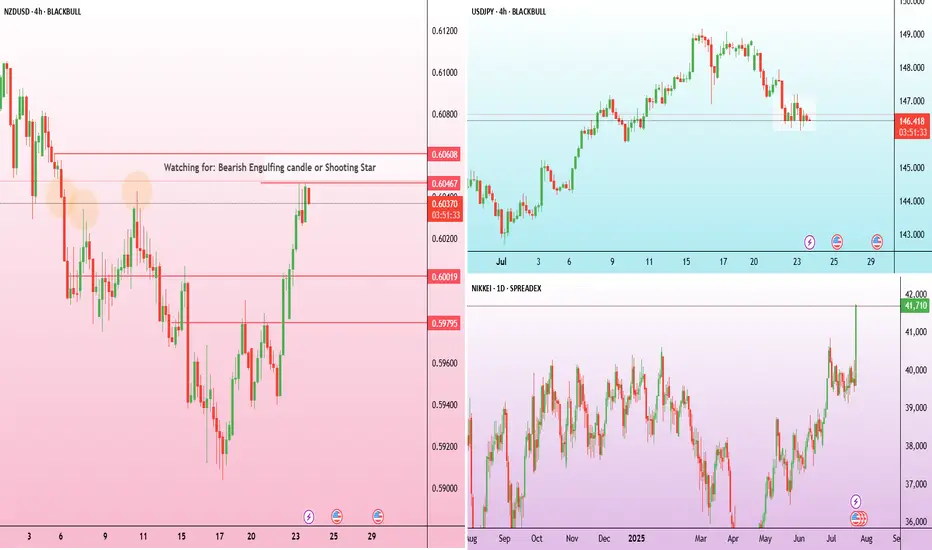
Kiwi climbs on risk-on flow – chart says more to come? The New Zealand dollar strengthened to around 0.6045, its highest level in over a week, supported by improved global risk sentiment following a breakthrough U.S.–Japan trade agreement.
The agreement, which lowers tariffs and boosts bilateral investment, triggered a surge in Japanese markets. Japan’s Nikkei 225 index jumped more than 3%, hitting a one-year high.
The breakout in NZDUSD was accompanied by a series of bullish candles with little to no upper wicks, evidence of minimal rejection from sellers. The most recent candles are consolidating just below the 0.6055 zone, which aligns with minor resistance from July 4.
Rejection from this area—especially if it prints a bearish engulfing or shooting star pattern—could signal a short-term pullback. On the downside, immediate support is now at 0.6000. If broken, the next support potentially lies around 0.5980, which was the last major swing low before the breakout.
NZDUSD Wave Analysis – 23 July 2025
- NZDUSD reversed from support zone
- Likely to rise to resistance level 0.6100
NZDUSD recently reversed up from the support zone located between the key support level 0.5920 (which stopped wave 4in the middle of June), lower daily Bollinger Band and the support trendline of the daily up channel from April.
The upward reversal from this support zone started the active intermediate correction (2).
Given the clear daily uptrend, NZDUSD can be expected to rise to the next resistance level 0.6100, target price for the completion of the active correction (2) (which has been reversing the price from June).

NZDUSD – Critical Price Action Ahead! (July 23 Analysis)NZDUSD – Critical Price Action Ahead! (July 23 Analysis)
As shown in the chart, NZDUSD has broken above a long-term descending trendline, followed by a pullback that successfully retested the trendline as support. This retest was backed by strong demand, preventing further decline.
However, price is now facing another descending trendline resistance, around the 0.61000 zone — a level that aligns with a previous key supply area.
🔍 If this resistance is broken on lower timeframes with a valid bullish confirmation, the next target could be 0.62000.
❗ But if the pair gets rejected at 0.61000, watch for possible support reactions at 0.59800 and 0.58700.
📈 This is a make-or-break zone for NZDUSD — stay sharp and don’t miss the next move!
👉 Follow for more clean, technical setups and real-time updates on major forex pairs.

Short NUAlthough now towards at the end of the week, I am gonna risk this entry as the setup looks okay, and currently the US is running strong in other pairs.
Bullish Continuation..?Resistance 1 Can touch 0.60443
Resistance 2 Can touch 0.60819
Resistance 3 Can touch 0.61210
Support 1 Can touch 0.60038
Support 2 Can touch 0.59968
Support 3 Can touch 0.59756
Disclaimer:
Trading foreign exchange (Forex) on margin involves a high level of risk and may not be suitable for all investors. The use of leverage can work both for and against you. Before deciding to participate in the Forex market, you should carefully consider your investment objectives, level of experience, and risk tolerance.
There is a possibility that you may incur a loss of some or all of your initial investment, and therefore, you should not invest money that you cannot afford to lose. Be fully aware of all the risks associated with foreign exchange trading, and seek advice from a licensed and independent financial advisor if you have any doubts.
Past performance is not indicative of future results. Always trade responsibly.

Buy and sell level nzdusd Now more buy side expected
Our marked sell level much strong to change the trend
Wait first to sweep high then sell after confirmation

NZDUSD - BUY Idea on H1A Long opportunity on NZD/USD after a divergence was formed, potentially changing the trend as it breaks the trendline and marks new Higher highs after a series of Lower lows and lower highs.
- Entry to be taken around the 0.5 to 0.61 fib levels
- Stop Loss below the previous Low
