NZDUSD SHORT SELLING # NZDUSD SHORT SELLING
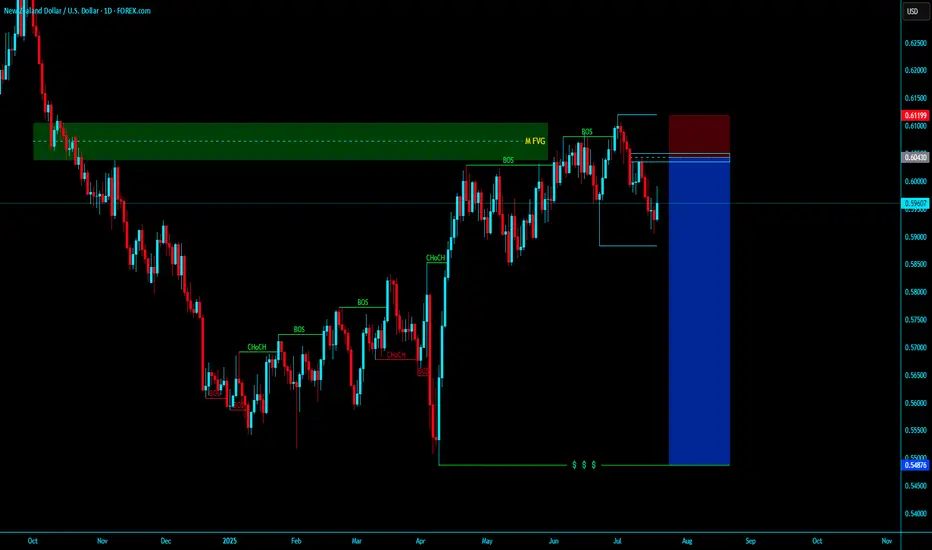
Market IN monthly SIBI in Daily TF MSS , in Daily SIBI Going to LTF after Valid MSS with Run on Stop either Engage dose not Matter . entry with Tight SL and LONG Target Open
USDNZD trade ideas
NZDUSD Bullish Pressure coming innOANDA:NZDUSD have finally closed above 0.59485 which is weekly support and NZDUSD is respecting it nicely, now with bullish pressure came it: it will touch 0.60060 as its the most important level at the moment, if price closed above 0.60060 making it good support then next level is 0.60345 if price kept bullish.
Key levels to look are:
0.60060
0.60345
and finally 0.60633 as weekly high.
0.60633 as Strong Resistance.
This is good trade, don't overload your risk like greedy, be disciplined trader.
I manage trade on daily basis.
Use proper risk management
Looks like good trade.
Lets monitor.
Use proper risk management.
Disclaimer: only idea, not advice

NZD/USD is on the verge of a dropBased on the fractal structure and the highs and lows in the market, a trend reversal on NZD/USD is confirmed — a drop is coming.
Exit at the marked target, or secure the majority of your profits.

NZD/USD Technical Analysis | Smart Money Perspective🧠 NZD/USD Technical Analysis | Smart Money Perspective
On the current NZD/USD chart, price is trading around 0.5960, positioned between a clearly defined resistance zone (0.6130–0.6150) and a support zone (0.5890–0.5900).
We can observe the following key technical elements:
🔹 1. Liquidity Sweep
Price recently broke below the previous swing low near 0.5900, tapping into a pool of sell-side liquidity. This movement is commonly interpreted as a liquidity grab, where institutions manipulate price to trigger retail stop losses before reversing.
🔹 2. Double Bottom Formation
The chart indicates a potential double bottom forming at the support level — a classic accumulation signal. This pattern suggests buyers may be stepping in after liquidity has been taken out, anticipating a reversal.
🔹 3. Fair Value Gap (FVG)
An FVG (imbalance) is visible in the range of 0.5985 to 0.6015. This inefficiency was created by a sharp bearish move, leaving price action unbalanced. Price is now expected to retrace into this area to rebalance orders — a common smart money behavior.
🔹 4. Market Structure Outlook
If the double bottom confirms with a bullish break of structure above 0.5980, we could expect a continuation toward:
First Target: FVG zone around 0.6015
Second Target: Major resistance near 0.6150, where past distribution occurred.
✅ Conclusion
This setup combines key smart money concepts:
Liquidity grab below support
Accumulation phase at demand
FVG as target
Potential bullish market structure shift
Traders should monitor price action around the support zone for confirmation (e.g., bullish engulfing or break of short-term highs) before entering long positions. Targets remain at the FVG and resistance zones, but risk management is essential in case of a deeper sweep or macroeconomic catalyst.

Buy NUWhile price rejected up and down value area, price currently in a trendline formation. Now price formed a pin rejecting the lower trendline. Combining the value area low with rejection, I anticipate a buy, with SL in swing low, targeting value area high.
NZD-USD Will Go Down! Sell!
Hello,Traders!
NZD-USD already made a retest
Of the horizontal resistance
Of 0.5992 from where we
Are seeing a bearish reaction
And we will be expecting a
Further bearish move down
Sell!
Comment and subscribe to help us grow!
Check out other forecasts below too!
Disclosure: I am part of Trade Nation's Influencer program and receive a monthly fee for using their TradingView charts in my analysis.

Sell NZDUSD based on N patternNZD/USD has entered a bearish phase.
A sell opportunity will come after a break and retest of the 50% level.

NZD/USD: Market Structure Shifts in Favor of BullsFenzoFx—NZD/USD broke above the 0.597 immediate resistance, signaling a market structure shift. We expect the uptick in momentum to resume toward the middle line of the bullish channel.
However, for a low-risk entry, waiting for the price to near the FVG at 0.595 is recommended.

Short Trade - LL LH - Down Trend - Divergence Chart Is showing
- Short Trade
- LL LH
- Down Trend
- Divergence

NZD_USD POTENTIAL SHORT|
✅NZD_USD is going up to retest
A horizontal resistance of 0.5990
Which makes me locally bearish biased
And I think that we will see a pullback
And a move down from the level
Towards the target below at 0.5947
SHORT🔥
✅Like and subscribe to never miss a new idea!✅
Disclosure: I am part of Trade Nation's Influencer program and receive a monthly fee for using their TradingView charts in my analysis.

Nzdusd sell to buy narrativeNzdusd has been responding positively after CPi data and we can see price reacting to close imbalance caused by Trump-powell power tussle.
We expect more bullish move in the future.

NZDUSD Will Move Lower! Sell!
Here is our detailed technical review for NZDUSD.
Time Frame: 2h
Current Trend: Bearish
Sentiment: Overbought (based on 7-period RSI)
Forecast: Bearish
The market is trading around a solid horizontal structure 0.594.
The above observations make me that the market will inevitably achieve 0.592 level.
P.S
The term oversold refers to a condition where an asset has traded lower in price and has the potential for a price bounce.
Overbought refers to market scenarios where the instrument is traded considerably higher than its fair value. Overvaluation is caused by market sentiments when there is positive news.
Disclosure: I am part of Trade Nation's Influencer program and receive a monthly fee for using their TradingView charts in my analysis.
Like and subscribe and comment my ideas if you enjoy them!

NZD/USD SELLERS WILL DOMINATE THE MARKET|SHORT
NZD/USD SIGNAL
Trade Direction: short
Entry Level: 0.607
Target Level: 0.592
Stop Loss: 0.617
RISK PROFILE
Risk level: medium
Suggested risk: 1%
Timeframe: 1D
Disclosure: I am part of Trade Nation's Influencer program and receive a monthly fee for using their TradingView charts in my analysis.
✅LIKE AND COMMENT MY IDEAS✅

NZDUSD is bullishThe price just tapped into a valid order block.
This suggests a potential long (buy) opportunity.
We may see bullish momentum from this zone.
Watch for confirmation like bullish engulfing or BOS.
Place stop loss just below the order block.
Target the next resistance or liquidity zone.
Wait for entry confirmation on lower timeframes.
NZDUSD H4 I Bearish Reversal Based on the H4 chart, the price is approaching our sell entry level at 0.5965, a pullback resistance that aligns with the 61.8% Fib retracement.
Our take profit is set at 0.5923, a pullback support.
The stop loss is set at 0.6004, a swing high resistance.
High Risk Investment Warning
Trading Forex/CFDs on margin carries a high level of risk and may not be suitable for all investors. Leverage can work against you.
Stratos Markets Limited (tradu.com ):
CFDs are complex instruments and come with a high risk of losing money rapidly due to leverage. 66% of retail investor accounts lose money when trading CFDs with this provider. You should consider whether you understand how CFDs work and whether you can afford to take the high risk of losing your money.
Stratos Europe Ltd (tradu.com ):
CFDs are complex instruments and come with a high risk of losing money rapidly due to leverage. 66% of retail investor accounts lose money when trading CFDs with this provider. You should consider whether you understand how CFDs work and whether you can afford to take the high risk of losing your money.
Stratos Global LLC (tradu.com ):
Losses can exceed deposits.
Please be advised that the information presented on TradingView is provided to Tradu (‘Company’, ‘we’) by a third-party provider (‘TFA Global Pte Ltd’). Please be reminded that you are solely responsible for the trading decisions on your account. There is a very high degree of risk involved in trading. Any information and/or content is intended entirely for research, educational and informational purposes only and does not constitute investment or consultation advice or investment strategy. The information is not tailored to the investment needs of any specific person and therefore does not involve a consideration of any of the investment objectives, financial situation or needs of any viewer that may receive it. Kindly also note that past performance is not a reliable indicator of future results. Actual results may differ materially from those anticipated in forward-looking or past performance statements. We assume no liability as to the accuracy or completeness of any of the information and/or content provided herein and the Company cannot be held responsible for any omission, mistake nor for any loss or damage including without limitation to any loss of profit which may arise from reliance on any information supplied by TFA Global Pte Ltd.
The speaker(s) is neither an employee, agent nor representative of Tradu and is therefore acting independently. The opinions given are their own, constitute general market commentary, and do not constitute the opinion or advice of Tradu or any form of personal or investment advice. Tradu neither endorses nor guarantees offerings of third-party speakers, nor is Tradu responsible for the content, veracity or opinions of third-party speakers, presenters or participants.


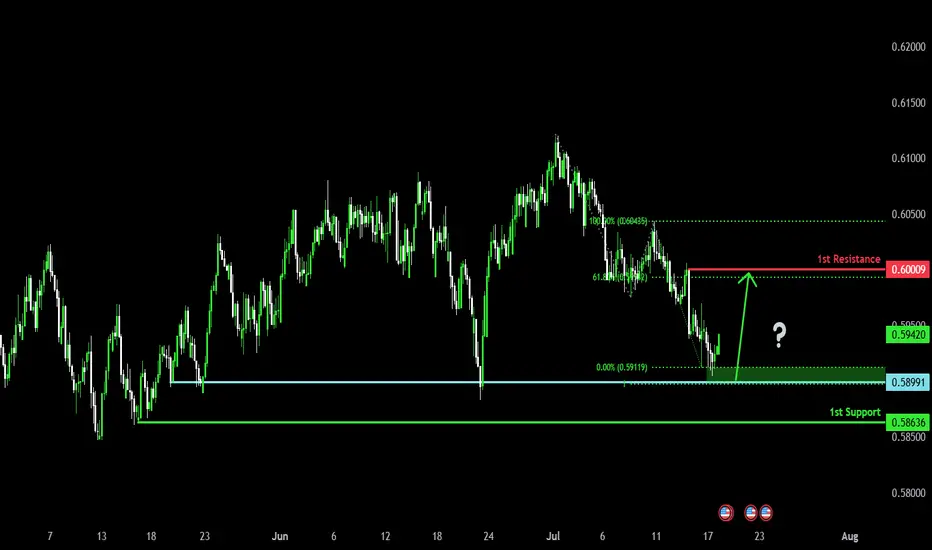
Bullish bounce for the Kiwi?The price has bounced off the pivot which acts as a pullback support and could rise to the 61.8% Fibonacci resistance.
Pivot: 0.5899
1st Support: 0.5863
1st Resistance: 0.6000
Risk Warning:
Trading Forex and CFDs carries a high level of risk to your capital and you should only trade with money you can afford to lose. Trading Forex and CFDs may not be suitable for all investors, so please ensure that you fully understand the risks involved and seek independent advice if necessary.
Disclaimer:
The above opinions given constitute general market commentary, and do not constitute the opinion or advice of IC Markets or any form of personal or investment advice.
Any opinions, news, research, analyses, prices, other information, or links to third-party sites contained on this website are provided on an "as-is" basis, are intended only to be informative, is not an advice nor a recommendation, nor research, or a record of our trading prices, or an offer of, or solicitation for a transaction in any financial instrument and thus should not be treated as such. The information provided does not involve any specific investment objectives, financial situation and needs of any specific person who may receive it. Please be aware, that past performance is not a reliable indicator of future performance and/or results. Past Performance or Forward-looking scenarios based upon the reasonable beliefs of the third-party provider are not a guarantee of future performance. Actual results may differ materially from those anticipated in forward-looking or past performance statements. IC Markets makes no representation or warranty and assumes no liability as to the accuracy or completeness of the information provided, nor any loss arising from any investment based on a recommendation, forecast or any information supplied by any third-party.
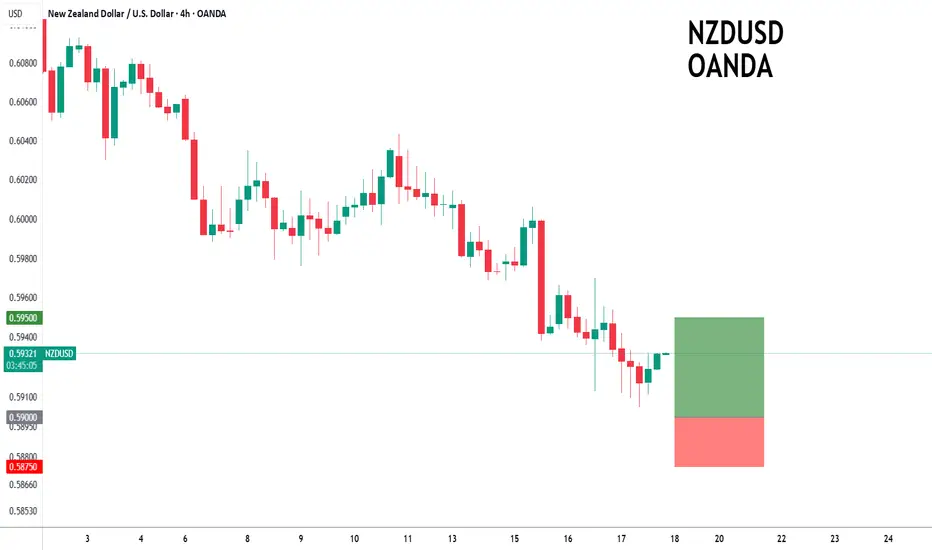
NZDUSD to turnaround?NZDUSD - 24h expiry
The correction lower is assessed as being complete.
We expect a reversal in this move.
Risk/Reward would be poor to call a buy from current levels.
A move through 0.5925 will confirm the bullish momentum.
The measured move target is 0.5975.
We look to Buy at 0.5900 (stop at 0.5875)
Our profit targets will be 0.5950 and 0.5975
Resistance: 0.5925 / 0.5950 / 0.5975
Support: 0.5900 / 0.5875 / 0.5850
Risk Disclaimer
The trade ideas beyond this page are for informational purposes only and do not constitute investment advice or a solicitation to trade. This information is provided by Signal Centre, a third-party unaffiliated with OANDA, and is intended for general circulation only. OANDA does not guarantee the accuracy of this information and assumes no responsibilities for the information provided by the third party. The information does not take into account the specific investment objectives, financial situation, or particular needs of any particular person. You should take into account your specific investment objectives, financial situation, and particular needs before making a commitment to trade, including seeking advice from an independent financial adviser regarding the suitability of the investment, under a separate engagement, as you deem fit.
You accept that you assume all risks in independently viewing the contents and selecting a chosen strategy.
Where the research is distributed in Singapore to a person who is not an Accredited Investor, Expert Investor or an Institutional Investor, Oanda Asia Pacific Pte Ltd (“OAP“) accepts legal responsibility for the contents of the report to such persons only to the extent required by law. Singapore customers should contact OAP at 6579 8289 for matters arising from, or in connection with, the information/research distributed.
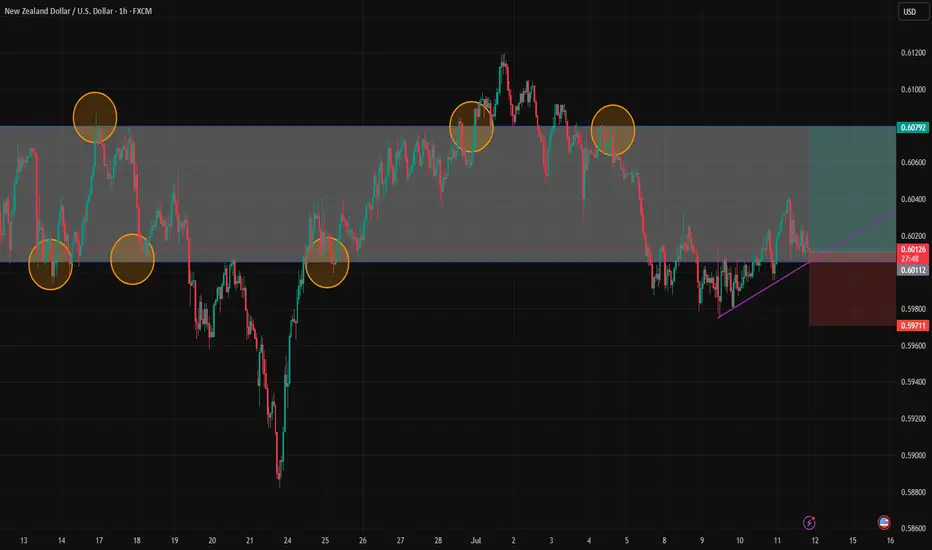
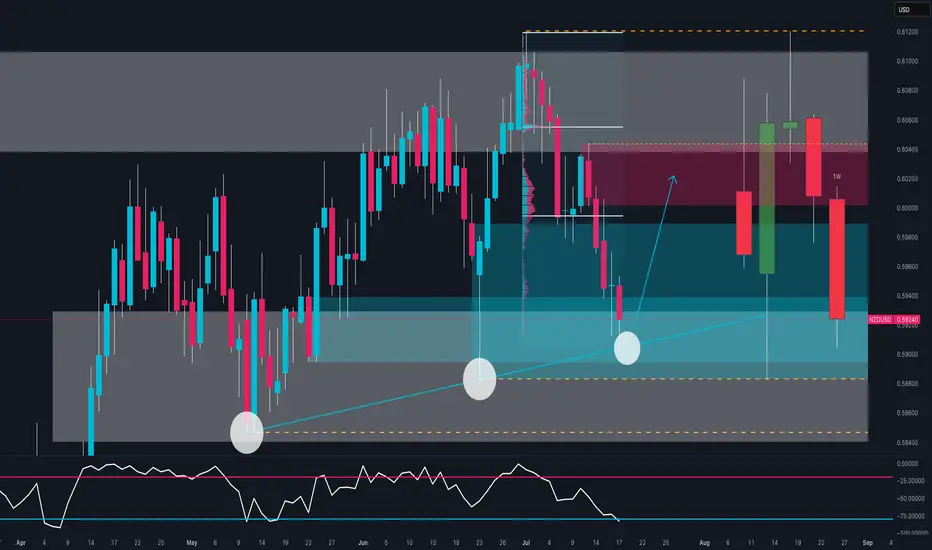
NZD/USD Ready to Explode? The Smart Money Is Making a MoveBias: Bullish Bounce from Key Demand Zone
NZD/USD is testing a strong confluence zone:
Long-term ascending trendline support
Weekly demand area between 0.5890 and 0.5940
Bullish RSI divergence near oversold conditions
The triple rejection wicks signal strong demand around 0.5900, suggesting a possible reversal toward the 0.6020–0.6050 resistance area.
🧠 COT Insight:
NZD: Non-commercial traders added +669 long contracts and reduced shorts by -102 → net bullish shift
USD: Net short exposure increases; total non-commercial shorts now exceed longs by ~4000 contracts
Implication: institutions are rotating into NZD while trimming USD exposure
📊 Sentiment:
86% of retail traders are long NZD/USD → retail sentiment is heavily skewed
This could delay or limit upside as smart money often moves counter to retail positions
📅 Seasonality (July):
July has historically been a bullish month for NZD/USD across all reference windows (20Y, 15Y, 10Y, 5Y, 2Y)
Average July return consistently positive → adds conviction to bullish thesis
🗺 Outlook:
If the zone at 0.5880–0.5920 holds, price may bounce toward 0.6020–0.6050.
Break below would invalidate structure and expose 0.5850 and then 0.5780.
NZDUSDThis currency pair is in the ACCUMULTION structure on the weekly time frame, is ending its trend on the daily, and will complete the cycle by hitting another low and start a new trend. FX:NZDUSD

NZDUSD Excellent buy opportunity on the Channel Up bottom.Last time we looked at the NDUSD pair (May 27, see chart below), we gave a buy signal that in a few days hit our 0.60900 Target:
This time the price is trading exactly at the bottom of a 3-month Channel Up, with the 1D RSI entering its Support Zone. The true Support might be a little lower on the 1D MA200 (orange trend-line) and as long as it holds, the trend will remain bullish, but this is the first strong buy signal of the chart.
Our Target is 0.61450, which will be a +4.10% rise, exactly the same as both previous Bullish Legs.
-------------------------------------------------------------------------------
** Please LIKE 👍, FOLLOW ✅, SHARE 🙌 and COMMENT ✍ if you enjoy this idea! Also share your ideas and charts in the comments section below! This is best way to keep it relevant, support us, keep the content here free and allow the idea to reach as many people as possible. **
-------------------------------------------------------------------------------
Disclosure: I am part of Trade Nation's Influencer program and receive a monthly fee for using their TradingView charts in my analysis.
💸💸💸💸💸💸
👇 👇 👇 👇 👇 👇

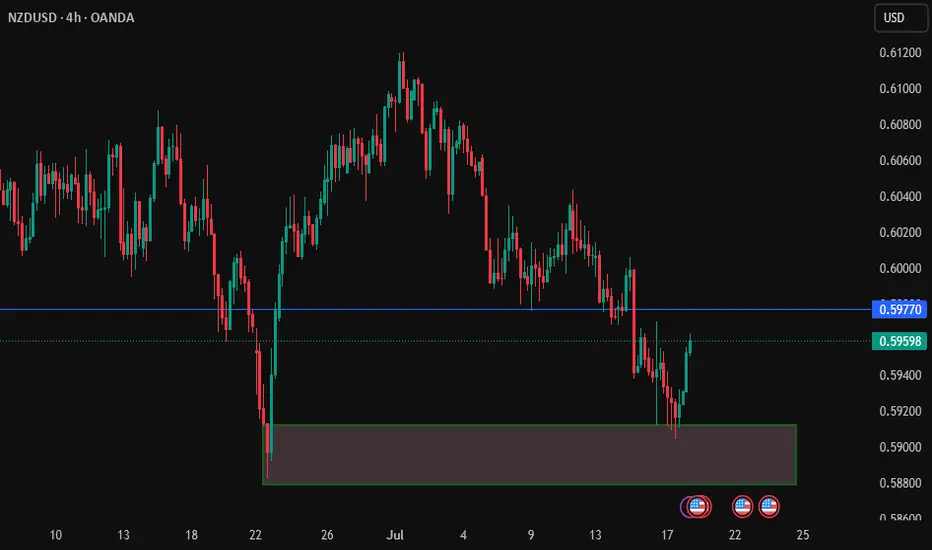
Trading NZDUSD | Judas Swing Strategy 10/07/2025Last week, we saw a textbook Judas Swing play out on OANDA:NZDUSD and this one checked every single box on our trading checklist. Let’s walk through the trade step by step
After a slow Asian session, NYO brought the kind of liquidity grab we look for. Price swept the low of our Judas swing zone, trapping early sellers and triggering stop hunts classic Judas behavior. As always, our first thought wasn’t to jump in it was to observe.
Once we spotted that liquidity sweep, our next confirmation came quickly: a clean break of structure to the upside. That shift in market sentiment was the green light to start prepping our entry. But, as we’ve learned from experience, patience is a trader’s superpower.
Instead of chasing the move, we waited for price to retrace into our Fair Value Gap (FVG) a key element in our Judas Swing checklist. No FVG touch, no trade. This time, price dipped right into our FVG zone. The moment the candle that entered the FVG closed, we executed with confidence.
Risk: 1%
Reward: 2%
Risk/Reward Ratio: 1:2
After executing the trade, there was a minor drawdown nothing major, just about 4 pips. Price never came close to our stop loss. Then came the move we were waiting for. OANDA:NZDUSD moved in our direction, and in an hour and 40 minutes, we hit our full target. A clean +2% gain added to the week’s tally.
This trade is a perfect example of how the Judas Swing strategy thrives especially after false moves into liquidity zones.
It was a clean setup:
- Sweep of liquidity
- Break of structure
- Retrace into FVG
- Controlled risk, solid R:R
If you’re still taking trades without a structured plan, now’s the time to consider building one. Strategies like this don’t just work because of entries they work because of discipline, timing, and consistency. We don’t trade everything. We trade the setups that check every box.

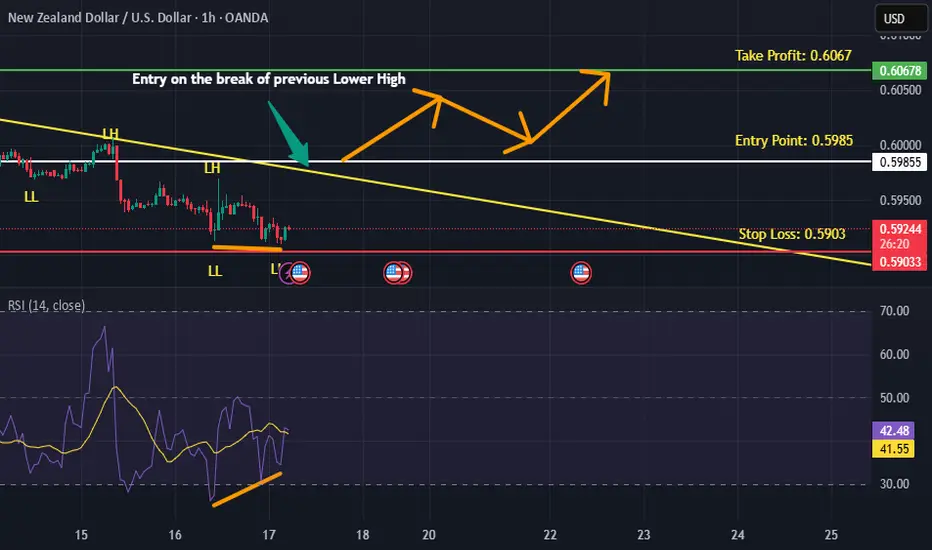
NZDUSD is BullishPrice was in a downtrend, however the double bottom reversal pattern hints on the return of bulls. If previous lower high is broken with good volume then we can expect a bullish reversal as per Dow theory. Targets are mentioned on the chart.