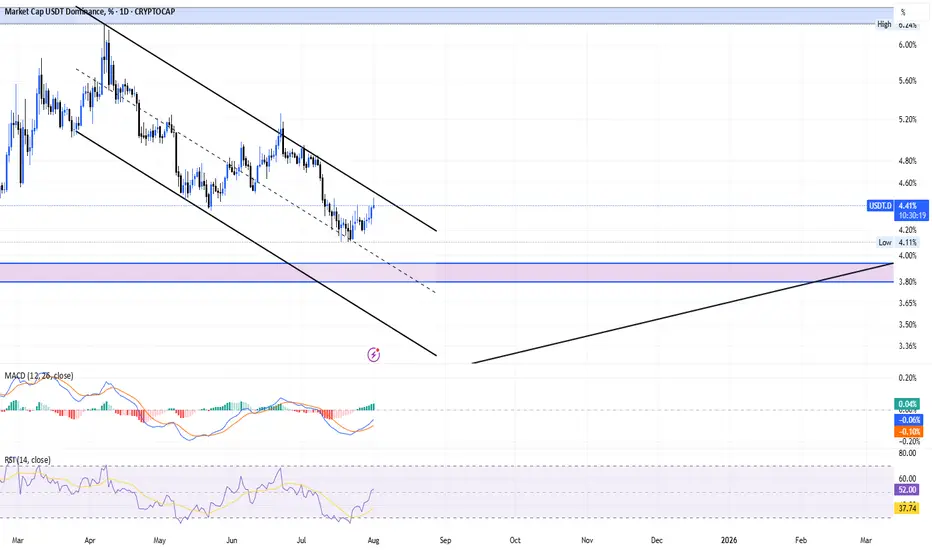
USDT.D Daily | Explosive Surge from 4% –Altcoins Bloodbath Ahead🔹 Overview
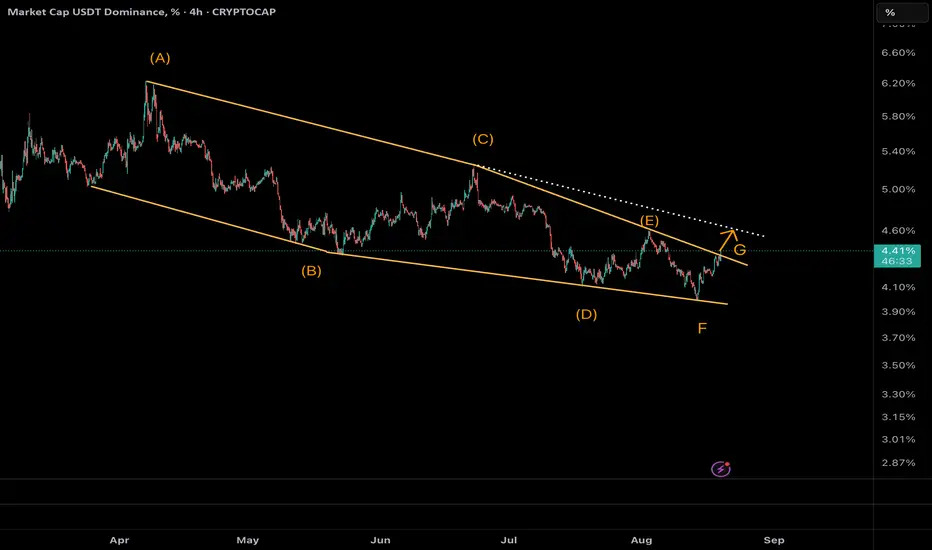
USDT Dominance (USDT.D) has completed a 7-wave Diametric correction inside the descending yellow channel. Now, Wave G is accelerating with strong momentum.
, dominance is at 4.33%, breaking the channel trendline. This confirms the end of the correction phase and signals the start of a dominance rally.
Our prior forecast from the 4% floor is playing out exactly—capital is flooding into stables as risk-off sentiment crushes Altcoins.
⸻
🔹 Wave Structure (NeoWave)
• Diametric unfolded as A-B-C-D-E-F-G.
• Symmetry holds: large A/C/E/G vs. small B/D/F.
• Trendline break = pattern completion.
Monowave count (~55–70) confirms the structure’s legitimacy.
⸻
🔹 Technical Setup
• Current support: 4.28% (brown line).
• Target 1: 4.6% (Fib 1.618 extension + trendline).
• Target 2: 5% (channel midline).
• RSI bullish divergence + rising volume confirm strength.
⸻
🔹 Market Implications
This breakout means:
⚠️ Altcoin Bloodbath incoming.
USDT dominance rally = liquidity moving away from alts. BTC/ETH may stabilize, but alts risk heavy drawdowns.
⸻
🔹 Trade Idea (Bullish USDT.D)
• Entry: Long USDT.D (or short alts) above 4.33% on BOS confirmation (daily).
• Targets: TP1 = 4.6%, TP2 = 5%.
• Stop Loss: Below 4.28%.
• Risk: 1–2% per trade. Trail stops if midline breaks.
⸻
🔥 Get ready for a stablecoin takeover & brutal altcoin flush.
Market insights
Tether Dominance: Wave B Bounce Before the Next Drop?This 1H chart of USDT Dominance shows the completion of a clear 5-wave impulsive advance, followed by a corrective decline that we can label as Wave A.
Now, signs suggest that Wave A is completed, and the market is preparing for a Wave B bounce.
🔹 Key observations:
• Wave A corrective structure has likely bottomed.
• Wave B is expected to retrace upward, targeting the descending trendline resistance.
• Once Wave B is complete, a Wave C decline is anticipated, continuing the corrective phase.
⚠️ Invalidation: A decisive breakout above the trendline would negate the corrective count and signal a potential bullish extension.
⸻
📌 Summary
Near-term outlook suggests a relief rally (Wave B) toward resistance, followed by a Wave C correction lower, as long as price respects the descending trendline.


USDT.D Inverted Chart: Targeting 1.0 Fib Level by Mid-2025The inverted USDT.D chart has broken out of the white resistance trend and is currently just below the 0.786 Fib level. I believe we will remain below this level during a dip next week, then continue upward after December 4th. Following that, I expect we will grind up the channel until we reach the 1.0 Fib level at 1.56%, just before the 50% dotted lines intersect with the Fib level (around June–August).

Market Cap USDT Dominance, %Trend Prediction - Market Cap USDT Dominance Forecasting
End of Resistance and Support Lines Falling Wedge Pattern!!!
**** Yousef Sharafi ****
Follow me here for more analysis

USDT.D :Dominance Surge Confirmed–More Altcoin Pain IncommingBuilding on my previous analysis ("USDT.D (2H): Dominance Rebound to Trigger Altcoin Bloodbath?"), where I called the bounce from the channel floor at ~4% spot-on—dominance rallied as predicted, pressuring alts into further dumps—we're now seeing sustained upward momentum. As of August 17, 2025 (09:12 CEST), USDT.D at 4.23% is testing resistance, signaling continued capital flight to stables.
NeoWave Update:
The ABC correction is evolving, with Wave B/X pushing toward the yellow trendline at 4.35%-4.4% (38.2%-50% Fib retrace). Channel support held, and the rebound aligns with time symmetry (~61.8% of prior drop). Monowaves (~50-65) confirm no exhaustion yet.
Altcoin Impact:
Expect dominance to hit 4.4%, accelerating altcoin bleeds (ETH to 3800-4000, 38.2%-50% retrace). Invalidation below 4.18%.

USDT DOMINANCE Analysis (8H)The structure of Tether dominance in higher timeframes is genuinely bearish, but in lower timeframes, it is approaching a key support level.
It is expected that the dominance will have a few reactions to this support before dumping.
During the next dump in Tether dominance, altcoins are expected to pump. Let’s see what happens.
For risk management, please don't forget stop loss and capital management
When we reach the first target, save some profit and then change the stop to entry
Comment if you have any questions
Thank You

USDT.D UPDATEUSDT is in a dominant head-and-shoulders pattern. If 4.25 is broken, 4.37 and 4.53 are possible. This would mean a 5-10% drop.

USDT Dominance at crucial 3.8 percent support level !USDT dominance is hanging around the 4% mark, and history shows it doesn’t spend much time below here. The 3.8% zone has been a strong bounce point—think March 11, 2024, and again late December / late January, both forming a clean double-bottom.
Right now, we could be setting up for the same pattern. If 3.8% holds, a bounce is likely, and we could see dominance climb back toward the 6–6.5% zone before rolling over.
But if it breaks decisively below 3.8%, that would be a first in years and could trigger a larger market shift—possibly a super cycle where BTC runs toward 150–200K.
Historically, late August into September often brings corrections or dumps, so I’m watching closely over the next few weeks.
Bottom line:
3.8% holds → bounce likely.
3.8% breaks → game changes completely.
What’s your take—bounce or break?

USDT.D (Tether Dominance) Chart Study - More Clues RevealedJust a quick update on this study, as boring as it may seem to some...
This continues to reveal clues, and while it's not a leading indicator necessarily -- But it's very interesting that this trendline has held since 2018 and last night when Bitcoin and the Total Market Cap was rallying -- USDT.D was breaking down below the trendline for the 1st time...
I made a comment in a video, that if this breaks below on a closing basis -- We'd see a massive rally in Bitcoin.. BUT that maybe it was a signal that Bitcoin was overbought and would revert.
And that's what happened. Interesting.
So the trendline held.
For those new to this study, this shows the inverse relationship between stabledoins and crypto.
Obviously, money flowing into one comes out of the other.
So when markets rally and bull markets are peaking, USDT.D flows are at their lowest.
When USDT.D (as a surrogate for stablecoins) rallies, money is flowing out of Bitcoin and crypto as a whole, so Total Market Cap and crypto as a whole is selling off.
That's why I'm watching this chart carefully.
And while USDT.D can stay just above this lower rising trendline for weeks, ultimately it breaks to the upside and signals corrective phases, as well as crashes above certain levels.
TLDR: We have limited time to push to new ATH's and hit $150k as we're expecting, before a correction and HOPEFULLY we get one more cycle push to $200k.
The Blue fractal from 2021 would suggest otherwise, so we should keep that in mind.
Let me know what you think in the comments below.
- Brett

Tether Dominance at Double Support – Is the Bull Run in Danger?The market is currently at a critical juncture – any correction from here could signal the end of the strong bullish wave we’ve been riding.
As seen in the Tether Dominance chart, price has reached two key support levels. From this zone, we anticipate a potential strong reversal in the market.
USDT.D - USDT Dominance falling wedge - Break in alt run?Some of the patterns I am watching have hit interim 1. Checking on the USDT.D chart there is a falling wedge, which is at a inflection point. Maybe a small leverage wipe out due soon

What’s Bitcoin’s Target?In this video, I shared a few key signals that, if you spot them, you might want to sell your Bitcoins and get out fast.
The question is: is there something better than Bitcoin that could give you even more profit?
I’ve explained it all in the full video

Higher targets for BTC & AltsUSDT dominance is starting to drop, which usually means investors are moving money out of stablecoins and back into Bitcoin and altcoins. This shift often leads to rising prices across the market. If this trend continues, the first key zone to watch for USDT dominance is between 3.57 and 3.76 — a move toward that range could help fuel further growth in BTC and alts. Mini Altseason is already started and it is on its way to higher targets.

BTC/ USDT DOM.. more downside? This is USDT on the weekly.. as you can see last June and July even before this is a big level of support for USDT DOM.. Wont be surprised for some more down side here for the crypto market. I know its easy to say now after it lost 111k but I just got home and wanted to look deeper into it. Play it level by level obviously.. fib by fib but don't be surprised to see some down side.. Also you're only down if you bough in the last 2 days and that being said don't buy something that ran up to ATH and think its time to buy.. you kinda deserve it.. but lets see what happens. I hope I'm wrong

#USDT Dominance Update! I know you've been waitng for this.USDT dominance (1W) remains in a clear downtrend, making lower highs and lows since topping near 5.80–6.00%, with the descending trendline from April 2025 acting as resistance.
Price is below the 200-week MA (\~4.84%), keeping structure bearish and favouring BTC/alt strength if the drop continues.
Key support is 4.21–4.23%; a weekly close below could trigger a move to 3.79% (historical bounce zone).
Resistance sits at 4.60%, then 4.84% (MA + horizontal), with 5.19% as major bearish invalidation.
Below 4.60% bias stays bearish, below 4.21% bearish momentum likely accelerates (Altseason/BTC ATH narrative).
A clean break below 4.20% is all we need to ignite the altseason we've been waiting for.
Just keep in mind there could be a major flushout before the actual move.
You've to be ready for that.
I'll let you know when I see the signs.
Do hit the like button and follow me if you haven't.
Thank you
#PEACE

A comeback trendI think the downward trend will continue.
As you can see on the chart, if there is no news, the trend continues in a channel.
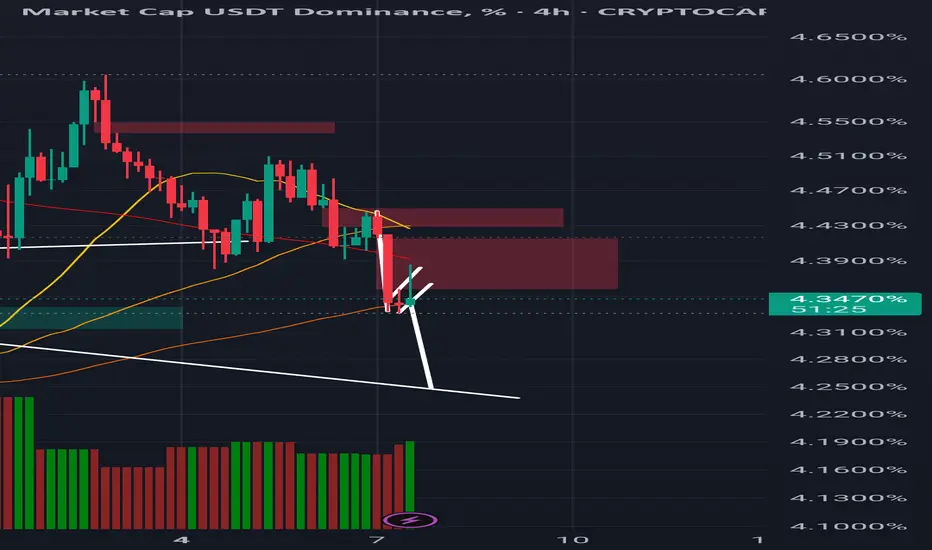
USDT DOMINANCE New Update (4H)First of all you should know that "USDT Dominance" is always moving inverse of BTCUSDT .
Important zones have been lost; it is expected that when the price returns to the identified supply area, it will be rejected downward again.
For risk management, please don't forget stop loss and capital management
Comment if you have any questions
Thank You

USDT Dominance – Precision Repeats: Final Wave F or Wave G Awake🔸 Market Structure:
Following the previous analysis, which precisely reached both projected targets, Tether Dominance continues unfolding its Diametric formation. After completing Wave E, price action has decisively shifted into Wave F, progressing toward the final stages of this structure.
⸻
🔸 Key Observations:
• The prior scenario anticipated a corrective decline, and price perfectly respected both the 4.40% and 4.28% targets before stabilizing.
• Currently, price is testing the ascending trendline and mid-range of the Diametric.
• Momentum remains corrective but has yet to show clear exhaustion.
⸻
🔹 Scenario 1 (Sc1) – Shallow Wave F Completion (~4.22%):
• Support around the minor ascending trendline.
• May trigger an early bounce if buyers step in.
• Less balanced geometrically for a clean Diametric conclusion.
🔹 Scenario 2 (Sc2) – Extended Wave F Completion (~4.12%):
• Aligns with the lower boundary of the Diametric.
• Provides better proportion and symmetry to finalize Wave F.
• Coincides with prior demand zone and the last reaction pivot.
• Statistically, this remains the higher probability path.
⸻
🎯 Expected Path:
Wave F is approaching maturity, and a deeper test near 4.12% remains likely before any sustainable reversal. Upon confirmation, this could trigger the start of Wave G upward, historically associated with altcoin weakness.
⸻
📌 Summary:
After executing the prior analysis with precision, USDT Dominance has advanced into the final legs of Wave F within the Diametric. Monitoring price behavior near 4.12% will be critical. A bounce here could catalyze Wave G and renewed pressure on altcoins. Should short-term support at 4.22% fail convincingly, deeper retracement becomes even more probable.
⸻
✅ Action Plan:
Closely track the reaction zones at 4.22% and 4.12%. A strong reversal signal (e.g., bullish divergence) could confirm the transition to Wave G.
USDT DOMINANCE New Update (4H)First of all you should know that "USDT Dominance" is always moving inverse of BTCUSDT
We have a key level on the chart that This key level has been lost, and there hasn't been a pullback to it yet. It seems that the candles intend to make a pullback to this level. Upon this pullback, we expect a rejection to the downside.
Let's see what happens.
For risk management, please don't forget stop loss and capital management
Comment if you have any questions
Thank You

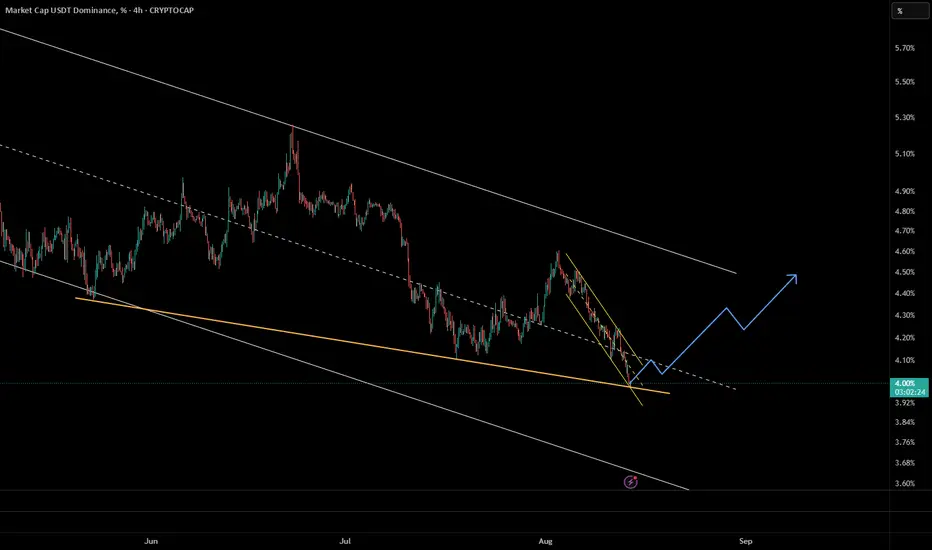
Usdt dom next leg down loadingWe are a nice bear flag forming on the usdt dom chart.meaning we should get the next leg down soon. I'm looking for Bitcoin to let alts catch up during this move and for Bitcoin to retest 119k. Bitcoin Dom should drop to 58%.
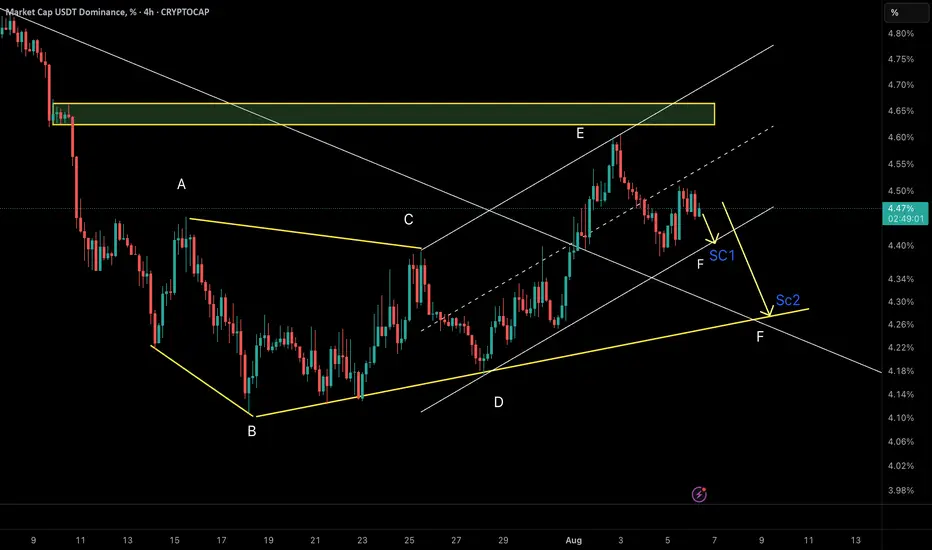
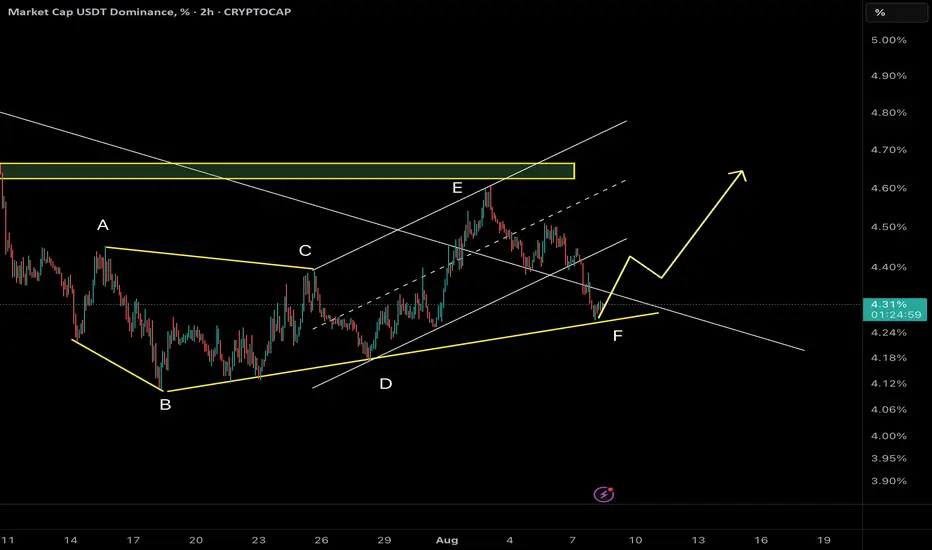
USDT Dominance – Diagonal Ending? | Wave F in Progress🔸 Market Structure:
Tether dominance is currently unfolding in a contracting diagonal (Diametric) formation, and we are now in wave F of the structure. Diagonals typically alternate in direction and converge toward a terminal point.
⸻
🔸 Key Observations:
• Price has rejected from the top of wave E
• Wave F is now unfolding as a corrective move down
• Two potential targets are identified for wave F completion
⸻
🔹 Scenario 1 (Sc1): 4.40%
• Short-term ascending trendline support
• Possibility of a shallow correction before another bounce
• Less ideal in terms of geometric balance of the diametric
🔹 Scenario 2 (Sc2): 4.28%
• Aligns with the lower boundary of the diametric pattern
• Converges near previous demand/resistance flip zone
• Better symmetry and structure for a completed wave F
• This scenario is currently more probable
⸻
🎯 Expected Path:
Wave F likely targets 4.28% before any significant bounce, aligning with a complete structure.
⸻
📌 Summary:
USDT dominance is likely in the final stages of a Diametric pattern. We’re watching for signs of completion around 4.28%, which aligns better structurally. A bounce from 4.40% is possible, but less favored unless strong bullish evidence appears.