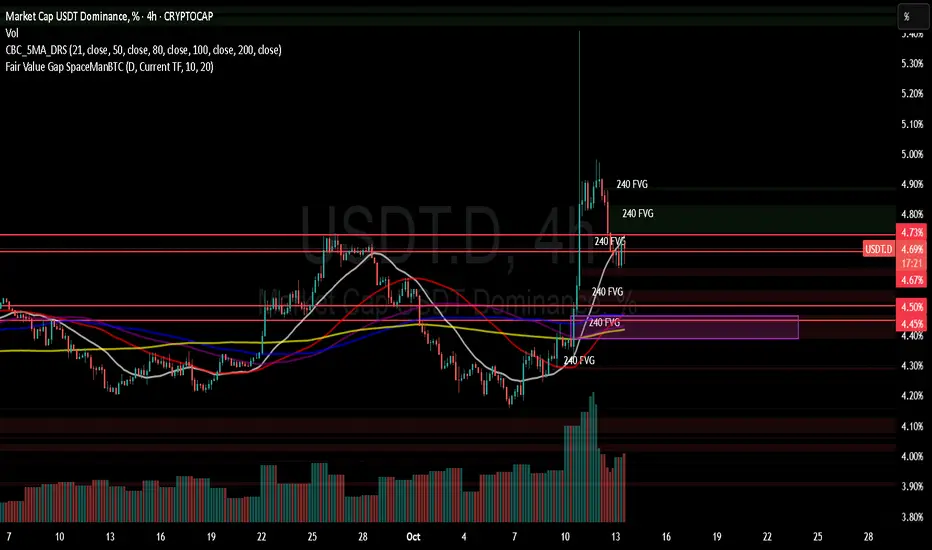
USDT.D (Tether Dominance) – 4H Rejection Confirms Altcoin ReliefThe 4H USDT Dominance chart shows a clear rejection from the 4.73% Fair Value Gap (FVG), marking a potential short-term top. Price is struggling to hold above the 4.67% pivot zone, which aligns perfectly with the Daily FVG and the Weekly rejection block.
📉 Multi-Timeframe Confluence:
4H: Consecutive FVGs stacked between 4.73% – 4.45%, indicating liquidity targets below.
1D: Rejection candle at prior imbalance; momentum now favoring downside continuation.
1W: Long consolidation under the 50/80 EMAs – further confirmation of weakness.
1M: Still below the macro FVG; room for deeper retrace if liquidity continues to drain from USDT.
🔥 Interpretation:
A 4H close below 4.67% could accelerate toward 4.50–4.45%, which historically triggers altcoin rallies.
Conversely, any reclaim of 4.73% would signal renewed risk-off sentiment and short-term pressure on alts.
Summary:
→ Watch 4.67% for confirmation of breakdown.
→ Target liquidity zones: 4.55% / 4.48% / 4.45%.
→ Expect alts to gain dominance if USDT.D continues its descent.
Market insights
#USDT.D 12H ChartUSDT dominance is retested the support at 4.64% where it bounced from. It needs to break below this area to expect further bearish movements towards the 12h demand zone at 4.4%.

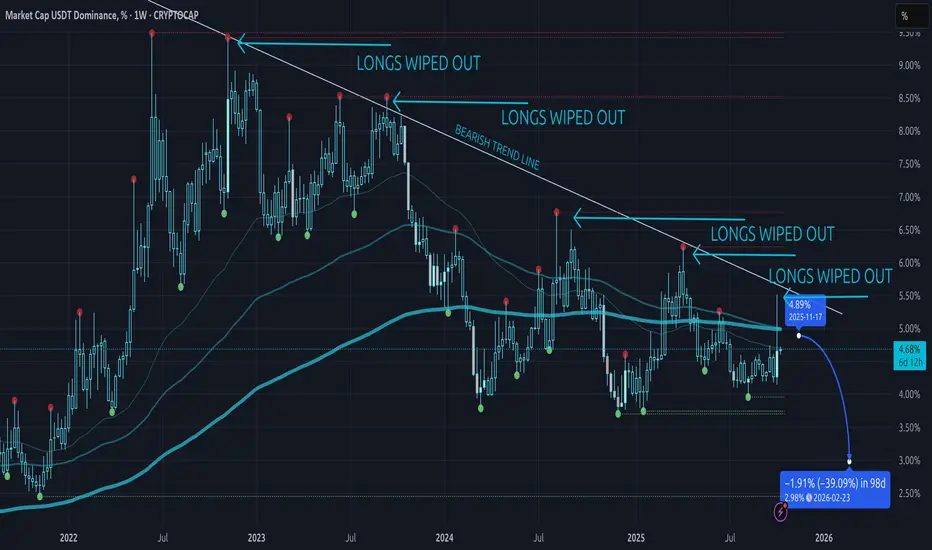
USDT.D Lower High Again — Why I’m Still Bullish on AltsQuick take: the weekly downtrend in USDT dominance is intact. We keep respecting the same descending trendline that starts at the Nov 7, 2022 peak, then tags Sep 11, 2023 → Aug 5, 2024 → Apr 7, 2025 → Oct 6, 2025. Every touch has printed a lower high. Price is still below the weekly 200 EMA (see the thick cyan line on the chart), which keeps the high-timeframe bias pointed down for USDT.D—and by extension, up for BTC/ETH/altcoins, because USDT.D typically moves inversely to the crypto market.
The part that matters to me is how liquidity spikes on CRYPTOCAP:USDT.D have behaved. On Aug 5, 2024, we swept the prior highs and then bled lower for roughly ~168 days, about ~45% down from that spike. On Apr 7, 2025, same story: a sharp markup and then a ~36% markdown after the sweep. Today we’ve done it again—another wick into the trendline, another lower high, and we’re still trading under the 200-week EMA. That combo has consistently led to multi-week declines in dominance.
Short term, after last Friday’s deleveraging and thin books, I’m not pretending to know every intraday zigzag. But on daily/weekly, the picture hasn’t changed: we cleaned the prior highs, failed at the trendline, and are sitting around the mid-4% zone with momentum fading under the EMAs. My base case is chop under the line and then a push lower toward the ~3% area (marked on the chart). If that plays out, it’s exactly the sort of backdrop that’s fueled alt rallies in the past as stablecoins rotate into risk.
What would make me reconsider? A meaningful refill of the wick and acceptance back toward ~5.5% with a weekly close above the trendline and the 200 EMA. Until I see that, I’m treating last week as a de-leveraging spike before higher for crypto broadly, not the end of the cycle. I’ll be watching the next 30 days: hold under the line and roll over, and I like the odds we slide toward 3%—which, historically, has lined up with strong legs up in BTC, ETH, and the better alts.
USDT.DUSDT Dominance (4H) Analysis
After a strong upward move, USDT dominance is currently retracing from its recent high. The market shows signs of short-term correction, and I expect price to reach the following potential support levels:
4.71% – minor support, possible reaction zone.
4.60% – key short-term level; if broken, further downside likely.
4.50% – next significant support area.
4.43% – deeper correction target if bearish momentum continues.
If dominance holds above 4.60% and forms a bullish structure, we might see another leg up. Otherwise, continuation toward the lower levels seems likely.

Understanding the Money Flow in the Coin Market
Hello, fellow traders!
Follow me to get the latest information quickly.
Have a great day!
-------------------------------------
(USDT 1D Chart)
(USDC 1D Chart)
I believe that USDT and USDC show a gap up trend when funds flow into the coin market, and a gap down trend when funds flow out.
Therefore, unless the gap turns into a downtrend, the coin market is expected to maintain its upward trend.
-
(USDT.D 1D Chart)
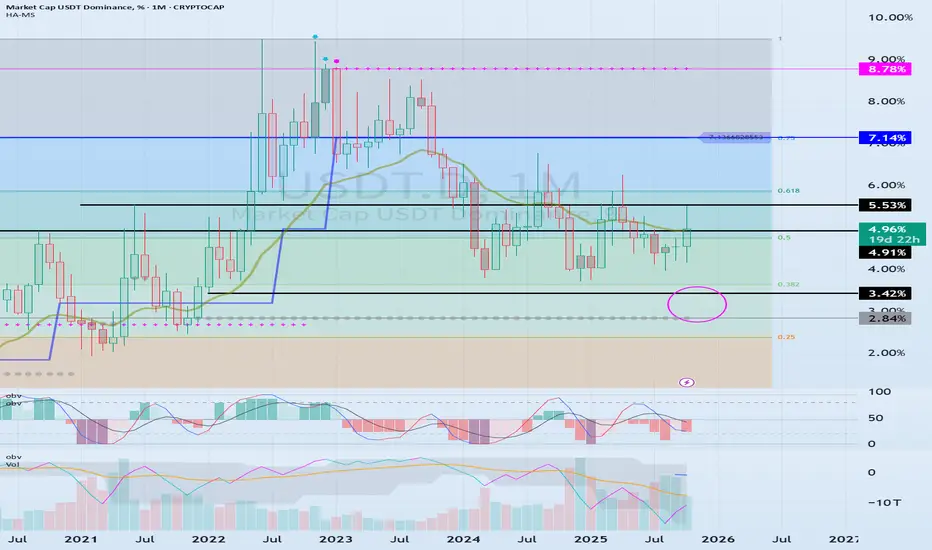
(1M Chart)
As funds flow into and out of the coin market through USDT and USDC, USDT dominance is likely to ultimately rise.
However, I believe that the funds (USDT, USDC) flowing into the coin market will change dominance through trading.
In other words, if USDT dominance declines, the coin market is likely to trend upward.
This is because coins (tokens) are being purchased with USDT.
If USDT dominance remains below 4.91 or declines, the coin market is likely to trend upward.
Therefore, if USDT dominance rises without any evidence of fund outflows through USDT or USDC, it can be interpreted as a temporary increase in selling pressure.
If USDT or USDC gaps downward in this situation, the price will fail to defend, leading to a downward trend in the coin market.
Therefore, it's best to look at the USDT and USDT.D charts to understand the general flow of funds.
-
(BTC.D 1D chart)
(1M chart)
I believe BTC dominance reflects the relationship with altcoins, rather than the rise or fall of the coin market or the rise and fall of BTC itself.
In other words, rising BTC dominance indicates a concentration of funds toward BTC, increasing the likelihood that altcoins will gradually move sideways or experience a downward trend.
Therefore, for an altcoin bull market to begin, it must remain below 55.01-62.47 or show a downward trend.
Therefore, it is recommended to check BTC dominance before trading altcoins and develop a trading strategy.
--------------------------------------------------
Summary of the above:
For the coin market to continue its bull market,
1. USDT and USDC must maintain a gaping upward trend.
2. USDT dominance should decline below 4.91.
3. BTC dominance should decline below 55.01.
-
Thank you for reading.
I wish you successful trading.
--------------------------------------------------
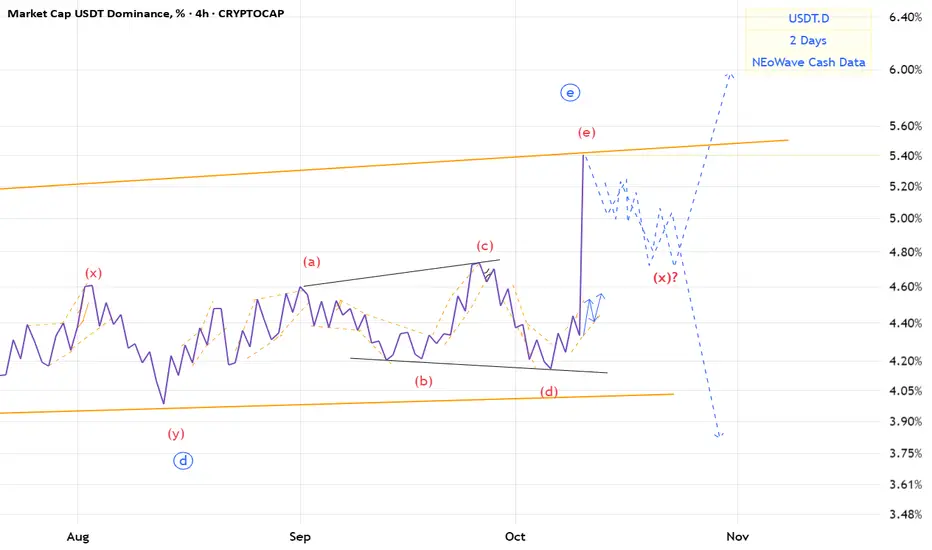
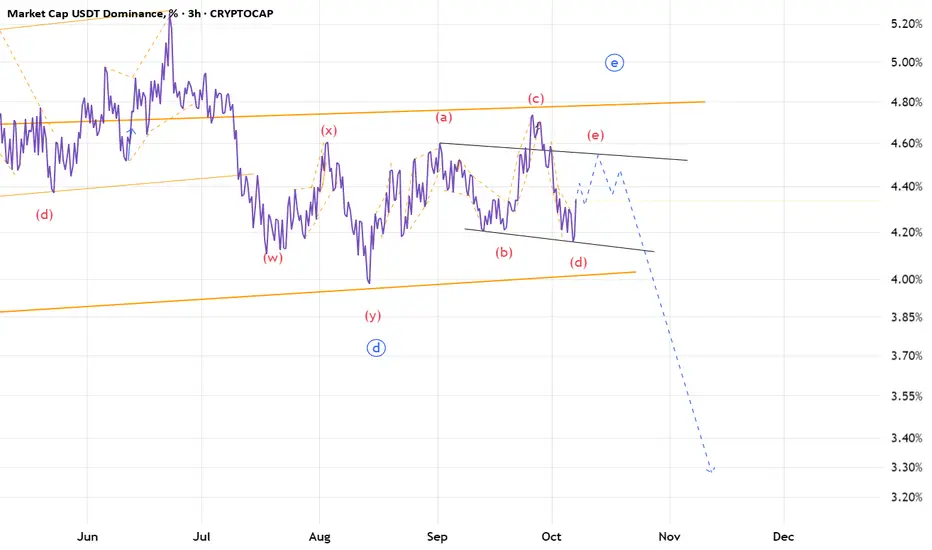
USDT.D(based on NEo wave)The e wave that I wanted made a descending triangle.
we should wait for it becouse it may make an x wave or a post pattern.
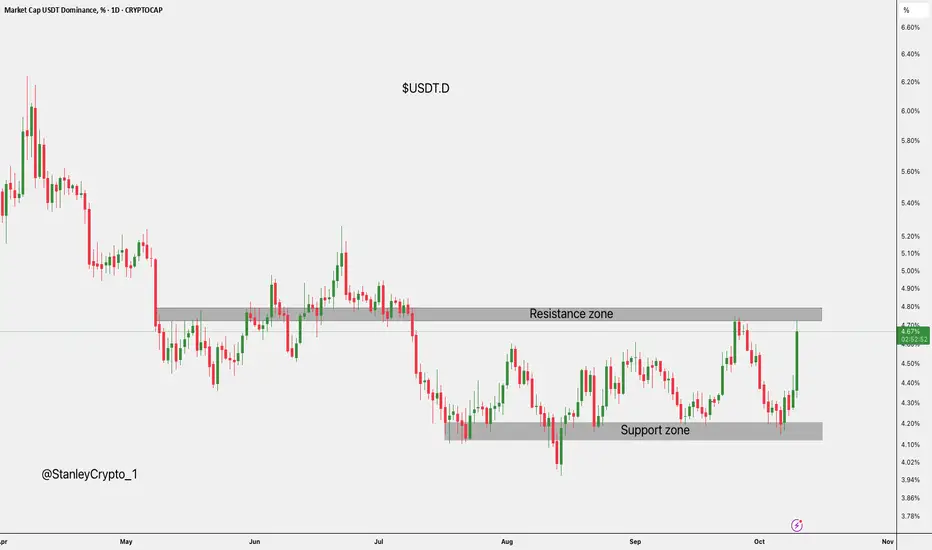
$USDT dominace.CRYPTOCAP:USDT dominance is rising from the 4.1% support zone toward 4.8% resistance, showing strong momentum and potential for further gains if it breaks higher.
DYOR, NFA
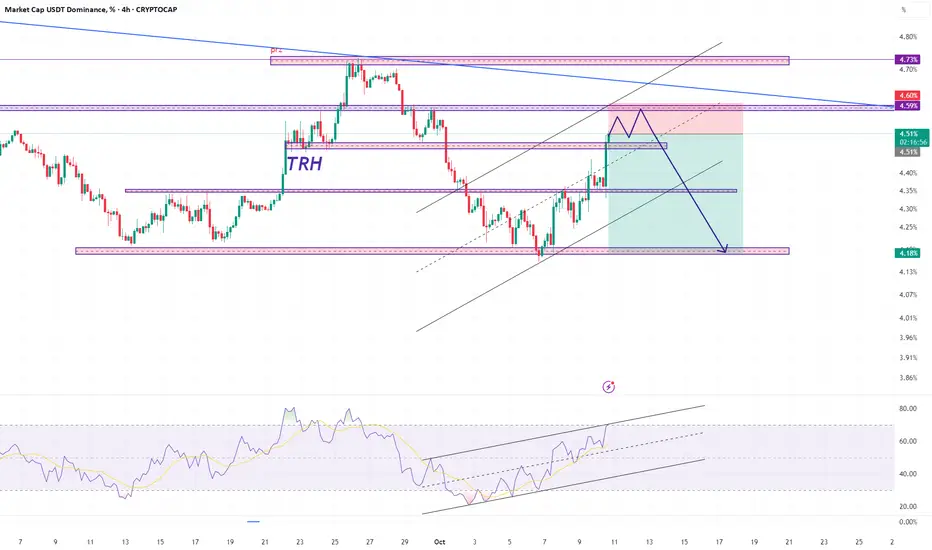
usdt.d 4hHello friends, I am Mehdi.
Given the area, we expect a price correction from this area trh.
Reasons:
We are in the area trh.
There is a possibility of approaching the channel ceiling and then correcting the price.
The resistance at 4.60 is a good place to buy.
I would like to thank you for supporting me by liking and commenting.
And please state your desired currency for analysis.
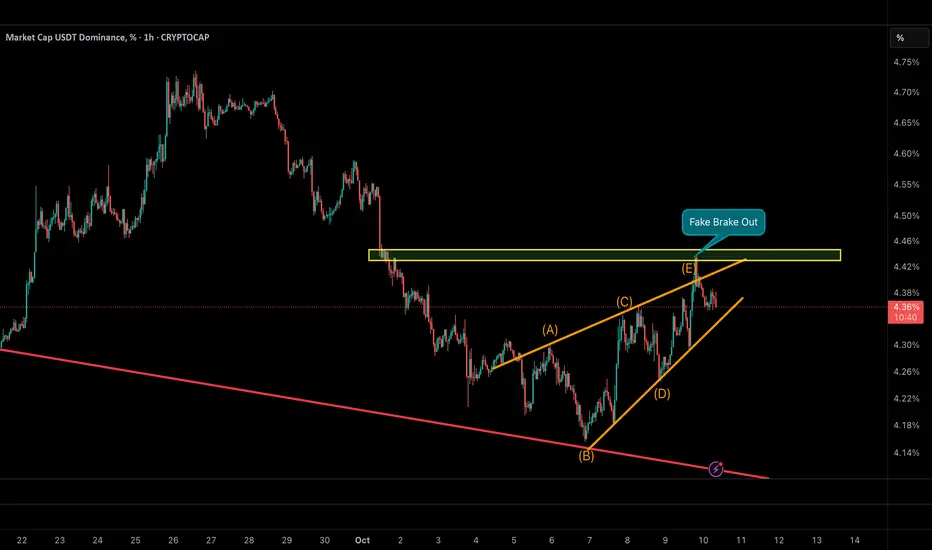
USDT Dominance – Fake Breakout Signals a Potential Altcoin ShiftUSDT Dominance has completed a contracting wedge pattern (A–B–C–D–E), followed by a fake breakout above the key resistance zone near 4.45%.
This move likely trapped late buyers of USDT at liquidity highs.
As long as dominance remains below 4.35%, the probability of a deeper decline toward 4.15–4.20% increases —
which could mark the beginning of capital rotation into altcoins.
In contrast, a confirmed breakout above 4.46% would invalidate this setup and suggest a new sideways phase.
📉 Base Scenario: Continuation of decline toward 4.15–4.20%
🚀 Implication: Growing probability of an upcoming Altseason
USDT KeylevelsAnalysis of USDT D Keylevels for the cryptomarket to find confluences. We marked the keylevels where we expect powerful reversals

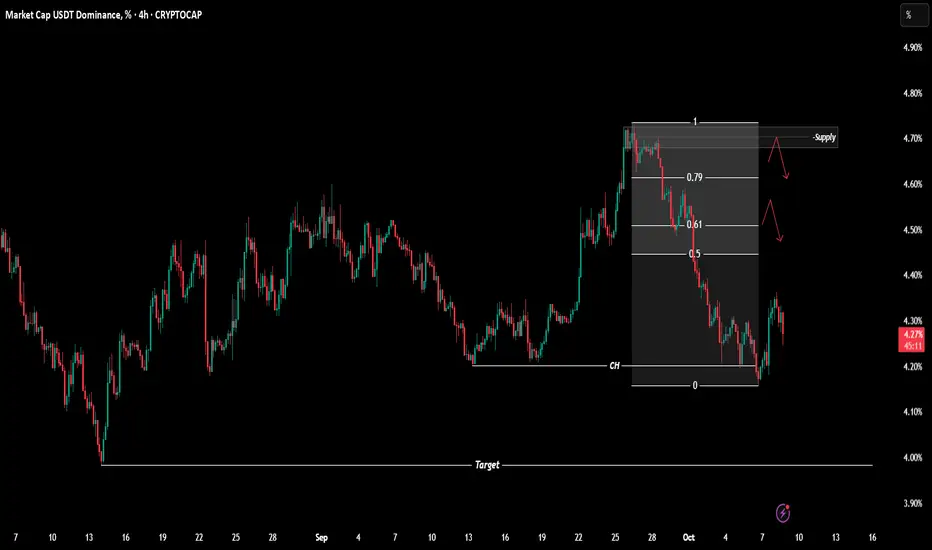
$USDT.D Analysis - Oct 8 | 4H Time FrameCRYPTOCAP:USDT.D Analysis - 4H
Hello and welcome to another analysis from the Satoshi Frame team!
I’m Abolfazl, and today we’re going to analyze Bitcoin on the 4-hour timeframe.
USDT dominance has shown a trend reversal on the 4-hour timeframe and has turned bearish.
The OTE zone and the marked supply area could act as potential rejection zones if dominance makes a short-term pullback upward.
On the other hand, we could also see another drop from the current level, moving toward the lower support area near the recent low.
The main target (4%) is already marked on the chart.
See you in the next analyses!
Stay tuned with the Satoshi Frame team...
USDT.D(based on NEo wave)the bigger degree is a huge triangle and also wave E is a triangle with abcd waves which all are diametrics.
I hope wave e break the curse and change the pattern.
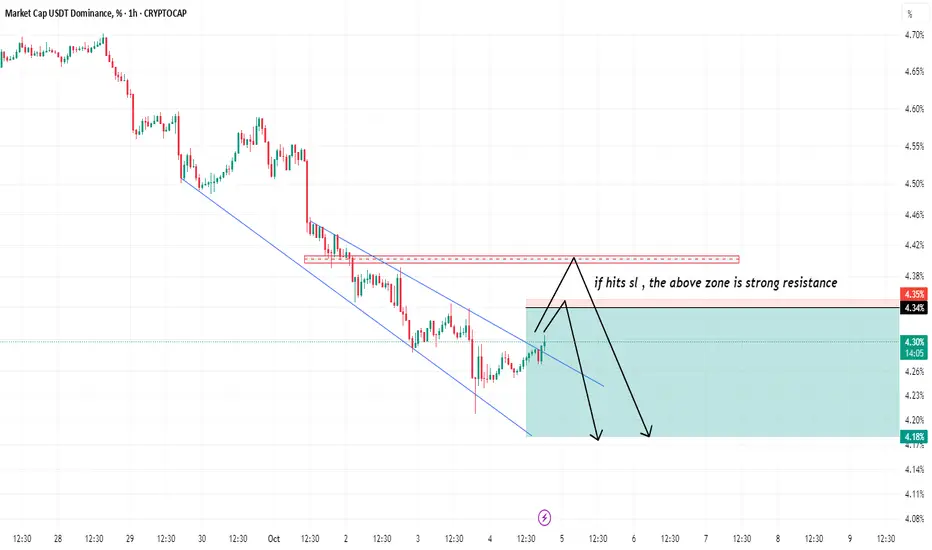
USDT.D 4H Analysis - Key Triggers Ahead☃️ Welcome to the cryptos winter , I hope you’ve started your day well.
⏰ We’re analyzing USDT Dominance on the 4-Hour timeframe .
👀 On the 4-hour timeframe, USDT Dominance has started to recover after its recent drop, bouncing from the support zone at 4.17% and now moving upward, forming a reaction to the previous bearish leg. The structure shows a steep descending trendline, and once broken and confirmed above, dominance could move toward its next resistance zones and enter a correction phase relative to its previous leg. The key resistance levels to watch are 4.33% and 4.38%.
🧮 The RSI oscillator currently faces a static resistance around 45. If volatility pushes above this level and holds, it would confirm bullish momentum and act as a signal for correction continuation.
🕯 The recent candles on Tether Dominance have shown range-bound behavior with weakening bearish pressure, while the 4.17% support has attracted buyers — causing an increase in bullish candles and momentum toward upper resistance zones. A breakout above the descending trendline could confirm a corrective move upward, which seems quite plausible given the current 4H candle structure.
🧠 For profit-taking strategies, you may consider securing partial profits from your open long positions, or moving your stop-losses into profit to protect gains. Meanwhile, start refreshing your watchlist and identifying new price triggers so that you can re-enter positions after reaction or breakout confirmations from upcoming setups.
❤️ Disclaimer : This analysis is purely based on my personal opinion and I only trade if the stated triggers are activated .

EPIC alt-season incoming ?For those unfamiliar with dominance, in a nut shell, a move up denotes a bear run in alts and a decline a bull run
On this monthly dominance chart of USDT I have a trendline which has held since 2017
The red arrows mark all negative Octobers and for what its worth so far we have 2 positives in 2015 and 2019 . All others were negative including current month so far
And at time of writing, the trendline has been breached. Still early in the month to start counting my chicks but looks exciting

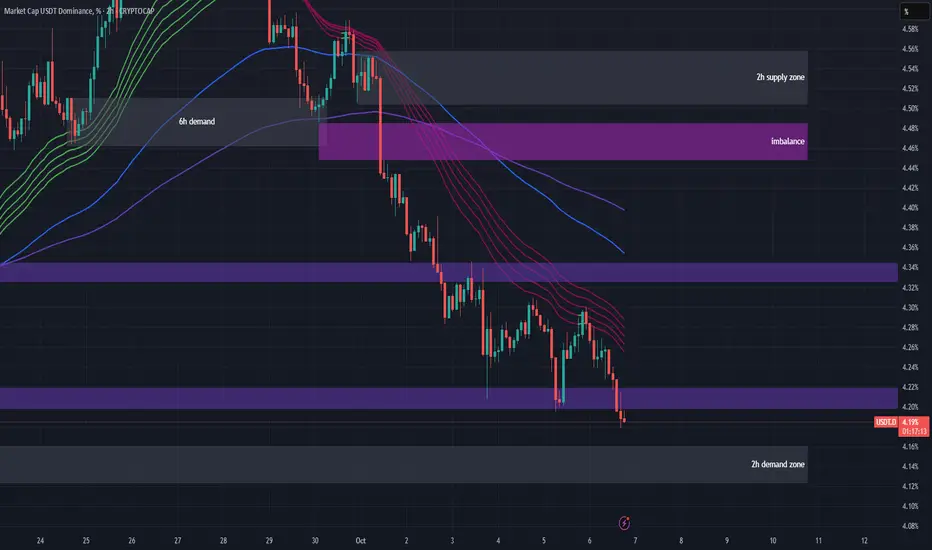
#USDT.D 2H ChartUSDT dominance broke below the support at 4.2% and is still moving downwards. It is expected to tap into the 2h demand at 4.16% before potentially moving up again.
usdt.dHello, I am Mehdi.
According to the previous analysis, the market has continued to the range we are waiting for. In this area, we should wait for the formation of a pattern to continue the path.
Therefore, it is recommended to keep an eye on the market with a 70% profit margin.

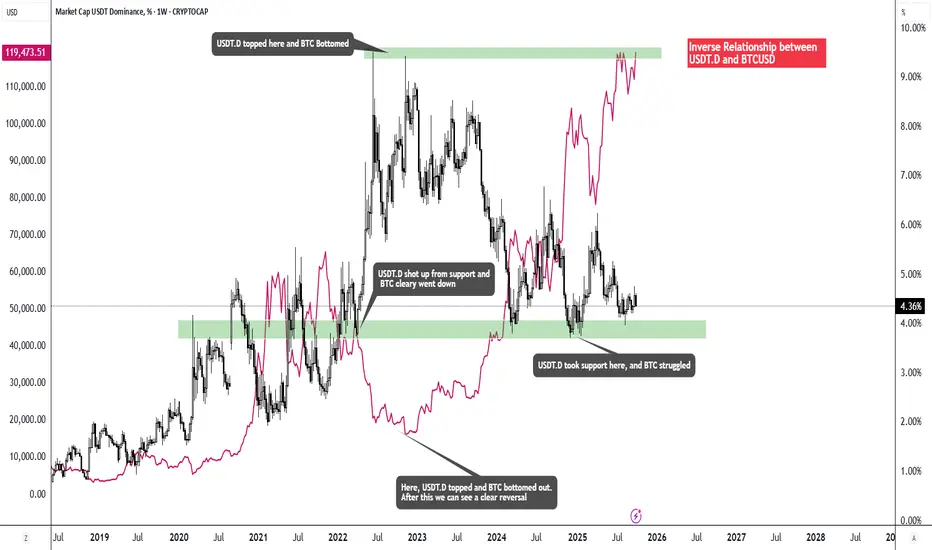
Correlation between USDT.D and BTCUSDInverse Relationship between USDT.D and BTCUSD.
We see here in Weekly chart, how both performed against each other.
USDT.D: Possible Take Profit zone for AltcoinsI see the green box as a safe zone to sell the altcoins.
so between 3.27% and 2.76%.
Setting an alert on 3.27% is advisable so you can pay attention.

#USDT.D 4H ChartUSDT dominance bounced off the 6h demand zone perfectly as we predicted. It is currently expected to keep pushing towards the minor supply zone at 4.66%.

usdt.d 30minHello friends
I am Mehdi, according to the Tether Dominance chart and the full targeting of the previous analysis in the 4-hour timeframe
According to the new analysis, I think the price is expected to reach the range of 4.49
1 Because the 4.57 level was broken with a strong candle in the 4-hour timeframe and now the price is rejecting this level
2 We are at the 382 fibo level
3 RSI divergence
Thank you for supporting me by liking and commenting and sharing this analysis

usdt.d 4hHello friends
I am Mehdi and I wanted to say that if you are currently in profit compared to the position we announced
It is better to have a save profit and move the stop loss to the entry point
I would appreciate it if you support me with likes and comments

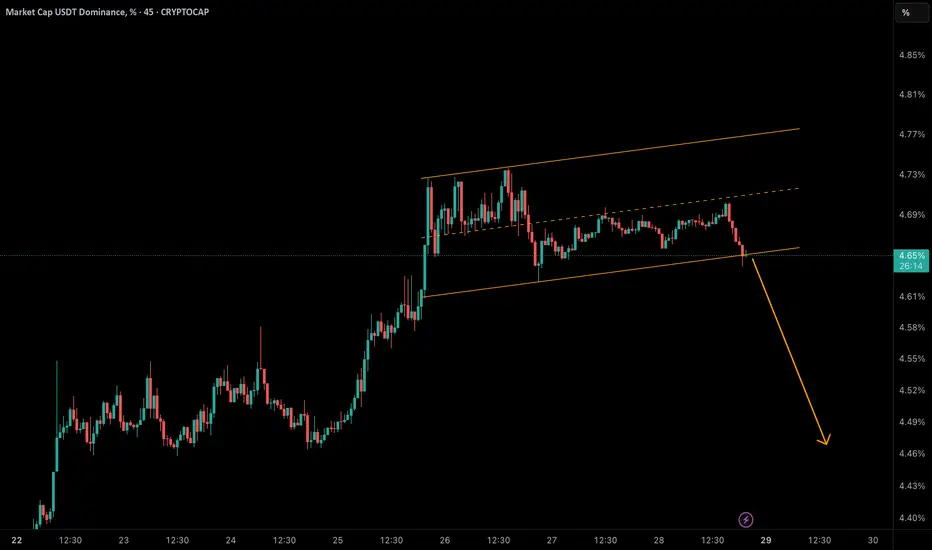
USDT Dominance at a Critical Breakout Point!USDT dominance has touched the bottom of its rising channel near 4.65%.
• 🔻 A breakdown below this support could trigger a correction toward 4.58% → 4.50% → 4.45%.
• 🟢 But if buyers defend this zone and reclaim 4.70%, we may see another push toward 4.75% – 4.77%.
📈 Why it matters: Falling USDT dominance often signals liquidity flowing back into crypto & altcoins, potentially sparking short-term rallies.