Trade ideas

#USDT.D 4H ChartUSDT dominance moved up after testing the 2h demand zone perfectly as predicted. It is currently expected to retest the support/resistance area at 4.37% before potentially continuing its bearish movements.

#USDT Dominance :- Altseason knocking the door?If you realised gains last week, consider booking partial profits while USDT remains above a 283-day support level.
The price structure resembles a head and shoulders formation, a typically bearish signal. A break of that support could trigger significant selling across the altcoin market.
If you need more updates, hit that like button and share your views in the comments section.
Thank you
#PEACE

Waiting for the #USDT.D TriggerMy analysis of the USDT Dominance chart on the 4-hour timeframe indicates a potential for a significant market correction. Historically, as shown in the previous instances highlighted on the chart, a clear divergence has acted as a key trigger for sharp downward movements in the broader market.
I am currently observing the chart, anticipating the formation of a similar divergence pattern. My strategy involves waiting for this specific technical signal to confirm, as it would provide a high-probability entry point for anticipating a major market correction. This approach is rooted in risk management and a disciplined, data-driven trading methodology.


#USDT.D 4H ChartUSDT Dominance is currently bouncing off the 2h demand zone at 4.25%. It is expected to keep pushing upwards and retest the EMAs before potentially continuing its bearish movements.

Critical Moment for Tether Dominance – Will Wave (D) Crash the MThe chart shows that Tether Dominance is moving inside a descending channel. Based on the wave count, it seems that wave (C) has just been completed, and now we may expect a sharp wave (D) rally. Such a move could trigger a fast market downturn, as rising USDT dominance usually pressures crypto assets.
⚠️ The key condition is whether the channel bottom, which also aligns with a major order block, holds.
• If it holds → wave (D) up, strong bearish pressure on crypto.
• If it breaks → continuation of the downtrend in dominance, allowing altcoins to recover.
📊 Summary:
• Wave (C) completed
• Potential strong wave (D) up → bearish for crypto
• Condition: channel bottom must hold

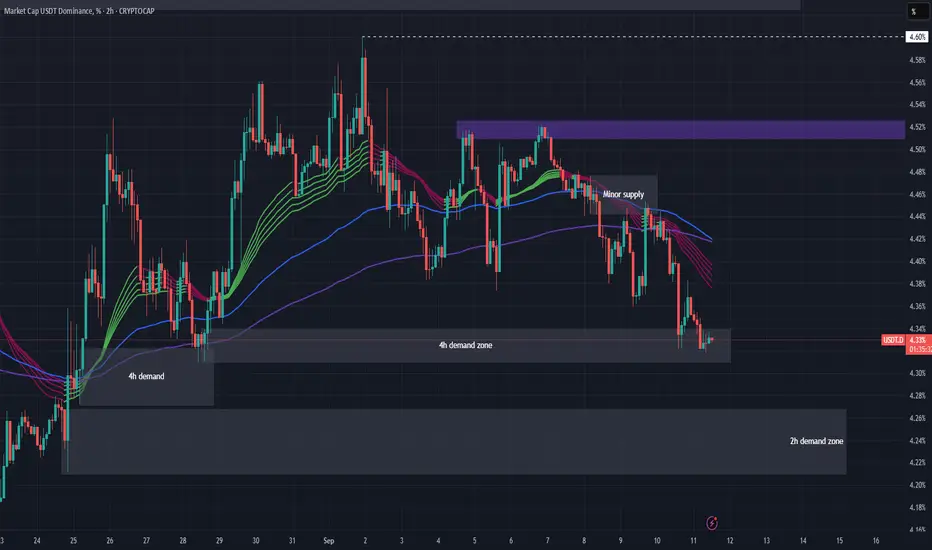
#USDT.D 2H ChartUSDT dominance is currently resting on the 4h demand zone. If this area does not hold, then we would expect further bearish movements towards the nearest 2h demand zone at 4.26%.
USDT.D 3.34% will be the end of crypto bull marketIn my view USDT.D is printing a triangle figure on the long term chart , my target is 3.34% this valure will be the end of crypto bullish cycle

STABLE COINS DOMINANCE BROKE THE SUPPORTAs the stable coins dominance broke the support then in any days rally comes to crypto market like in April's 12 & July's 8th

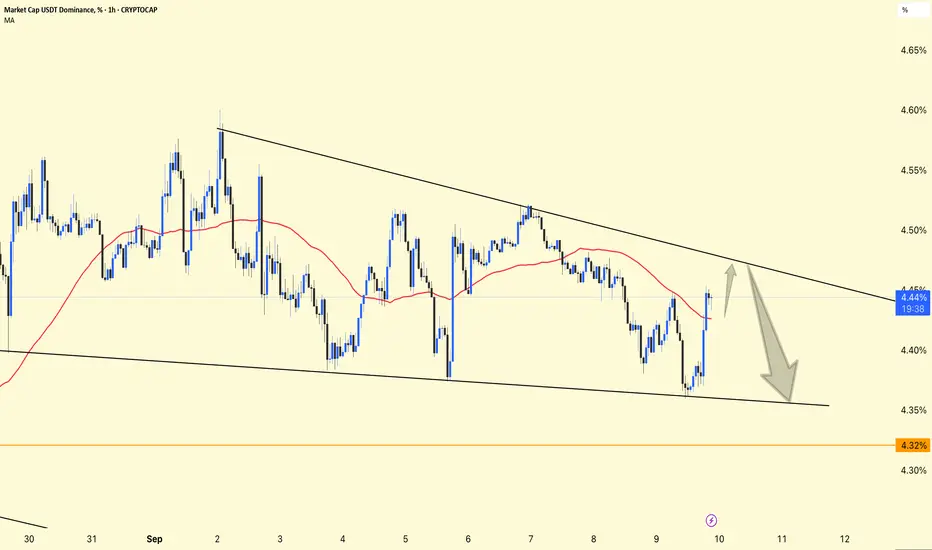
USDT.D 1H Analysis !!USDT.D 1H Analysis
Price is consolidating inside a descending triangle (lower highs + flat bottom).
Currently sitting around 4.44%.
50MA (red) is acting as dynamic resistance, keeping pressure on dominance.
Support Zone
Key support lies near 4.35% (triangle bottom).
A breakdown below this zone could send dominance lower toward 4.32% (orange line).
Resistance
The upper trendline around 4.48%–4.50% is the first big resistance.
Break above → short-term relief rally in dominance.
📈 Outlook
Bullish case: If USDT.D breaks above 4.48%, dominance may rise toward 4.55%–4.60%, usually bearish for crypto prices.
Bearish case: If it rejects and breaks below 4.35%, we can see a move toward 4.32%, which would support bullish momentum in BTC/altcoins.
👉 In simple terms:
Watch 4.48% (resistance) and 4.35% (support).
A breakout = bearish for crypto.
A breakdown = bullish for crypto.
#USDT.D 4H ChartUSDT.D has broken below our previously mentioned breaker zone and it is currently retesting our 4h demand zone. If it breaks below that area as well, then we would expect it to sweep the low at 4.31%.

#USDT.D 2H ChartUSDT Dominance tapped into our 2h demand zone where it is bouncing from as predicted. We may see it trade deeper into that area of demand before potentially moving up again.

#USDT.D 2H ChartUSDT dominance is currently retracing after bouncing off a 4h demand zone and leaving a freshly printed 2h demand at around 4.4%. It is expected to keep retracing and reach this 2h demand as a short-term target.

USDT.D HTF Accumulation pt.2A while ago USDT.D came into the POI of the HTF accumulation i was pointing out in June. Since then it had kind of an accumulation followed by a slow move up, leaving liquidity behind and a distribution just before hitting the technical target. Very unclear price action, but i'm watching these 2 scenarios. In case the HTF accumulation is already complete, this could become brutal, but let's see.

USDT.D — 1W FVG Test & RSI Bull Div | Caution for RiskUSDT Dominance is testing a major 1W FVG support area while developing bullish divergences on the 4H RSI. Although a short-term bounce and market correction are likely, the overall bullish trend in BTC means a sharp reversal is not guaranteed. Risk management is a priority here — no high-risk positions until the RSI resets and market context is clearer.
1W FVG support + 4H RSI bull div
Bounce likely = correction on risk assets
RSI needs reset to 50 before reassessing
If lost — risk-off, possible slice down
Reasoning: Support + momentum, but trend is bullish — not risking gains here


12 hr inverted head and shoulder is 12 hr inverted head and shoulders which starts at the 0.618. as its 12 hrs I feel it will reverse back from here may be next week. let me know your thoughts

$USDT dominance broke out.CRYPTOCAP:USDT dominance just broke out of its months-long downtrend and is holding steady above 4.4% 👀.
This could be an early signal of shifting momentum in the market.
DYOR,NFA

USDT Dominance Update – Market at a Turning PointUSDT Dominance got rejected from the 4.55% – 4.60% resistance zone and is now consolidating right on the dynamic yellow trendline and the white diagonal support.
📊 Key Points:
• This area is a critical decision zone.
• Holding above support could trigger another push toward 4.55–4.60%.
• But a clean breakdown below 4.44% may open the way to 4.35% – 4.30%, which would be very bullish for altcoins.
⚡ Conclusion: USDT dominance is at a major crossroad – the next move will likely define the short-term direction for both Bitcoin and altcoins.

Massive Altcoin Move Coming – Eyes on USDT.DUSDT.D has broken above the resistance line and is now facing resistance at the key S/R zone along with the super trend level.
If USDT.D breaks above this zone, we could see a deeper correction in altcoins. On the flip side, if it gets rejected and starts moving lower, it could trigger a healthy upside move in alts.
The best move right now is to wait for clear market direction instead of chasing random trades. Once the breakout or rejection confirms, I’ll share a detailed trade setup for the next move, whether up or down.

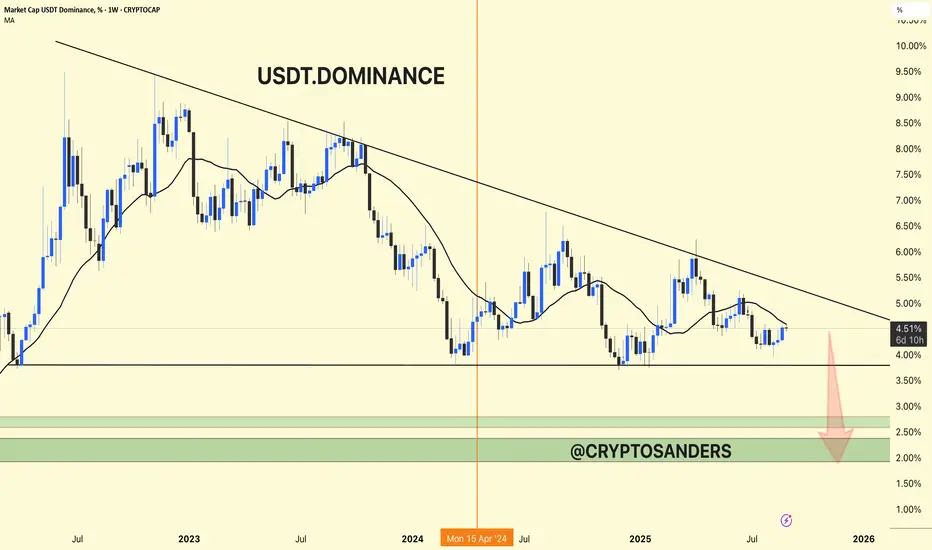
USDT Dominance Weekly Chart Update!!USDT Dominance Weekly Chart Update
USDT dominance continues to decline and is hitting lower highs. This indicates that capital is slowly shifting from stablecoins (USDT) to crypto assets (BTC, ETH, and altcoins).
Support Zone: The main support is between 3.5% - 2.5%. If dominance falls into this zone, it could trigger a strong bullish move in altcoins and BTC.
Perspective: A decline of 2-2.5% would signal the start of a big altcoin season.
⚡ Current Status (4.49%): The market is moving in an uptrend. If dominance continues to decline, expect strong inflows into crypto.
DYOR | NFA
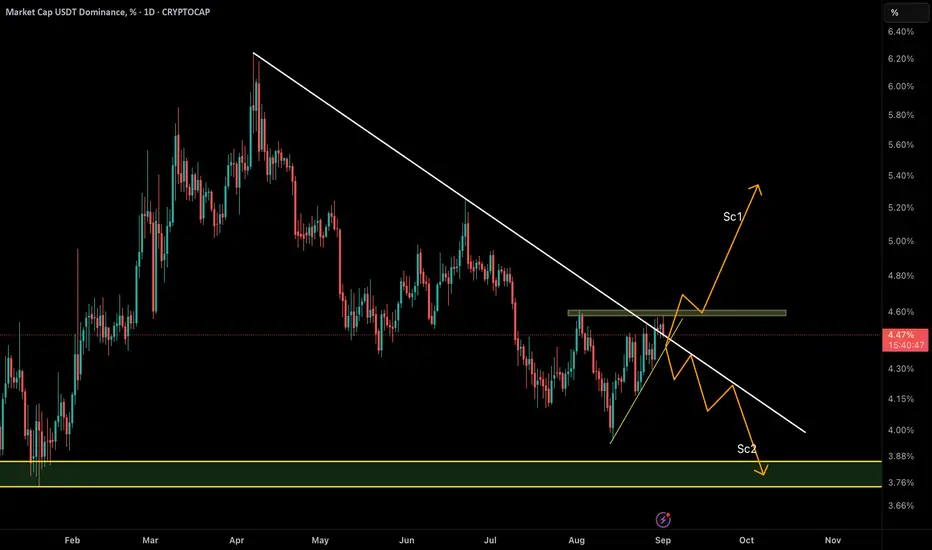
USDT Dominance at a Key Decision Point ,Crash or Fly?USDT Dominance has managed to break above the descending trendline (white line) with volume, but so far it has failed to clear the order block resistance at 4.61% (green zone).
At this stage, price action is stuck between two critical levels, and the next move could define the market’s mid-term direction:
🔸 Scenario 1 (Bullish for USDT.D / Bearish for Crypto):
A clean break and acceptance above the 4.61% order block would confirm demand for stablecoins, signaling capital rotation out of crypto assets. This could trigger a market-wide selloff in Bitcoin and altcoins.
🔸 Scenario 2 (Bearish for USDT.D / Bullish for Crypto):
Failure to hold above the broken trendline and a rejection from 4.61% could drive USDT.D back below the descending line, opening the path toward the 3.8% demand zone. This would suggest capital flowing back into crypto, fueling a potential bullish rally.
⚠️ Market participants should keep a close eye on this area — the reaction around 4.61% will set the tone for the weeks ahead.