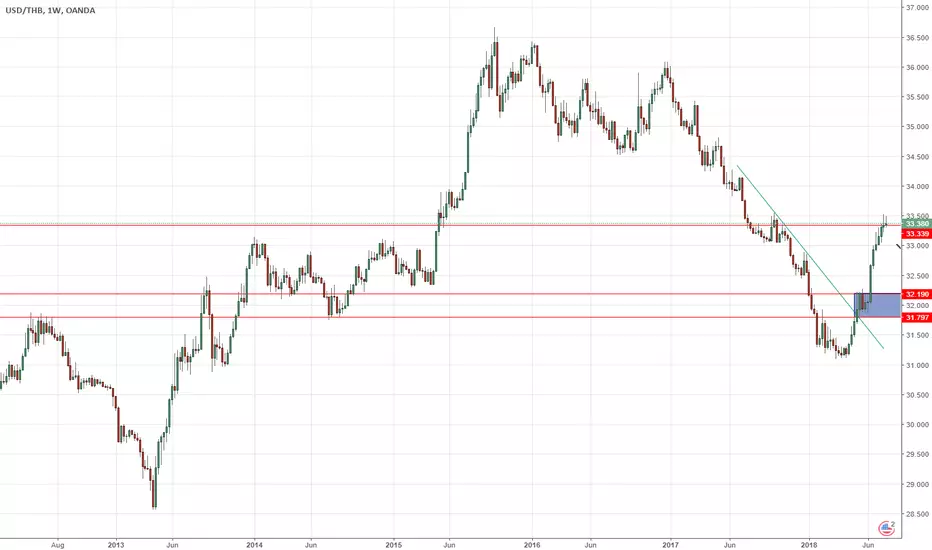
DOWN TREND COMING TO AN ENDWe can see a triangle forming with our trendline and support level, we are going to see our trendline broke and price fly high.
U.S. Dollar / Thai Baht
No trades
Market insights

USD/THB: Swing-Setup! Trendchange chance!Hey tradomaniacs,
welcome to another free signal!
Important: Place a Buy-Stop and wait for the trigger!
-----------------------------
Type: Swingtrade
Buy-Stop: 31,380
Stop-Loss: 31,168
Target 1: 31,632
Target 2: 31,729
Targt 3: 131,872
-----------------------------
LEAVE A LIKE AND A COMMENT - I appreciate every support! =)
Peace and good trades
Irasor
Wanna see more? Don`t forget to follow me.
Any questions? PM me. :-)

Thai baht daily forming cup + handle over a long timescaleIf it keeps getting stronger, this will sting for the tourists this year...

Short USD/THB: Downtrend to ContinueUSD/THB is in a down-down trend, as evidenced by the 3-6-20 MACD signal line and 12-26-9 MACD signal line. It is also trading within a relatively wide channel (two parallel green lines). I have included the 7-day Moving Average as well, because since the middle of December, the MA has served as a reliable resistance level that the pair has yet to meaningfully break through in the new year.
As some background, the pair began a long up trend in April, peaking in July at 33.525. Since then, has been a gradual down trend, with some potential reversals, but not enough to break the down trend. On the way up, the pair found support around 31.858 (horizontal green line), and that is the next major support line that the pair is moving towards. I think that the slight bounce that the pair has had over the last two sessions are within reason of the down-down trend, and I expect it to continue downwards.
Trade: Sell USD/THB @ 32.023
Stop Loss @ 32.106 (previous day's high) - if it breaks above here, then the channel trend is also broken, implying a potential reversal in the down-down trend
Take Profit @ 31.858 (level of significant support back in May and June)
I've also included some previous resistances that the pair hit since it began its down trend in July. Notably, the blue horizontal line is the level of resistance back in early September that the pair failed to break through. You will see that more recently, this level of resistance was tested again in early December, and when that failed to break through, the pair continued downwards. The red horizontal line is another resistance level that was tested at the end of September. The pair initially failed to break through, but regained momentum in October to begin a short bounce upwards. However, at the end of the year, the pair began testing that resistance level again, this time as a support, and when it failed to find support, it broke through downwards, rather dramatically. This leads us to where we are today, in a down-down trend, and within a downwards channel.

USDTHB a falling wedge is almost getting endedThe price action is moving in a falling wedge, now the RSI and stochastic are exhausted and soon it will be bullish insha Allah.
Regarding,
Atif Akbar

THB at the end of triangle consolidationOh, boy, something big is coming soon, for me, I put my bets on Long USDTHB, target 34.85 first than 36. THB is the strongest currency in Asia, if not the world now, but there's just no industries can sustain this level without CB intervention.

USD/THB 1H Chart: Descending triangle in sightThe USD/THB currency pair has been trading in a descending triangle since the end of October.
From a theoretical point of view, a breakout north from the pattern occurs in the nearest future. A potential upside target is the upper boundary of the medium-term descending channel located circa 3.24. Technical indicators for the 1W time frame support bullish scenario.
However, important resistance level to surpass is a combination of the 55-, 100– and 200-hour SMAs in the 32.96 area. If given level holds, it is likely that the pair goes downside to the Fibonacci 38.20% retracement at 32.58.

USDTBH DAILY POSSIBLE OUTLOOKUSDTBH AS SOON BREAK THE SUPPORT TRENDLINE WILL MAKE A BOUNCE ON MAJOR SUPPORT AREA FOR BUYING OPPORTUNITY.

USDTHB = A new rally brewingTHB has been THE strongest currency in Asia this year, Thai government has been trying to keep currency stabilize in very controlled envelop, but what needs to come, still needs to come.

Ascending triangle pattern in USD/THB chartExample of an ascending triangle, following the uptrend. Trend lines conforming the triangle are touched by the chart in at least two points. Please note the increase in volume at breakout (red arrow).


USDTHBWhats up Traders.
Primed like a pump.
Golden Ratio Retracement
Spread has come down quite a bit from open. I think its time to long this one.


Can Anyone Help Me???If you have experience with Elliott Wave Theory I would really love your insight and feedback. Does this look right? I ran Fib Retracement and then Fib Extention. Is this a good projection or should I go back further and start over with a new count?

USD/THB 1H Chart: Bearish momentumThe US Dollar has been depreciating against the Thai Baht in a short-term descending channel after the exchange rate reversed from the upper boundary of a long-term descending channel at 33.05.
As apparent on the chart, the currency pair has breached the support level formed by a combination of the 100– and 200-period SMAs (4H). Given this fact, it is likely that the downside momentum still prevails in the nearest time. The most probable downside target during the following trading sessions is the Fibonacci 50.00% retracement at 32.31.
In the unlikely event that some bullish pressure still prevails in the market, the US Dollar should not exceed the Fibonacci 23.60% retracement at 32.94.

USDTHB = Up onlyCome on, for a country that lives off tourist and foreigner investment, THB is stronger than JPY and CHF against USD?????? This is a no brainner, up it is, targer 33.8-34.2 to be inline with the rest of the world.

Target hit. Now reversing on a Channel Down. Short.TP = 33.600 hit as the previous 1D Channel Up aggressively broke to the upside (as indicated by the 4H consolidation mentioned on the previous post) and peaked at 34.650. Now a new 1D Channel Down has emerged (RSI = 30.614, MACD = -0.139, Highs/Lows = -0.2244, B/BP = -0.4740) aiming at a Lower Low near the 31.850 support. We are short with TP = 32.000.

USD/THB 1H Chart: Potential reversalThe Thai Baht has been appreciating against the US Dollar since the end of August. This movement is bounded by a descending channel.
Currently, the currency pair is trading near the lower channel line at 32.43. From the theoretical point of view, the pair could reverse from the lower boundary of given channel and aim for the resistance cluster formed by a combination of the 55-, 100– and 200-hour SMAs in the 32.60/32.73 range. An important resistance level to look out for is the Fibonacci 38.20% retracement at 32.59.
Technical indicators for the 1W time-frame also support bullish scenario.

USDTHB Dailysell limit;
tp1=33.0000 RR=1;
tp2=32.7500 RR=2;
notice:
1:Risk free after tp1;
2:all lines and orders have a few tolerance!!;

Bearish Engulfing confirm USD/THB Daily Chart go down.USD/THB confirm break down after price below 33.18 and you can increase follow short again if price break down 32.58

USD/THB 1H Chart: Reveal of dominant patternThe previous review of the USD/THB currency exchange rate concentrated on the newly formed less steep bullish pattern. On Tuesday, the pattern was still in force, as the currency exchange rate was declining in the borders of it.
However, something else attracted the attention of Dukascopy Analytics. Namely, a long term, large scale channel up pattern was spotted on the larger time frame charts. It might be possible that in the near future the bounce off from this trend line forces the rate lower and gives it enough strength to break the medium scale ascending pattern.
However, in the short term watch the support of the 55-hour simple moving average, which clearly provided support on Tuesday.


BUY LIMIT AT STRONG DEPARTURE DZ AFTER BROKE TRENDLINE
BUY LIMIT AT STRONG DEPARTURE DZ AFTER BROKE TRENDLINE