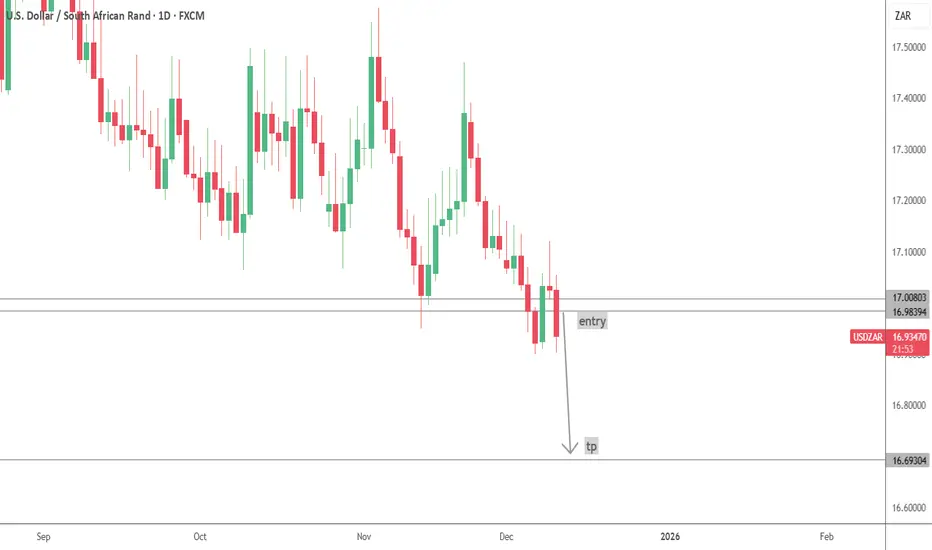
USDZAR Technical Point of ViewWhat can we say as technicians.
The price is trading near a super strong support area, testing it since 2022.
Looking a the technical analysis on this pair on the high weekly timeframe, sellers might just step in and drive prices lower. Despite what is going on between the US and South Africa the Rand is keeping gaining ground.
Leaving politics and all other fundamentals out of this equations, what do you think. Will seller show muscle and drive prices lower?
Would love to hear your insights and opinions.
U.S. Dollar / South African Rand
No trades
Market insights

USDZAR TRADE BREAKDOWN WIN 12.08.2025A+ set up for USDZAR with 2.61RR. Market come to my set up then took the trade.

USDZAR short set up If you're trading this pair know that the bigger banks out there are Putting massive short orders here on the daily timeframe after the price breaks it's weekly Range , next year USDZAR will be at R15

Bearish reversal off key resistance?USD/ZAR has rejected off the pivot which is a pullback resistance and could drop to the 1st support.
Pivot: 17.09341
1st Support: 16.91053
1st Resistance: 17.2333
Disclaimer:
The opinions given above constitute general market commentary and do not constitute the opinion or advice of IC Markets or any form of personal or investment advice.
Any opinions, news, research, analyses, prices, other information, or links to third-party sites contained on this website are provided on an "as-is" basis, are intended to be informative only, and are not advice, a recommendation, research, a record of our trading prices, an offer of, or solicitation for, a transaction in any financial instrument and thus should not be treated as such. The information provided does not involve any specific investment objectives, financial situation, or needs of any specific person who may receive it. Please be aware that past performance is not a reliable indicator of future performance and/or results. Past performance or forward-looking scenarios based upon the reasonable beliefs of the third-party provider are not a guarantee of future performance. Actual results may differ materially from those anticipated in forward-looking or past performance statements. IC Markets makes no representation or warranty and assumes no liability as to the accuracy or completeness of the information provided, nor any loss arising from any investment based on a recommendation, forecast, or any information supplied by any third party

USD/ZAR Outlook: Strategic Stability vs. Structural RisksThe US Dollar to South African Rand (USD/ZAR) exchange rate remains a critical barometer for emerging market sentiment, closing recently around 17.32. While UBS forecasts "limited upside" for the pair, implying Rand resilience, strategic analysis across multiple domains reveals a complex tug-of-war between fiscal consolidation and persistent structural headwinds.
Macroeconomics: The Fiscal Anchor
South Africa’s 2025 Medium Term Budget Policy Statement signaled a turning point in fiscal management. The National Treasury projected a consolidated budget deficit of 4.7% of GDP, a figure better contained than earlier fears suggested. This improved discipline, driven by solid revenue collection, supports the Rand by reducing sovereign risk premiums. Furthermore, the decision to lower the inflation target to 3% demonstrates the Reserve Bank’s assertive commitment to price stability, theoretically strengthening the currency's purchasing power parity over the long term.
Geopolitics and Geostrategy: The FATF Catalyst
A pivotal geostrategic victory was South Africa’s removal from the Financial Action Task Force (FATF) grey list in October 2025. This milestone reduces transaction costs for cross-border capital flows and reintegrates domestic financial institutions into the global high-trust network. Consequently, the risk premium embedded in the USD/ZAR exchange rate has diminished, limiting the Dollar’s upside potential. However, global trade fragmentation and protectionist policies in major trading partners (the US, China) remain latent geopolitical risks that could swiftly reverse these gains.
Industry Trends and Patent Analysis: Mining Innovation
The Rand’s performance is inextricably linked to the mining sector. Recent patent trends in Platinum Group Metals (PGM) extraction technologies indicate a shift toward more efficient, lower-energy recovery processes. As global demand for green hydrogen technologies—reliant on PGMs—accelerates, South African mines are positioning themselves to capitalize on this secular trend. UBS notes that the fiscal benefits of higher metal prices have yet to fully materialize, suggesting a delayed but potentially potent tailwind for the Rand heading into 2026.
Cyber Resilience and Financial Infrastructure
In the digital domain, the integrity of South Africa's financial infrastructure is paramount. The South African Reserve Bank’s cyber-resilience frameworks have fortified the banking sector against an escalating threat landscape, including ransomware and state-sponsored actors. This robust cyber-defense posture maintains foreign investor confidence in the JSE (Johannesburg Stock Exchange), preventing capital flight that would otherwise weaken the Rand.
Management and Leadership: Governance of National Unity
The formation of the Government of National Unity (GNU) has introduced a new dynamic in public sector leadership. The shift toward "coalition management" has enforced stricter checks and balances on public spending, mirroring corporate governance best practices. This cultural shift within government departments is reducing wasteful expenditure, directly supporting the Treasury’s deficit reduction goals, and stabilizing the currency.
Conclusion: Limited Upside for USD
UBS tactically favors selling USD/ZAR upside, viewing the pair as capped near current levels. The confluence of fiscal discipline, geostrategic reintegration (FATF), and resilient mining exports creates a formidable defense for the Rand. Unless global risk sentiment deteriorates sharply, the structural improvements in the South African economy suggest the path of least resistance for USD/ZAR is sideways to lower.

USDZAR LONG SETUPPrice is testing the 17.000 looking to break below to the 16. region but I'm anticipating it will go as far as 16.950 then bounce back up. Early entries are valid now for big accounts

USDZAR TRADE IDEAUSDZAR has just broken under a key level which was followed by a retest. A retest is a sign of a possible continuation to the downside. Waiting for proper confirmations to execute a short position.

usd is bearishaccording to fibo levels and reaction to 76.4% fibo ,we believe that usd is heading south toward specified level

Bullish reversal?USD/ZAR has bounced off the pivot and could rise to the 1st resistance that aligns with the 38.2% Fibonacci retracement.
Pivot: 17.0934
1st Support: 16.9763
1st Resistance: 17.2333
Disclaimer:
The opinions given above constitute general market commentary and do not constitute the opinion or advice of IC Markets or any form of personal or investment advice.
Any opinions, news, research, analyses, prices, other information, or links to third-party sites contained on this website are provided on an "as-is" basis, are intended to be informative only, and are not advice, a recommendation, research, a record of our trading prices, an offer of, or solicitation for, a transaction in any financial instrument and thus should not be treated as such. The information provided does not involve any specific investment objectives, financial situation, or needs of any specific person who may receive it. Please be aware that past performance is not a reliable indicator of future performance and/or results. Past performance or forward-looking scenarios based upon the reasonable beliefs of the third-party provider are not a guarantee of future performance. Actual results may differ materially from those anticipated in forward-looking or past performance statements. IC Markets makes no representation or warranty and assumes no liability as to the accuracy or completeness of the information provided, nor any loss arising from any investment based on a recommendation, forecast, or any information supplied by any third party.

RAND (ZAR) FLEXES MUSCLE POST-G20 BOOST ???Peace be unto you!!!
Primary Chart: USDZAR Analysis (Daily Timeframe)
Wave Analysis:
Price is completing a sideways correction that started printing in May 2023. This sideways correction in an intermediate wave (4). Minor wave A started the correction and terminated in September 2024 and minor wave B terminated in April 2025. The market is currently printing minor wave C to complete intermediate wave (4).
Indicator(s) Analysis:
1) EMA 200 & 50 (Weekly) - We may see price rally to touch these moving average lines before it continues to drop.
2) RSI 14 (Weekly) - RSI line rallying to retest 49.20 levels, it may also rally to 61.98 levels to create a Hidden Bearish Divergence.
3) MACD H (Weekly) - Faint bullish MACD H signaling that bulls are running out of steam, giving a clear signal for a Bearish Divergence.
Fundamental Analysis:
The South African government delivered a successful first G20 Leaders' Summit on the 22nd and 23rd of November 2025 that came with several billion dollars committed to few developmental projects in the country. As a result, we are seeing the rand (ZAR) strengthens against the US Dollar in the short & medium term. This will lead to a decrease in the cost of imported raw materials/goods for local consumers and businesses amongst other positive impacts.
#SabaliCapital
#TechnicalAnalysis
#G20

USDZAR (LONG)
Major support zone also perfect zone after retracement to go long
Always bullish in these zones

Price actually Zarusd price has broke above in this chart seem to gave rejected 3 times in one place on ur chart its selling since this one is flipped


Bullish bounce off 61.8% Fibonacci support?USD/ZAR is falling towards the pivot which acts as a pullback support that aligns with the 61.8% Fibonacci retracement and could bounce to the 1st resistance.
Pivot: 17.14336
1st Support: 17.06139
1st Resistance: 17.28160
Disclaimer:
The opinions given above constitute general market commentary and do not constitute the opinion or advice of IC Markets or any form of personal or investment advice.
Any opinions, news, research, analyses, prices, other information, or links to third-party sites contained on this website are provided on an "as-is" basis, are intended to be informative only, and are not advice, a recommendation, research, a record of our trading prices, an offer of, or solicitation for, a transaction in any financial instrument and thus should not be treated as such. The information provided does not involve any specific investment objectives, financial situation, or needs of any specific person who may receive it. Please be aware that past performance is not a reliable indicator of future performance and/or results. Past performance or forward-looking scenarios based upon the reasonable beliefs of the third-party provider are not a guarantee of future performance. Actual results may differ materially from those anticipated in forward-looking or past performance statements. IC Markets makes no representation or warranty and assumes no liability as to the accuracy or completeness of the information provided, nor any loss arising from any investment based on a recommendation, forecast, or any information supplied by any third party.

Bullish bounce off?USD/ZAR has bounced off the pivot and could rise to the 1st resistance.
Pivot: 17.16849
1st Support: 17.07313
1st Resistance: 17.35540
Disclaimer:
The opinions given above constitute general market commentary and do not constitute the opinion or advice of IC Markets or any form of personal or investment advice.
Any opinions, news, research, analyses, prices, other information, or links to third-party sites contained on this website are provided on an "as-is" basis, are intended to be informative only, and are not advice, a recommendation, research, a record of our trading prices, an offer of, or solicitation for, a transaction in any financial instrument and thus should not be treated as such. The information provided does not involve any specific investment objectives, financial situation, or needs of any specific person who may receive it. Please be aware that past performance is not a reliable indicator of future performance and/or results. Past performance or forward-looking scenarios based upon the reasonable beliefs of the third-party provider are not a guarantee of future performance. Actual results may differ materially from those anticipated in forward-looking or past performance statements. IC Markets makes no representation or warranty and assumes no liability as to the accuracy or completeness of the information provided, nor any loss arising from any investment based on a recommendation, forecast, or any information supplied by any third party.

USDZAR SWING LONGStrong MACD Divergence is building.
I plan to dollar-cost-average my buys as the price declines.
Long term target is above 20 🚀
Will start reducing position and taking semi profits @ 18 @18.3 and @ 19, after that I will let my remaining buy orders run.
Keep an eye on fundamentals and market behavior 👀
This trade idea will take a long time ⌚
Patience is key 🧘♀️
DISCLAIMER❗
My strategy is considered risky; I will continue to average into my position no matter how low the price goes.
Follow your own plan and emphasis on Money Management 💸

USDZAR This is not financial advice. The information shared about USD/ZAR or any potential buy setups is for educational and informational purposes only. Always do your own research and consult with a licensed financial professional before making any trading or investment decisions.

Bullish bounce off pullback supportUSD/ZAR is declining toward the pivot point, which serves as a pullback support level. From there, the pair could potentially bounce toward the 1st resistance level, which acts as a pullback resistance and sits slightly above the 60% Fibonacci retracement.
Pivot: 17.16611
1st Support: 17.10068
1st Resistance: 17.27964
Disclaimer:
The opinions given above constitute general market commentary and do not constitute the opinion or advice of IC Markets or any form of personal or investment advice.
Any opinions, news, research, analyses, prices, other information, or links to third-party sites contained on this website are provided on an "as-is" basis, are intended to be informative only, and are not advice, a recommendation, research, a record of our trading prices, an offer of, or solicitation for, a transaction in any financial instrument and thus should not be treated as such. The information provided does not involve any specific investment objectives, financial situation, or needs of any specific person who may receive it. Please be aware that past performance is not a reliable indicator of future performance and/or results. Past performance or forward-looking scenarios based upon the reasonable beliefs of the third-party provider are not a guarantee of future performance. Actual results may differ materially from those anticipated in forward-looking or past performance statements. IC Markets makes no representation or warranty and assumes no liability as to the accuracy or completeness of the information provided, nor any loss arising from any investment based on a recommendation, forecast, or any information supplied by any third party.

USDZAR-POSSIBLE REVERSAL IN PLAY-LONG BIASMONTHLY-monthly support/monthly respect candle
WEEKLY-weekly respect candle-Lq sweep
H4 sms with a Bullish context
Price currently is ready to buy

USDZAR Hey traders,here we are looking at USDZAR this currency pair am giving IDEAS on It once per year but this time it will be twice. JANUARY I UPDATED TRADERS THAT THE PRICE 20.000 IT'S A NOTE 💸IN SOUTH AFRICA WHICH MEANS IT WILL STRUGGLE TO BREAK THE RESISTANCE ON OUR USDZAR pair.
Reason it's because there's much higher volume and higher use of the 20.000.
(3MN time frame)
10.000 will be our support on USD vs ZAR
And 20.000 will be the resistance on
USD vs ZAR
And also on ZAR/USD
$1 will be our support (ZAR vs USD)
And $2 will be our resistance on (ZAR USD)
So here on USDZAR as u can see
on our chart is that the price is currently on 17.000 that's our retest level. Retest level is our 61.8.000 of fibbonacci.we call it the golden level of entries,
And we can also see that (B) on our left which is part of the triangle reversal pattern its also indicating that we have a strong support also on that area.
I tried looking at also our trend lines to confirm and it shows that how the trend is moving it can also form a bullish flag to the upside.
Entries and warings
=Find entries now
= manage ur traders after 1 week
=use proper risk management
Also know this is not a financial advise
Comment below what do u think of this idea and how is my pricing strategy working for you.

USDZAR long term BUYSHey traders,here we are looking at USDZAR this currency pair am giving IDEAS on It once per year but this time it will be twice. JANUARY I UPDATED TRADERS THAT THE PRICE 20.000 IT'S A NOTE 💸IN SOUTH AFRICA WHICH MEANS IT WILL STRUGGLE TO BREAK THE RESISTANCE ON OUR USDZAR pair.
Reason it's because there's much higher volume and higher use of the 20.000.
(3MN time frame)
10.000 will be our support on USD vs ZAR
And 20.000 will be the resistance on
USD vs ZAR
And also on ZAR/USD
$1 will be our support (ZAR vs USD)
And $2 will be our resistance on (ZAR USD)
So here on USDZAR as u can see
on our chart is that the price is currently on 17.000 that's our retest level. Retest level is our 61.8.000 of fibbonacci.we call it the golden level of entries,
And we can also see that (B) on our left which is part of the triangle reversal pattern its also indicating that we have a strong support also on that area.
I tried looking at also our trend lines to confirm and it shows that how the trend is moving it can also form a bullish flag to the upside.
Entries and warings
=Find entries now
= manage ur traders after 1 week
=use proper risk management
Also know this is not a financial advise
Comment below what do u think of this idea and how is my pricing strategy working for you.

USDZAR WEEKLY FORECASTHi Traders , Please Share Your Mind regard the Pair USDZAR, I would like to farther Learn more and Improve.
