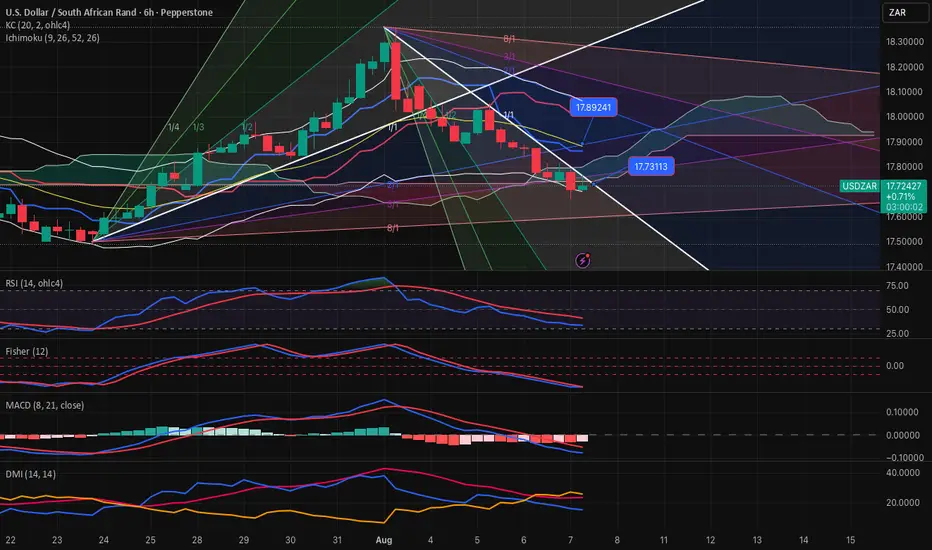
USDZAR-SELL strategy 6 hourly chart Reg. ChannelSame as the USDX of course, the pair is overbought. i felt yesterday we may see higher, but was not convinced to belong, however, we can add to our SELL, or have SELL position up here. The Reg. Channel is violated amidst this overbought status provides a good warning of potential corrective action.
Strategy SELL @ 18.2000-18.2500 and take profit near 18.0350 for now.
USDZAR trade ideas

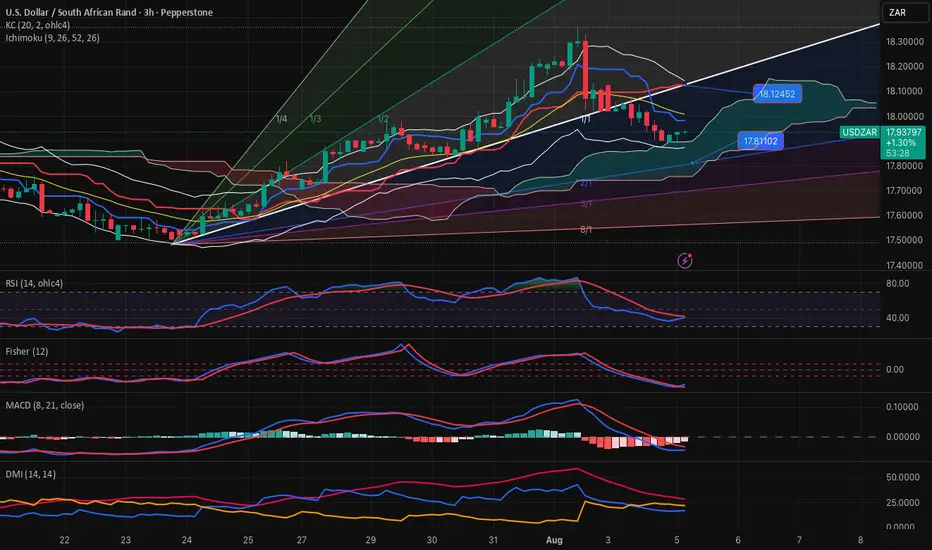
USDZXAR-NEUTRAL BUY strategy 3 hourly chartThe pair has moved lower as expected, however the decline has not been severe, and besides, other currencies show slightly oversold status, and this provide a good basis for BUY entry instead now.
Strategy BUY @ 17.9000-17.9300 and take profit near 18.0875 for now.
USDZAR-SELL strategy 12 hourly chart Reg.ChannelThe pair has been moving lower, and recovered this morning to 18.1200 area and came down quickly there after. the picture suggest we are negative territory and it feels we may test 17.9500 again going back 17.8150 area.
Strategy SELL @ 18.0500-18.0975 and taker profit near 17.8350 for now.

USDZAR-BUY strategy 6 hourly chart GANNThe pair has not been able to sustain the higher levels, and came down sharply. Now we are basing I feel and this may be a BUY opportunity this time around. Indicators are starting to look positive, and supports the likely hood for a move higher again.
Strategy BY @ 17.6875-17.7350 and take profit near 17.9350 for now.

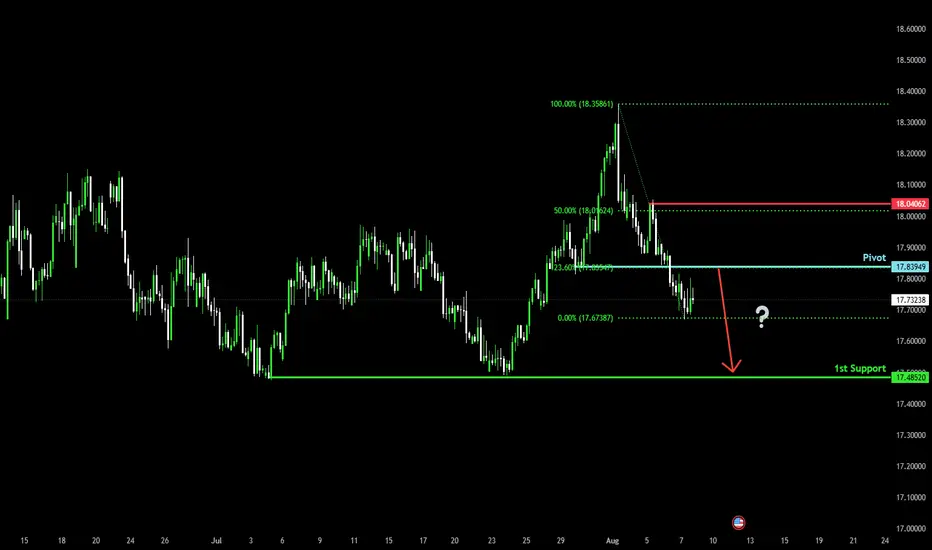
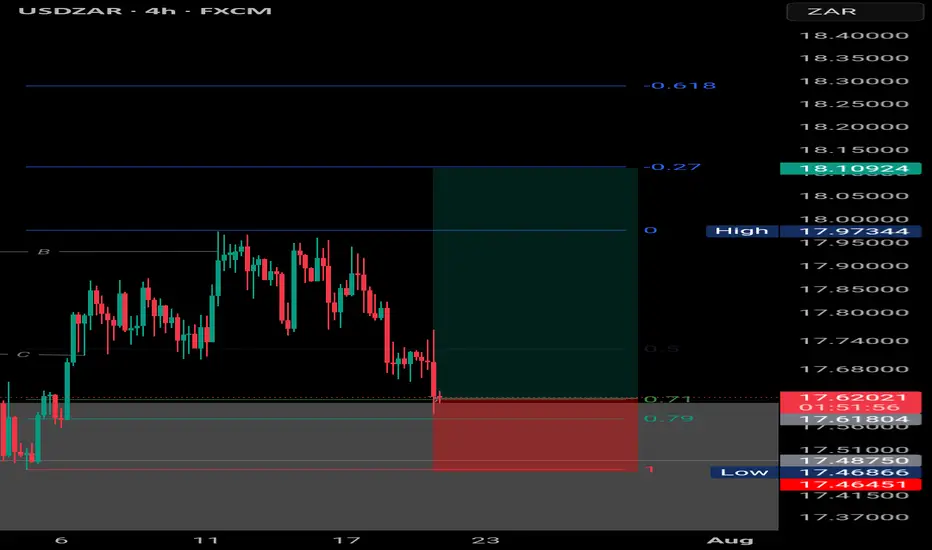
Bearish drop?USD/ZAR has reacted off the pivot and could drop to the 1st support which acts as a multi-swing low support.
Pivot: 17.8949
1st Support: 17.4852
1st Resistance: 18.0406
Risk Warning:
Trading Forex and CFDs carries a high level of risk to your capital and you should only trade with money you can afford to lose. Trading Forex and CFDs may not be suitable for all investors, so please ensure that you fully understand the risks involved and seek independent advice if necessary.
Disclaimer:
The above opinions given constitute general market commentary, and do not constitute the opinion or advice of IC Markets or any form of personal or investment advice.
Any opinions, news, research, analyses, prices, other information, or links to third-party sites contained on this website are provided on an "as-is" basis, are intended only to be informative, is not an advice nor a recommendation, nor research, or a record of our trading prices, or an offer of, or solicitation for a transaction in any financial instrument and thus should not be treated as such. The information provided does not involve any specific investment objectives, financial situation and needs of any specific person who may receive it. Please be aware, that past performance is not a reliable indicator of future performance and/or results. Past Performance or Forward-looking scenarios based upon the reasonable beliefs of the third-party provider are not a guarantee of future performance. Actual results may differ materially from those anticipated in forward-looking or past performance statements. IC Markets makes no representation or warranty and assumes no liability as to the accuracy or completeness of the information provided, nor any loss arising from any investment based on a recommendation, forecast or any information supplied by any third-party.

The dance between the USDZAR and (ZA10Y - US10Y)The chart shows the relationship between the USDZAR and the yield differential between the SA 10-year and the US 10-year (ZA10Y – US10Y).
2025 has been a wild ride for the rand and it has managed to put up a remarkable recovery in the 2Q2025 but where to now for the pair? The pair has not traded below the 200-week MA currently at 17.62, since the March 2022 just before the global rate hiking cycle. The only previous times the pair traded below this moving average was briefly in 2021 before the June/July riots in SA and during the “Ramaphoria” period in 2018.
The 200-week MA also coincides with the 38.2% Fibo retracement from the low in 2021. A brief break below these two support levels will allow the pair to fall onto the 50% Fibo retracement level at 16.62. The yield differential is however suggesting that the rand may not have much room to pull the pair too far below the 200-week MA. The brief break below the 5.00% during December 2024 and January 2025 was a bit of an anomaly given the volatility in the US bond market and I still believe 5.00% is a hard support for the yield differential. A bottom out of the yield differential could see it rise higher towards 7.50% which will be rand negative should the positive correlation hold.
To summarise, the yield differential is suggesting that the rand’s 2Q2025 recovery may be on its last legs but a break below the 200-week MA will allow the rand to pull the pair towards 16.50. I don't see the rand maintaining levels below 16.50 and this level seems like a long-term floor for the pair before another 5-wave impulse to the topside.
Historical trend analysis:
The SA rand is one of the most attractive emerging market currencies due to the carry trade appeal of the currency coupled with SA’s deep and liquid bond market. During periods when there is significant buying pressure on SA bonds, the SA yields will decrease meaning that the yield differential (ZA10Y-US10Y) decreases while in periods when SA bonds are selling off, yields on SA bonds will increase which increases the yield differential, citrus paribus. The USDZAR pair is thus positively correlated with this yield differential.
The chart goes back to 2018 when the USDZAR hit a low of 11.50 following the period dubbed the “Ramaphoria” period. Investor sentiment swinged aggressively positive in this period and the flow of international funds into the SA bond market saw the yield differential drop to a low around 5.00%. The yeld differential has never dropped below this level until early 2025 as indicated on the chart.
The yield differential and the USDZAR pair moved in tandem all the way through to the 1Q2022, maintaining its strong positive correlation. The next period marked the start of the global hiking cycle which saw the US 10-year yield rise from a low of 1.65% in March 2022 to a high of 5.00% in October 2023. This aggressive rise in US 10-year yields marked a period of extensive risk off sentiment and even caused a US banking crises in March 2023. The Fed stepped in and briefly paused their QT to add liquidity to system and provided the US banking system with the bank term funding program to patch up the cracks. The rand sold off due to risk off investor sentiment while the US 10-year yield rose due to the start of the rate hiking cycle which reduced the yield differential. The USDZAR climbed to a high of 19.90 in May 2023 while the yield differential dropped to a low of 7.50%. The yield differential continued to fall until the US 10-year yield topped out at 5.00% in October 2023, after which the positive correlation between the USDZAR and the yield differential was restored.
The next period marked positive sentiment towards SA following the election results and the formation on the government on national unity (GNU). Coupled with the end to the rate hiking cycle, the rand had the wind and risk on investor sentiment in its sails which allowed the rand to pull the pair to a low of 17.03. The optimism of the GNU and the realisation on another Trump presidency however saw the pair bottom out in September 2024. During the last quarter of 2024 the rand experienced sustained selling pressure while the yield differential continued to fall. The break in correlation was largely due to the US10-year yield climbing from 3.60% in September 2024 to a high of 4.80% in January 2025.

USDZAR Bullish ideaAs we can see this is our USDZAR quarterly shift idea were we are anticipating price to rally to the upside toward our draw on liquidity objectives. We had a weekly volume imbalance and monthly mean threshold order block show us support after we took out major liquidity points. We also showed more support on our daily FVG and a market shift taking place after a displacement. We are anticipating a rally for USDZAR and will be looking to see how price plays out.
USDZAR is an exotic pair that is part of the emerging markets and emerging markets/exotic pairs can usually lead ahead of major forex pair or lag between major forex pairs so this can also help us with our intermarket analysis of forex pairs when determining our dollar strength against other basket currencies.

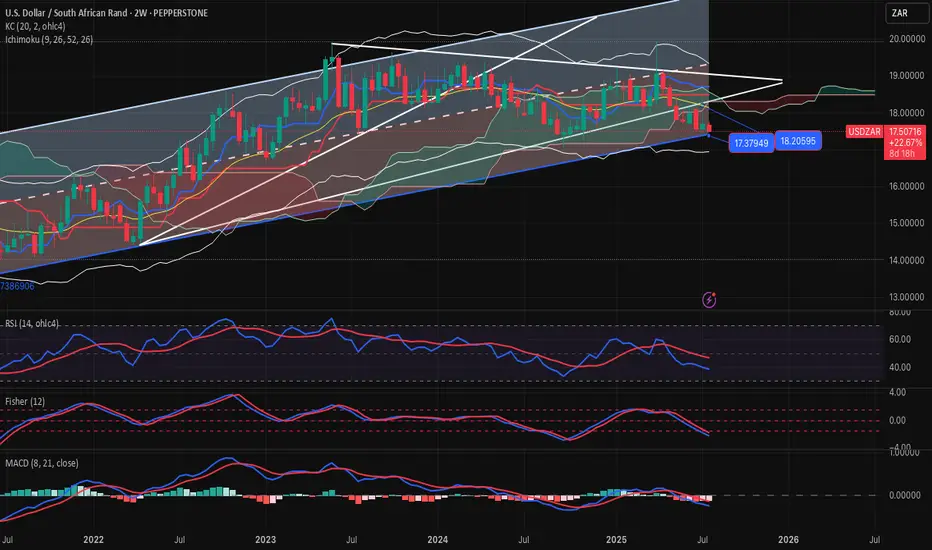
USDZAR-BUY strategy 2-weekly chart Reg. ChannelThe pair is overall on negative mode long-term basis. However, judging the bottom of the channel 17.3700 area or slightly below, BUY entry might look interesting for a recovery medium-term.
Gold is under pressure4 again and medium-term is is overbought, considering that, the pair may find benefit moving back towards 18.1000 area again.
Strategy BUY into 17.35-17.45 region for profit target 18.0975.
buy then sell!Hello all. I had a time to check some other pairs as USDZAR. I don't trade this pair but for who wants to trade, I think there is a very good OPP. to go buy and sell one after another. be happy(wink)

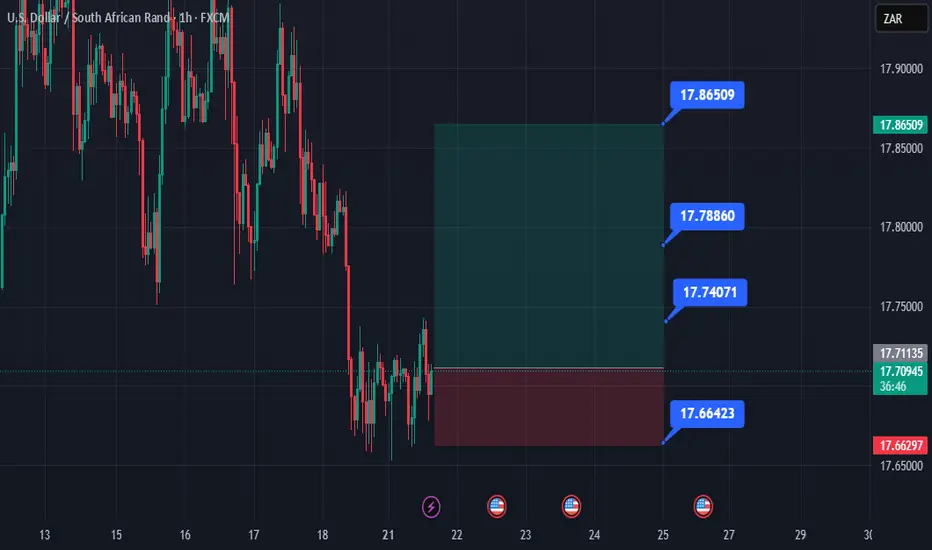
USD-ZAR-NEUTRAL RANGE 3 hourly chartThe pair is locked in between the large range 17.60-17.90 and we are consolidating within this range.
For now I prefer to play from range side, and will buy or sell near the bottom or top of it.
USDZAR-SELL strategy 3 hourly chart GANNThe pair has upward pressure and I suspect we will see little higher. Perhaps we may touch near 18.0500-18.0975 area, before selling pressure may set in. Since we have established 17.8500 area, it is wise to wait for the SELL. We are approaching overbought levels.
Strategy SELL @ 18.0650-18.1150 and take profit near 17.8875.


A bullish reversal , price broke structure to the upside Price is currently at premium price on a bigger TF and on H4 we see bearish trend violated and retraced back to premium price range
UsdZar-Buy Scenario123 Levels, Inverse Head and Shoulders, Trendline Breakout and retest, Bullish Pennant Formation

USDZAR-BUY strategy 9 hourly chart The pair is remaining to be within a larger trading band. We are in negative mode, but slightly becoming oversold. Based on the ranges we have seen, one could attempt to be in BUYING mode, but careful as always. gold is strong, but am still having the view to see recovery. Other assets(if we wish to use that term) like BTC and ETH are also overbought, and could drag gold down, hence an improvement for USDZAR over time.
Strategy BUY @ 17.6875-17.7350 and take profit near 17.8875 again.

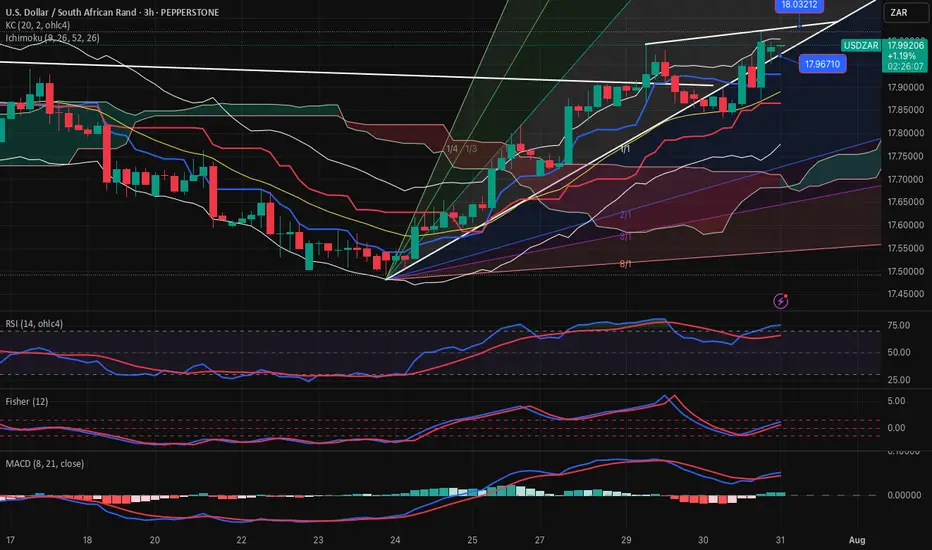
USDZAR-BUY strategy - RANGE 3 hourly chartThe pair is still within a wider range, and it feels we may remain so for a little longer. The direction feels moving higher again with cloud suport 17.7300 area, and i mproving indicators.
Strategy BUY @ 17.7875-17.8350 and take profit near 17.9875 for now.
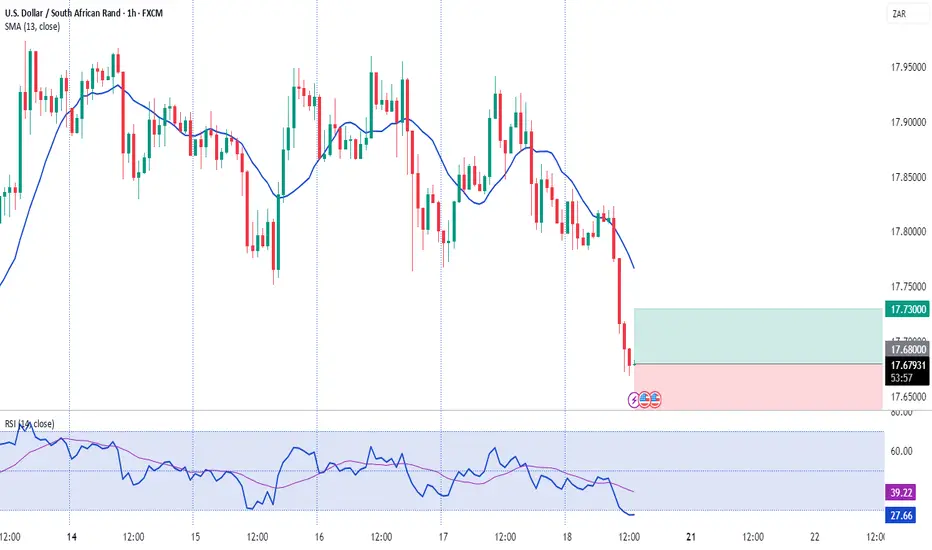
USDZAR Support CallingUSDZAR will short towards the support area at 17,73. Currently price is showing strong bearish reversal signs. Sells active from 19,91 to 17,73

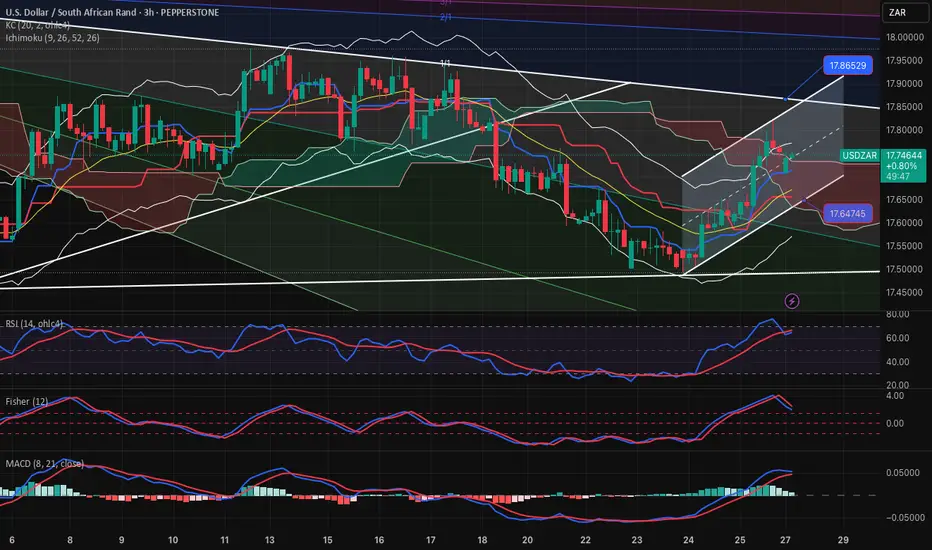
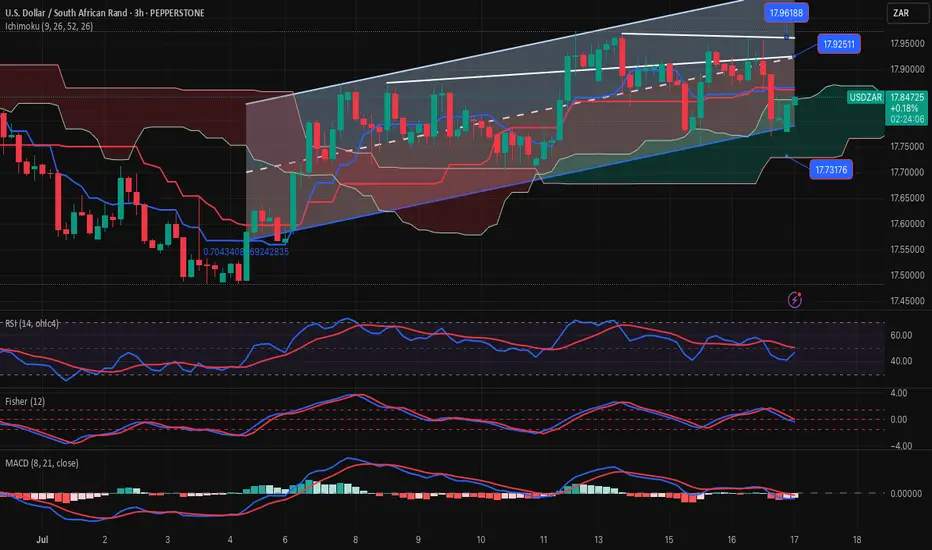
USDZAR-BUY strategy 3 houely chart Reg. ChannelThe pair seems to show some strength, and think we have a chance to test 17.9150 again in the short-term. The indicators provide support as long as 17.6900 is not violated on a close.
Strategy BUY @ 17.7350-17.7550 and take profit near 17.8875.
