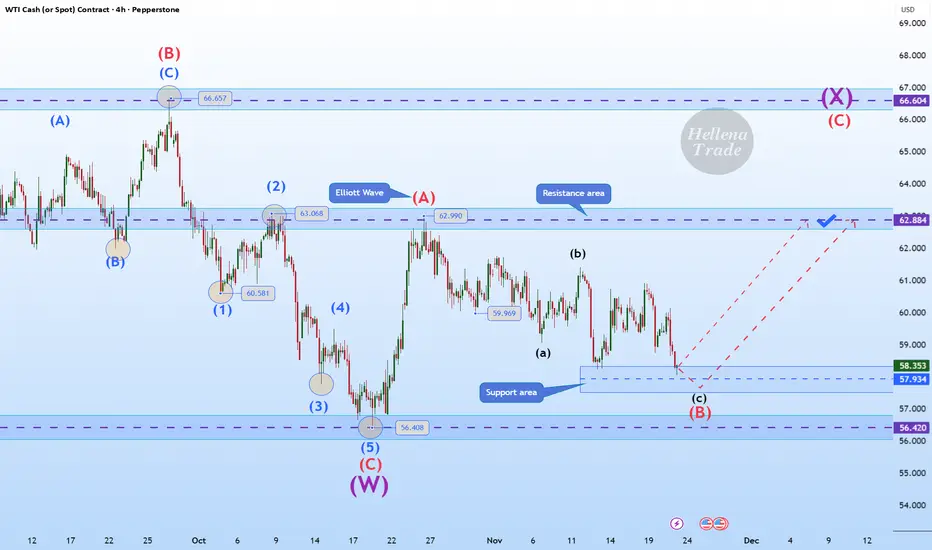
Hellena | Oil (4H): LONG to the area of the maximum of wave “A”.Colleagues, the past forecast has not been canceled, but I see some changes and therefore feel it is necessary to make a fresh forecast.
Apparently, the corrective wave “B” has extended to the area of 57.930. This is quite close to the low of wave “C” at 56.408 and the price should not update it, o
About CFDs on WTI Crude Oil
Crude Oil is a naturally occurring liquid fossil fuel resulting from plants and animals buried underground and exposed to extreme heat and pressure. Crude oil is one of the most demanded commodities and prices have significantly increased in recent times. Two major benchmarks for pricing crude oil are the United States' WTI (West Texas Intermediate) and United Kingdom's Brent. The differences between WTI and Brent include not only price but oil type as well, with WTI producing crude oil with a different density and sulfur content. The demand for crude oil is dependent on global economic conditions as well as market speculation. Crude oil prices are commonly measured in USD. Although there have been discussions of replacing the USD with another trade currency for crude oil, no definitive actions have been taken.
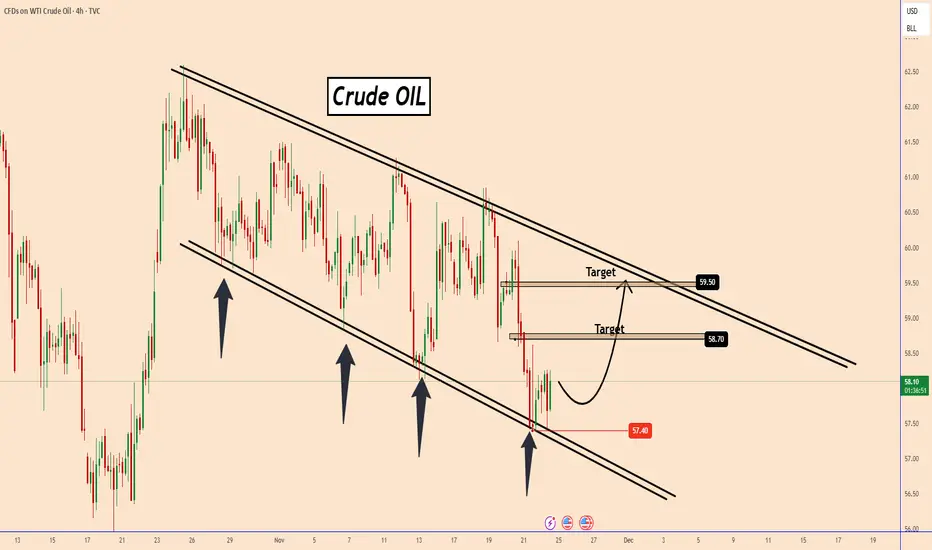
OIL: Time To Rise AgainOIL: Time To Rise Again
Oil is moving within a "Descending Channel Pattern" which is clear and well defined.
Every time the price tested the lower support of the pattern, the price moved back up and every time Oil tested the upper boundary of the pattern, the price moved back down.
It is more li
Potential bullish reversal?WTI Oil (XTI/USD) is falling towards the pivot and could bounce to the 61.8% Fibonacci resistance.
Pivot: 59.38
1st Support: 59.01
1st Resistance: 60.16
Disclaimer:
The opinions given above constitute general market commentary and do not constitute the opinion or advice of IC Markets or any form

USOIL ANALYSIS SETUP READ THE CAPTIONUSOIL is consolidating above a strong support zone while forming higher lows, indicating bullish pressure building. Price is currently testing the trendline resistance, and a clean breakout could open the way toward the upper target zone. As long as price stays above support, the bullish scenario re

Market Analysis: WTI Crude Oil Extends RecoveryMarket Analysis: WTI Crude Oil Extends Recovery
Crude oil price is rising and it could climb further higher toward $62.00.
Important Takeaways for WTI Crude Oil Price Analysis Today
- WTI Crude oil prices are moving higher above the $60.00 resistance zone.
- There is a key bullish trend line

Oil Upd:Price at Resistance–But the Real Story Is in OptionFlowRight now, price has reached the upper boundary of the 1σ Expected Range (ER).
A pause or rejection here is possible.
But that’s not the main story.
Bears are getting active in the options market.
First sign: A significant Put Condor has appeared — large enough to stand out.
Target range: $
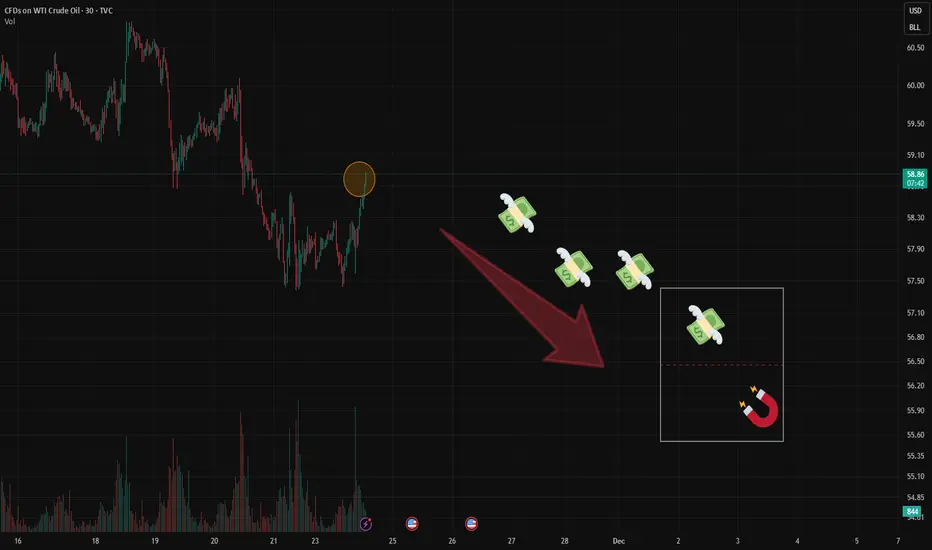
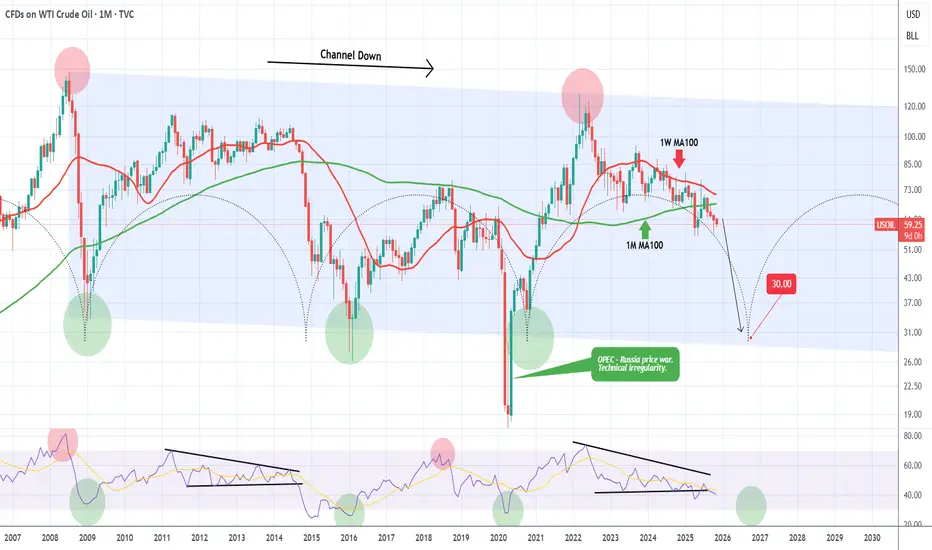
WTI OIL Is it possible to crash at $30.00?WTI Oil (USOIL) has been declining for 3 straight months (current red 1M candle is the 4th one) since the June 2025 rejection on the 1W MA100 (red trend-line). That has been the last rejection of a series of Lower Highs rejections on the 1W MA100 in the past 2 years.
On the much longer-term scale,
WTI/USD: Bullish Rally to 62.45?CFI:WTI is gearing up for a bullish rally on the 4-hour chart , with price rebounding from a key support zone near cumulative long liquidation levels, setting up a strong entry opportunity if buyers maintain control and push toward resistance amid recent consolidation. Entry from current levels

WTI OIL Short-term relief rebound before a Lower Low?WTI Oil (USOIL) has been trading within a 1-month Channel Down and has just completed its strongest Bearish Leg (-5.91%). All previous three Bearish Legs eventually bottomed and rebounded into the new Bullish Legs towards the Sell Zone consisting of the 4H MA200 (orange trend-line) - 1D MA50 (red tr


See all ideas
Displays a symbol's price movements over previous years to identify recurring trends.