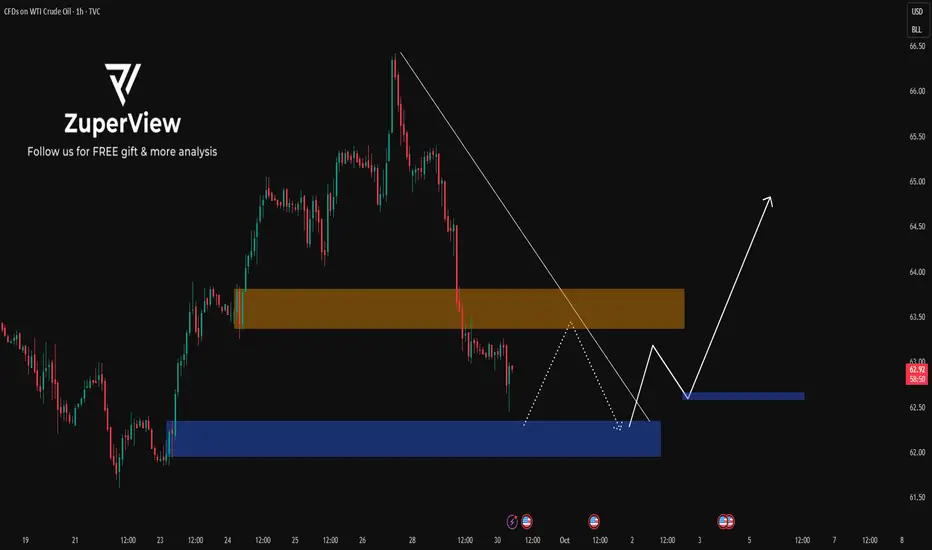
OIL BEARISH FAKEOUT LOOK TO BUYOur analysis is based on a multi-timeframe top-down approach and fundamental analysis.
Based on our assessment, the price is expected to return to the monthly level.
DISCLAIMER: This analysis may change at any time without notice and is solely intended to assist traders in making independent investment decisions. Please note that this is a prediction, and I have no obligation to act on it, nor should you.
Please support our analysis with a boost or comment!
USOIL.F trade ideas

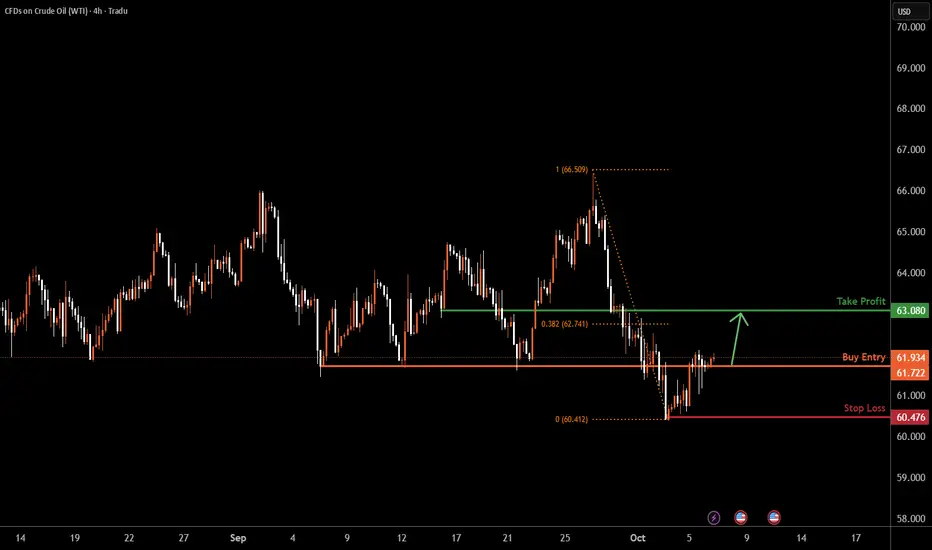
USOIL H4 | Bullish ReversalUSOIL is reacting off the buy entry, whichis a pullback support and could rise from this level to the take profit.
Buy entry is at 61.98, whichis a pullback support.
Stop loss is at 60.47, which swing low support.
Take profit is at 63.08, which is a pullback resistance that is slightly above the 38.2% Fibonacci retracement.
High Risk Investment Warning
Trading Forex/CFDs on margin carries a high level of risk and may not be suitable for all investors. Leverage can work against you.
Stratos Markets Limited (tradu.com ):
CFDs are complex instruments and come with a high risk of losing money rapidly due to leverage. 65% of retail investor accounts lose money when trading CFDs with this provider. You should consider whether you understand how CFDs work and whether you can afford to take the high risk of losing your money.
Stratos Europe Ltd (tradu.com ):
CFDs are complex instruments and come with a high risk of losing money rapidly due to leverage. 66% of retail investor accounts lose money when trading CFDs with this provider. You should consider whether you understand how CFDs work and whether you can afford to take the high risk of losing your money.
Stratos Global LLC (tradu.com ):
Losses can exceed deposits.
Please be advised that the information presented on TradingView is provided to Tradu (‘Company’, ‘we’) by a third-party provider (‘TFA Global Pte Ltd’). Please be reminded that you are solely responsible for the trading decisions on your account. There is a very high degree of risk involved in trading. Any information and/or content is intended entirely for research, educational and informational purposes only and does not constitute investment or consultation advice or investment strategy. The information is not tailored to the investment needs of any specific person and therefore does not involve a consideration of any of the investment objectives, financial situation or needs of any viewer that may receive it. Kindly also note that past performance is not a reliable indicator of future results. Actual results may differ materially from those anticipated in forward-looking or past performance statements. We assume no liability as to the accuracy or completeness of any of the information and/or content provided herein and the Company cannot be held responsible for any omission, mistake nor for any loss or damage including without limitation to any loss of profit which may arise from reliance on any information supplied by TFA Global Pte Ltd.
The speaker(s) is neither an employee, agent nor representative of Tradu and is therefore acting independently. The opinions given are their own, constitute general market commentary, and do not constitute the opinion or advice of Tradu or any form of personal or investment advice. Tradu neither endorses nor guarantees offerings of third-party speakers, nor is Tradu responsible for the content, veracity or opinions of third-party speakers, presenters or participants.
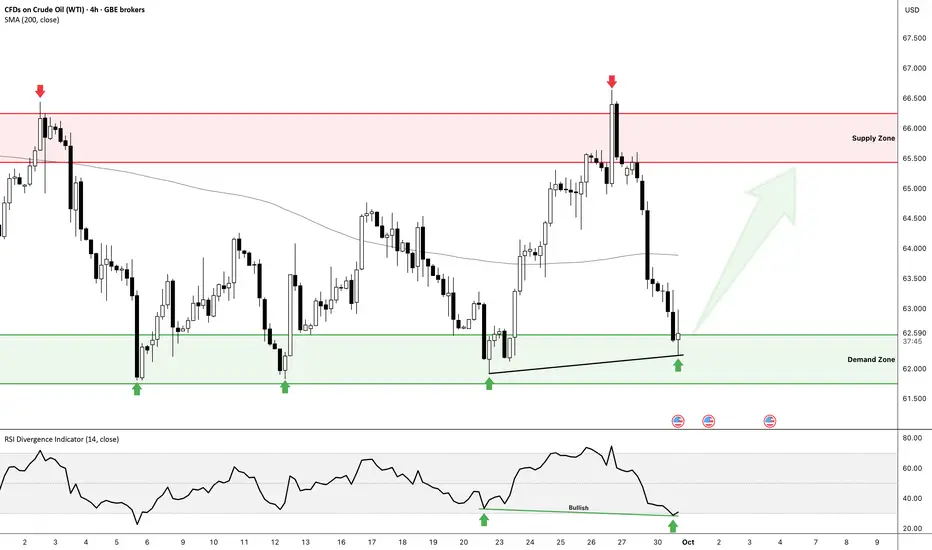
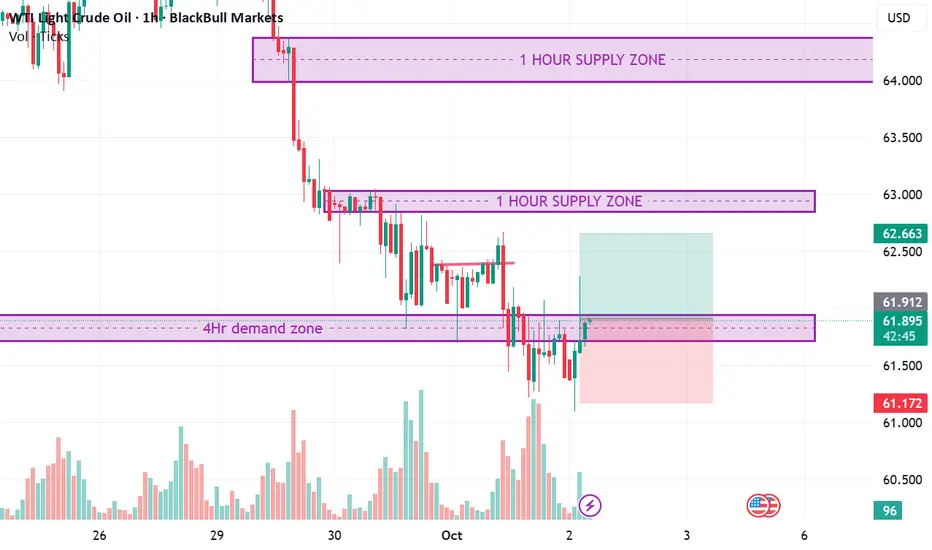
OIL Set for another bounce - 65 Target in Play📊 NFX GBEBROKERS:USOIL Chart Update
Fresh setup spotted:
Price tapped into demand zone and bounced cleanly.
Bullish RSI divergence confirmed → momentum shift to the upside.
Eyeing the supply zone above as the next key test.
🎯 Bias:
As long as demand holds, I’m favoring longs into supply.
Break below demand = setup invalidated.
Stay disciplined - this is a textbook demand-to-supply play.
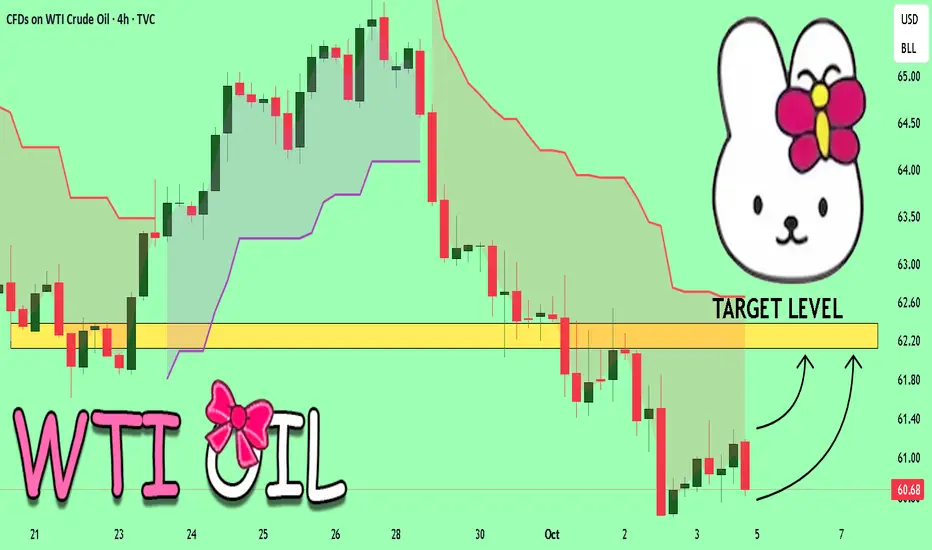
USOIL On The Rise! BUY!
My dear friends,
Please, find my technical outlook for USOIL below:
The instrument tests an important psychological level 60.68
Bias - Bullish
Technical Indicators: Supper Trend gives a precise Bullish
Super-trend indicator is more useful in trending markets where there are clear uptrends and downtrends in price. signal, while Pivot Point HL predicts price changes and potential reversals in the market.
Target - 62.13
About Used Indicators:
Super-trend indicator is more useful in trending markets where there are clear uptrends and downtrends in price.
Disclosure: I am part of Trade Nation's Influencer program and receive a monthly fee for using their TradingView charts in my analysis.
———————————
WISH YOU ALL LUCK
Hellena | Oil (4H): SHORT to support area of 58.884Colleagues, it appears that the downward movement is not over and I see several reasons to continue to look short.
The higher order wave “C” is looking to complete the correction and I expect the start of the middle order wave “3” to see the low update and reach the support area at 58.884.
Fundamental context
Oil remains under pressure as supply increases and demand outlook weakens. OPEC+ decided to slightly raise output for November, while U.S. inventories keep growing. Crude lost about 8% last week, and EIA now expects lower prices by the end of the year — all of which supports the idea of a continued downside move within wave “3” toward the 58.884 support area.
Manage your capital correctly and competently! Only enter trades based on reliable patterns!

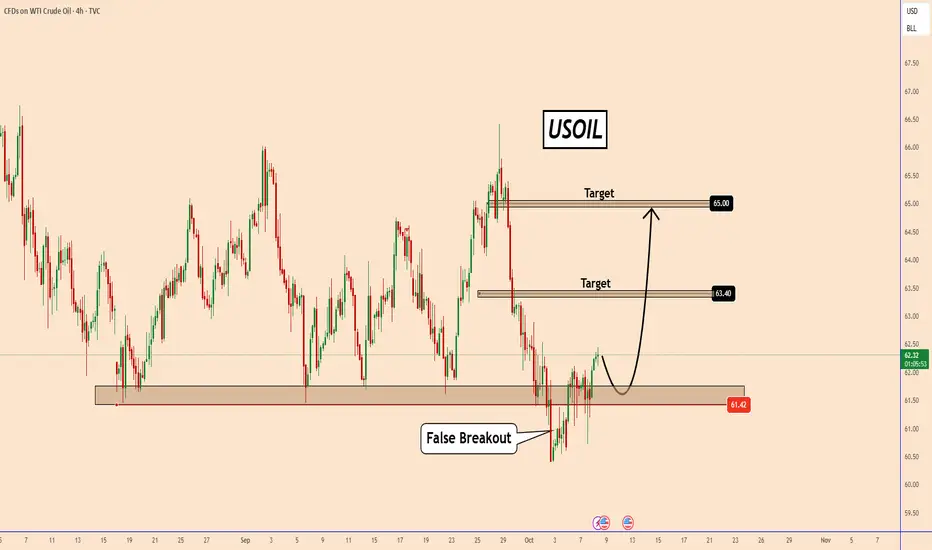
USOIL: False Breakout and Potential ReversalUSOIL: False Breakout and Potential Reversal
USOIL recently made a false breakout below the support area near 61.40, which suggests that sellers failed to push the price lower.
This false breakout often signals a possible bullish reversal if buyers maintain control.
Currently, the price is trading just above the support zone and seems to be building momentum for a potential rebound.
If the bullish scenario continues, the next targets to watch are:
63.40
65.00
As long as the price remains above 61.40, the bullish outlook stays valid.
You may find more details in the chart!
Thank you and Good Luck!
❤️PS: Please support with a like or comment if you find this analysis useful for your trading day❤️
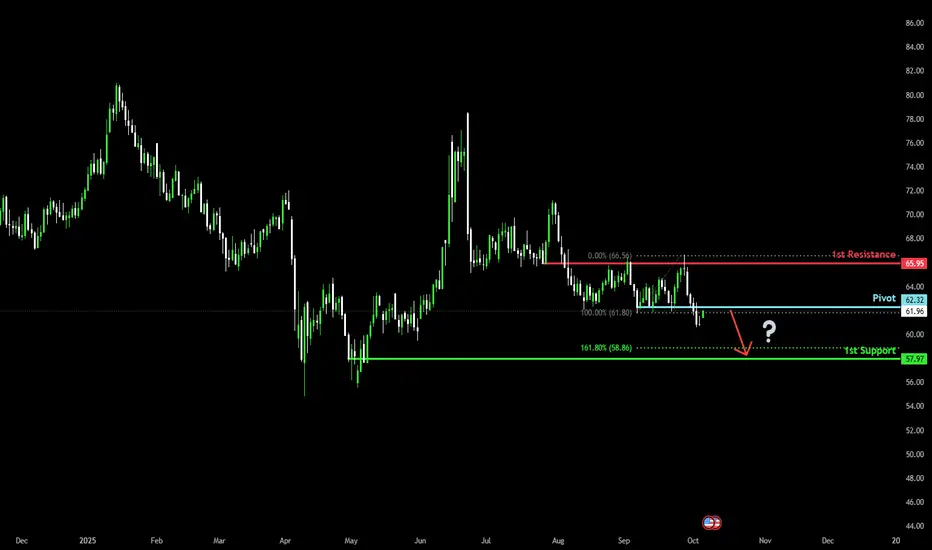
Could we see a bearish drop?WTI Oil (XTI/USD) is rising towards the pivot which acts as a pullback resistance and could reverse to the 1st support, which is slightly below the 161.8% Fibonacci extension.
Pivot: 62.32
1st Support: 57.97
1st Resistance: 65.95
Disclaimer:
The above opinions given constitute general market commentary, and do not constitute the opinion or advice of IC Markets or any form of personal or investment advice.
Any opinions, news, research, analyses, prices, other information, or links to third-party sites contained on this website are provided on an "as-is" basis, are intended only to be informative, is not an advice nor a recommendation, nor research, or a record of our trading prices, or an offer of, or solicitation for a transaction in any financial instrument and thus should not be treated as such. The information provided does not involve any specific investment objectives, financial situation and needs of any specific person who may receive it. Please be aware, that past performance is not a reliable indicator of future performance and/or results. Past Performance or Forward-looking scenarios based upon the reasonable beliefs of the third-party provider are not a guarantee of future performance. Actual results may differ materially from those anticipated in forward-looking or past performance statements. IC Markets makes no representation or warranty and assumes no liability as to the accuracy or completeness of the information provided, nor any loss arising from any investment based on a recommendation, forecast or any information supplied by any third-party.
Hellena | Oil (4H): SHORT to support area of 60 (Wave 3).The price is still not reaching the target of 60. I decided to make a new forecast, slightly changing the labeling of waves, or rather their importance.
At this stage, as before, I think that the price will reach the area of the level 60 in the middle wave “3”.
This movement is the development of the big corrective wave “C”. In general, the plan remains the same.
Manage your capital correctly and competently! Only enter trades based on reliable patterns!

$wti potentialHave TVC:USOIL here screaming for $68.844!!!!
$59.479 is the crucial key from here and if price cannot breach on close below that handle THIS will be an easy long to target working towards $64 off the jump.
However, high timeframes are not fully adjusted as of yet imo but the elephant in the room is Fridays high.
I believe if she can print out a close above it, this has massive potential for profiling longs based off $60.949.
Current profile is a “draft” as of now, and I will be watching closely at the next daily close to make a better judgement.
Bag Or Dust!!!! 🫶🏽🏦

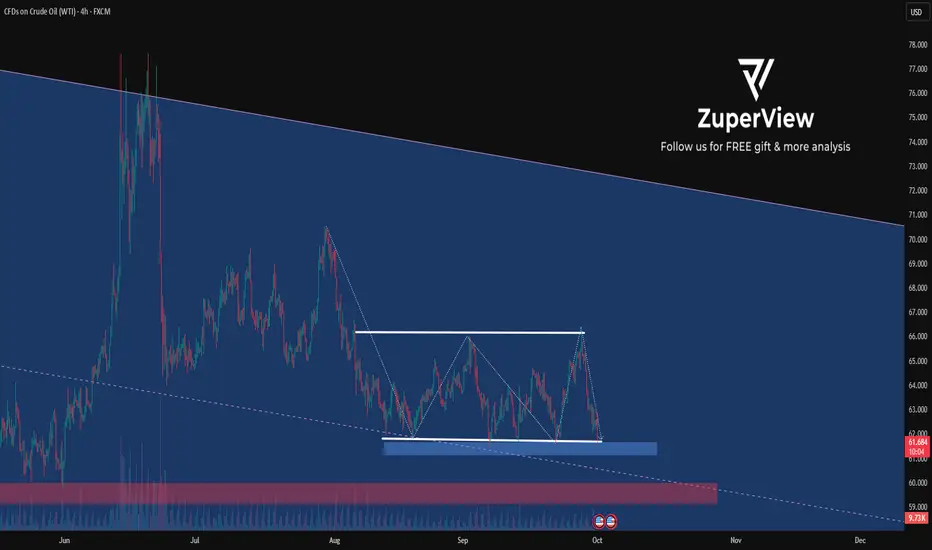
WTI Crude Oil
As shown in my previous analysis (pinned below this post), we shorted oil from the range high.
Now price has reached the range low, where two key buy levels are marked on the chart ✅.
🔹 If these levels break, the opposite scenario still stands.
🔹 We’re not in OPEC, we don’t make political or war decisions, and we don’t give orders to the market.
🔹 We are traders, simply trying to profit from opportunities.
⚡️ Remember: being biased toward your analysis = blowing up your account and losing confidence.
🎯 Always follow the market, never fight it.


USOIL: Waiting for a reaction at strong supportTo better understand my current outlook on USOIL, please refer to my previous higher-timeframe and fundamental analyses.
* Trend: assessed using at least three trend indicators, with market structure as the primary guide.
** Weak or Reversal Signals: Assessed based on one of our criteria for trend reversal signals.
*** Support/Resistance: Selected from multiple factors – static (Swing High, Swing Low, etc.), dynamic (EMA, MA, etc.), psychological (Fibonacci, RSI, etc.) – and determined based on the trader’s discretion.
**** Our advice takes into account all factors, including both fundamental and technical analysis. It is not intended as a profit target. We hope it can serve as a reference to help you trade more effectively. This advice is for informational purposes only and we assume no responsibility for any trading results based on it.
Please like and comment below to support our traders. Your reactions will motivate us to do more analysis in the future 🙏✨
George Vann @ ZuperView

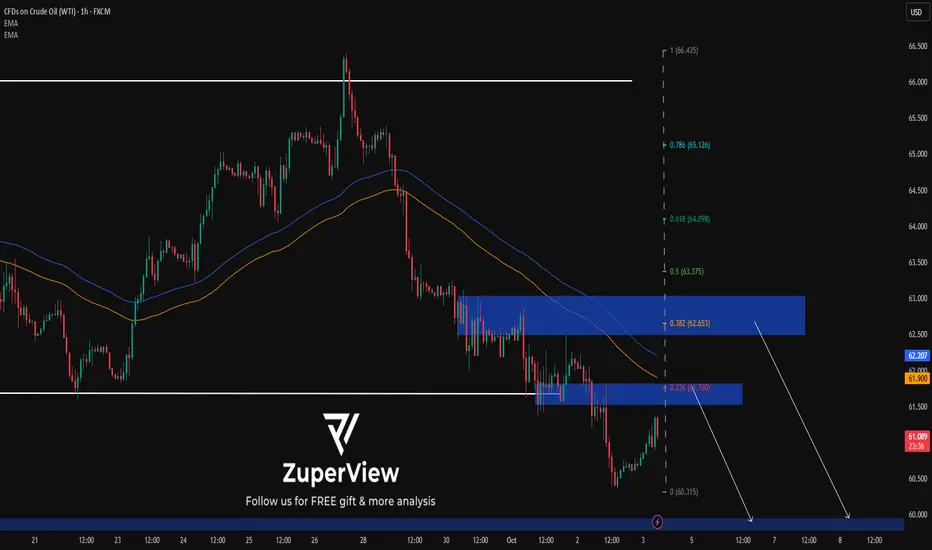
USOIL: Price breaks out of sideways – sell on pullbackTo better understand my current outlook on USOIL, please refer to my previous higher-timeframe and fundamental analyses.
This could be a position trade in anticipation of a larger downtrend on the daily timeframe, but there's risk involved due to the upcoming Non-Farm Payrolls (NFP) report this Friday.
* Trend: assessed using at least three trend indicators, with market structure as the primary guide.
** Weak or Reversal Signals: Assessed based on one of our criteria for trend reversal signals.
*** Support/Resistance: Selected from multiple factors – static (Swing High, Swing Low, etc.), dynamic (EMA, MA, etc.), psychological (Fibonacci, RSI, etc.) – and determined based on the trader’s discretion.
**** Our advice takes into account all factors, including both fundamental and technical analysis. It is not intended as a profit target. We hope it can serve as a reference to help you trade more effectively. This advice is for informational purposes only and we assume no responsibility for any trading results based on it.
Please like and comment below to support our traders. Your reactions will motivate us to do more analysis in the future 🙏✨
George Vann @ ZuperView


USOIL Will Go Down! Sell!
Here is our detailed technical review for USOIL.
Time Frame: 9h
Current Trend: Bearish
Sentiment: Overbought (based on 7-period RSI)
Forecast: Bearish
The market is testing a major horizontal structure 60.770.
Taking into consideration the structure & trend analysis, I believe that the market will reach 57.241 level soon.
P.S
Please, note that an oversold/overbought condition can last for a long time, and therefore being oversold/overbought doesn't mean a price rally will come soon, or at all.
Like and subscribe and comment my ideas if you enjoy them!

Crude Oil – Bearish Below 61.83 as OPEC+ Meeting NearsCrude Oil – Overview
Crude prices remain under pressure as geopolitical and supply factors clash with weak demand signals.
The Trump administration will provide Ukraine with intelligence for long-range missile strikes inside Russia, raising geopolitical risk.
Markets await Sunday’s OPEC+ meeting, where another November output hike is expected despite supply glut concerns.
The latest EIA data showed crude inventories rising for the first time in three weeks, while gasoline stocks posted the biggest jump since June—signalling weaker demand.
Technical Outlook
Oil maintains a bearish bias as long as price trades below 61.83, with downside targets at 60.20 → 58.70.
A confirmed 4H close above 61.83 would flip momentum bullish, targeting 63.47 → 64.75.
Pivot: 61.83
Support: 60.20 – 58.70
Resistance: 63.47 – 64.75

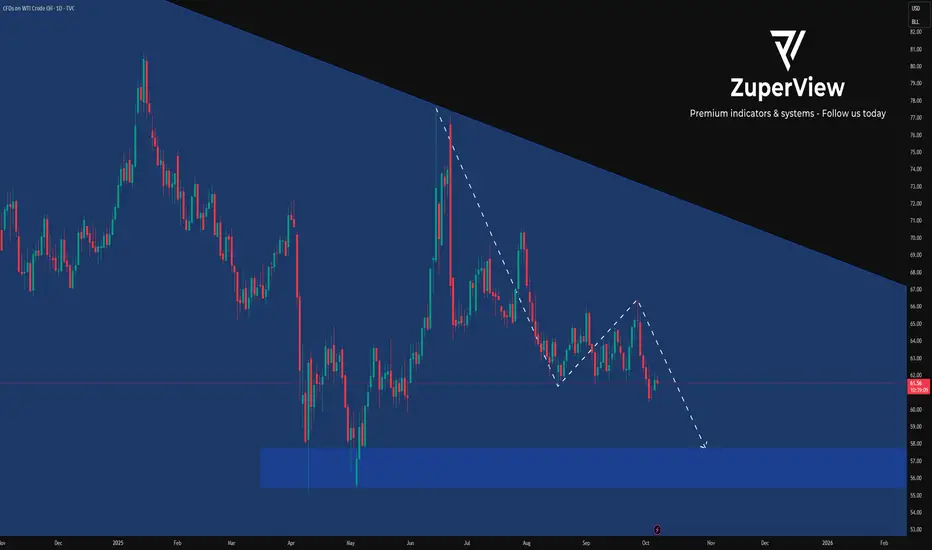
USOIL: Check lower levels after breaking out of the rangeThis is my previous analysis — feel free to take a look for reference.
OIL PRICE OUTLOOK
(Week of Oct 06 - 10, 2025)
1. Institutional Forecast Updates
● IEA (Sep 15, 2025):
WTI targets $64.2/bbl for 2025 and $47.8/bbl for 2026
Brent targets $68/bbl for 2025 and $51/bbl for 2026
● Goldman Sach (Jul 14, 2025):
WTI targets $63/bbl for H2 2025 and $52/bbl for 2026
Brent targets $64/bbl for H2 2025 and $56/bbl for 2026
● J.P. Morgan (May 16, 2025):
WTI targets $63/bbl for H2 2025 and $52/bbl for 2026
Brent targets $64/bbl for H2 2025 and $56/bbl for 2026
www.rigzone.com
www.reuters.com www.jpmorgan.com
2. Key Drivers & Risks
🔹 Updates on Supply–Demand and Geopolitical News
OPEC+ announced a milder-than-expected production increase of around 137 kb/d for November, leaving the oversupply outlook through 2026 largely unchanged.
Geopolitical tensions in the Red Sea / Gulf of Aden have flared up again.
U.S. inventories and weekly data: API estimated a draw of 3.7 mb (Sep 26), while recent EIA reports have shown mixed, inconsistent trends.
Market consensus: Reuters’ latest survey keeps the Brent forecast at ~$67.6/bbl for 2025, unchanged from last month, with expectations for lower prices around $60 in 2025 and further weakness into 2026.
🔹 Watchlist for Next Week
Official details on OPEC+’s November production implementation
API / EIA weekly U.S. oil data
Maritime security developments
Any notable demand-side signals
🔹 Overall View
Governments appear to favor keeping oil prices lower to support economic growth, though current levels are near or below breakeven for many producers.
Oil prices are expected to gradually decline within a relatively narrow range of $70–$50, while potential supply–demand shocks remain key factors to monitor for any sharp volatility.
3. Technical Analysis
* Trend: assessed using at least three trend indicators, with market structure as the primary guide.
** Weak or Reversal Signals: Assessed based on one of our criteria for trend reversal signals.
*** Support/Resistance: Selected from multiple factors – static (Swing High, Swing Low, etc.), dynamic (EMA, MA, etc.), psychological (Fibonacci, RSI, etc.) – and determined based on the trader’s discretion.
**** Our advice takes into account all factors, including both fundamental and technical analysis. It is not intended as a profit target. We hope it can serve as a reference to help you trade more effectively. This advice is for informational purposes only and we assume no responsibility for any trading results based on it.
Please like and comment below to support our traders. Your reactions will motivate us to do more analysis in the future 🙏✨
George Vann @ ZuperView

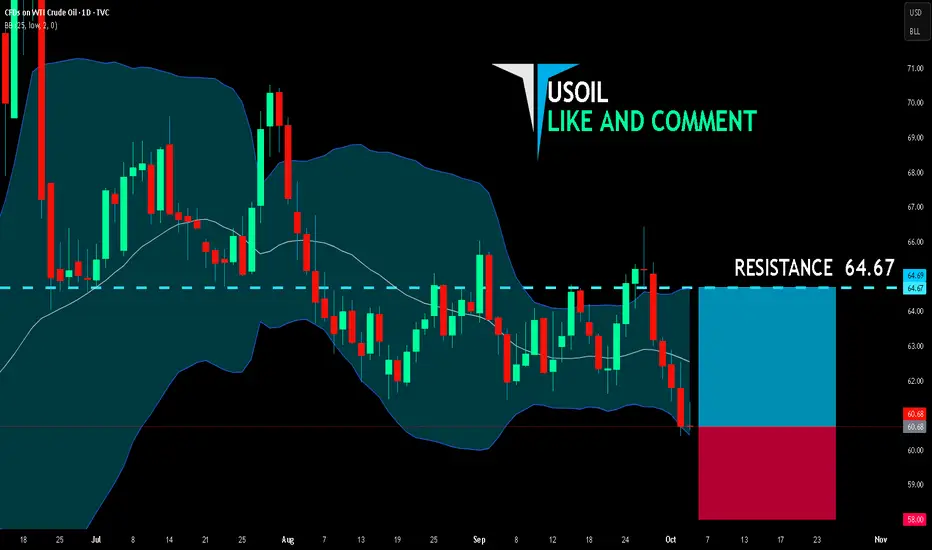
USOIL LONG FROM SUPPORT
USOIL SIGNAL
Trade Direction: long
Entry Level: 60.68
Target Level: 64.67
Stop Loss: 58.00
RISK PROFILE
Risk level: medium
Suggested risk: 1%
Timeframe: 1D
Disclosure: I am part of Trade Nation's Influencer program and receive a monthly fee for using their TradingView charts in my analysis.
✅LIKE AND COMMENT MY IDEAS✅
USOIL: Waiting for breakout after sidewaysTo better understand my current outlook on USOIL, please refer to my previous higher-timeframe and fundamental analyses.
* Trend: assessed using at least three trend indicators, with market structure as the primary guide.
** Weak or Reversal Signals: Assessed based on one of our criteria for trend reversal signals.
*** Support/Resistance: Selected from multiple factors – static (Swing High, Swing Low, etc.), dynamic (EMA, MA, etc.), psychological (Fibonacci, RSI, etc.) – and determined based on the trader’s discretion.
**** Our advice takes into account all factors, including both fundamental and technical analysis. It is not intended as a profit target. We hope it can serve as a reference to help you trade more effectively. This advice is for informational purposes only and we assume no responsibility for any trading results based on it.
Please like and comment below to support our traders. Your reactions will motivate us to do more analysis in the future 🙏✨