Hellena | Oil (4H): LONG to 50% Fibo lvl (58.00).The structure has broken down. Wave “2” of the middle order should not have updated the minimum of 56,420 of wave “B” of the higher order, but this has happened.
This means that the wave structure will have to be revised.
It seems that the major correction is not yet complete, and in order for the scenario to be completed, impulse “12345” must be completed.
At the moment, I think that the price will begin to form wave “4”.
I expect movement towards the 50% Fibonacci level from wave “3” at 58.00.
The target is not far off, but at the moment we need confirmation of the impulse.
This would mean that the price will update the local minimum, but more on that later.
Manage your capital correctly and competently! Only enter trades based on reliable patterns!
Market insights

Crude Oil Price Update – Clean & Clear ExplanationCrude Oil is currently trading near 57.50, after a prolonged corrective move from the recent swing high around 60.00. The overall structure shows that price previously respected an ascending trendline, but this support was broken, confirming a short-term bearish phase.
Price then moved inside a descending channel, making lower highs and lower lows. Recently, sellers pushed the market into a strong demand/support zone around 57.10–57.30, where bearish momentum has started to slow down. Multiple candles show rejection from this area, indicating that buyers are gradually stepping in.
The chart suggests a potential bullish reversal setup the current zone acts as a key accumulation area a small consolidation is forming after the sell-off if price holds above 57.10, a corrective pullback followed by upside continuation is likely
A successful break above 58.50 may open the path toward 59.80–60.00, which is a major supply and previous rejection zone a clear breakdown below 57.00 would invalidate the bullish idea in that case, price may extend the decline toward 56.50 or lower
WTI Crude Oil is currently at a critical support level. While the short-term trend remains weak, price action near demand suggests a possible recovery move. Traders should wait for confirmation (higher lows or bullish candles) before expecting a move toward the upper resistance zone this setup favours cautious bullish bias as long as support hold.
If you find it helpful please like and comments for this post and share thanks.

OIL: Bullish Harmonic Reversal in PlayOIL: Bullish Harmonic Reversal in Play
Crude Oil has completed a clean bullish harmonic pattern.
The price is currently stabilizing above the recent low, showing early signs of a potential bullish reversal.
As long as Oil holds above the D-point support, the harmonic pattern suggests a recovery toward the nearest supply zones.
Key Levels to Watch:
Target 1: 58.10
Target 2: 58.90
Overall, Oil is showing a technically clean bullish setup based on harmonic structure and could gain upside as long as the support holds.
You may find more details in the chart!
Thank you and Good Luck!
PS: Please support with a like or comment if you find this analysis useful for your trading day

Crude oil to revisit 2020 lows with drop to <$20 -80% - Dec 2025Now that we’re all driving Teslas and cyber trucks, oil can stay where it belongs, in the ground. Or something like that. Greenpeace finally makes progress.. as long as we forget about China burning colossal amounts of coal the size of mount Everest to power the machinery needed to recover minerals for EV battery manufacturer. And lets not forget about the poor suckers sat in $70k of negative equity after dropping $100k on the latest shiny EV with a $30k re-sale value.
At the same time unemployment rates surge as freshly minted graduates find themselves unable to get a job with that new degree in comparative Victorian teapot handle criticism. I'm shocked. As was the AI that got past the interview for operating the office coffee pot.
Anyway, never mind that nonsense, we’re here to understand if demand for crude is on the up or not. The chart says, no. Not at all.
Why?
Very simple. Recession. One of the strongest leading indicators for recession after the yield curve inversion is a collapse in price of crude oil. The collapse in price are shown with the past two recessions marked out in the overlay in grey columns.
The Technical
On the above 3 week chart:
1. Price action confirms broken market structure
2. Price action breaks through a 26 year line of support for the 3rd time.
3. A head and shoulder print confirms.
Conclusions
Right, so let’s wrap this up. The chart isn’t just whispering “recession,” it’s shouting it through a megaphone while setting fire to a stack of old oil barrels. We’ve got the classic playbook: a yield curve inversion for the intellectuals, followed by oil prices doing a swan dive off a cliff for the rest of us. It’s happened twice before with perfect timing, and now we’re lining up for the hat-trick.
The technicals aren't being subtle either. The market structure isn't just broken; it's been dismantled and sold for scrap. Price has punched through a 26 year support line not once, not twice, but for the third time. That’s not a test; that’s a verdict. And to add a cherry on top of this miserable cake, we’ve got a head and shoulders pattern. It’s the market’s way of shrugging and saying, “Yeah, it’s over.”
Is it possible price action does a u-turn like most of tradingview publishers are forecasting? For sure (and seriously they are, go-an, have a lookie.. ).
Is it probable? No
Ww
=============================================================
Disclaimer
This is not financial advice. This is one person looking at squiggly lines on a screen and making a guess, while making sarcastic remarks about global energy hypocrisy. I’m not your broker, your advisor, or your therapist.
Past performance is about as reliable a guide to the future as a politician’s promise. Just because oil tanked before a recession before, doesn’t guarantee it will do it again. Maybe this time is different. Who knows?
Do your own research. Make your own decisions. Don’t bet the house on the cynical musings of some bloke on the internet, no matter how compelling the head and shoulders pattern looks.

Hellena | Oil (4H): LONG to the area of the maximum of wave “1”.Colleagues, I believe it is necessary to update the forecast slightly. Overall, it remains unchanged, with an upward movement expected.
At the moment, I believe that the higher-order wave “B” has formed, and now in wave ‘C’ I see a five-wave movement “12345”.
I expect wave “3” to begin its movement soon, and I consider the first target to be the maximum area of wave “1” at 60.576.
Manage your capital correctly and competently! Only enter trades based on reliable patterns!

WTI drops near 2025 lows amid Ukraine-Russia deal, can $55 hold?WTI crude oil has declined near fresh 2025 lows around $56.60 as optimism over a Russia-Ukraine peace deal collides with fears of global oversupply. With NFP and central bank decisions looming, the market is bracing for a volatile test of the critical $55 support.
In this video, we analyse the bearish pressure from potential sanctions relief on Russian oil and persistent market surpluses, weighed against the bullish risks of escalating US-Venezuela tensions. We then map out the technical path to $55 and lower if fractals work out and the conditions for a potential bounce back toward $60.
Key drivers
Bearish catalyst : Progress in US-backed Russia-Ukraine peace talks is fuelling expectations of supply normalisation, pushing prices down amid a market already facing a surplus through 2026.
Bullish risks : Escalating tensions between the US and Venezuela, including tanker seizures, threaten to disrupt roughly 1 million barrels per day of supply, potentially offsetting bearish sentiment.
A packed week featuring the NFP report and rate decisions from the BOE, ECB, and BOJ will drive dollar volatility, directly impacting crude prices.
WTI remains at risk below $59-60. The primary downside target is the structural support at $55, with a break opening the door to $50. Resistance stands at $58.50 and $60.00.
Trade Plan : Bearish bias targets a test of $55.00 as long as price holds below $58.50. Watch for a reversal signal at $55 or a reclaim of $60 on supply disruption news.
Trading the oil crash? Share your thoughts on the $55 support level in the comments and follow for more commodity and macro trade setups.
This content is not directed to residents of the EU or UK. Any opinions, news, research, analyses, prices or other information contained on this website is provided as general market commentary and does not constitute investment advice. ThinkMarkets will not accept liability for any loss or damage including, without limitation, to any loss of profit which may arise directly or indirectly from use of or reliance on such information.

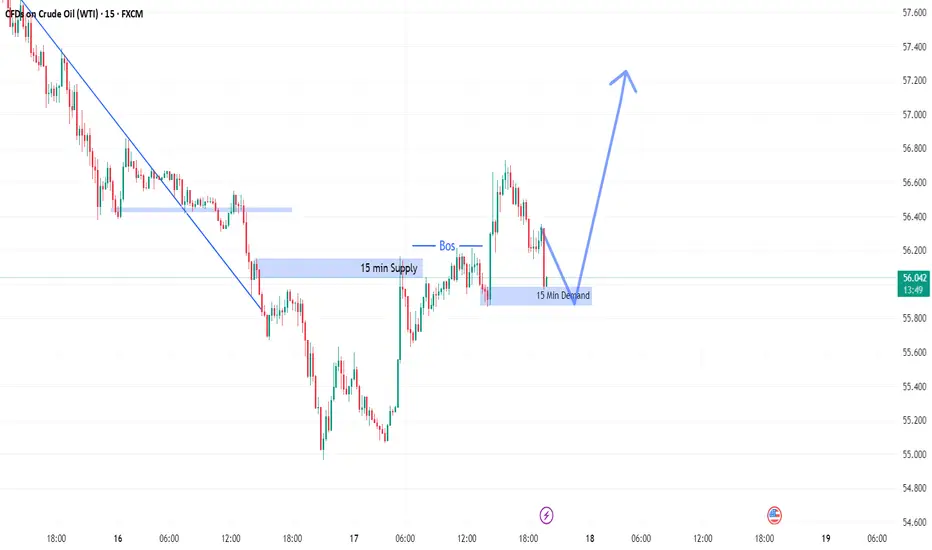
Go Long after medicated this Demand Zone.Always wait for lower time conformation and perfect candelstick conformation.
USOIL H4 | Heading Towards Pullback ResistanceMomentum: Bearish
The price is rising towards the sell entry, which acts as a pullback resistance, and also trading below the Ichimoku cloud, which is a good sign of bearish momentum.
Sell entry: 57.31
Pullback resistance
Slightly above the 38.2% Fibonacci retracement
Stop loss: 58.16
Overlap resistance
Slightly below the 61.8% Fibonacci retracement
Take profit: 55.17
Pullback support
High Risk Investment Warning
Stratos Markets Limited (tradu.com ), Stratos Europe Ltd (tradu.com ):
CFDs are complex instruments and come with a high risk of losing money rapidly due to leverage. 70% of retail investor accounts lose money when trading CFDs with this provider. You should consider whether you understand how CFDs work and whether you can afford to take the high risk of losing your money.
Stratos Global LLC (tradu.com ): Losses can exceed deposits.
Please be advised that the information presented on TradingView is provided to Tradu (‘Company’, ‘we’) by a third-party provider (‘TFA Global Pte Ltd’). Please be reminded that you are solely responsible for the trading decisions on your account. Any information and/or content is intended entirely for research, educational and informational purposes only and does not constitute investment or consultation advice or investment strategy. The information is not tailored to the investment needs of any specific person and therefore does not involve a consideration of any of the investment objectives, financial situation or needs of any viewer that may receive it. Past performance is not a reliable indicator of future results. Actual results may differ materially from those anticipated in forward-looking or past performance statements. We assume no liability as to the accuracy or completeness of any of the information and/or content provided herein and the Company cannot be held responsible for any omission, mistake nor for any loss or damage including without limitation to any loss of profit which may arise from reliance on any information supplied by TFA Global Pte Ltd.

Heading towards pullback resistance?WTI Oil (XTI/USD) is rising towards the pivot, which acts as a pullback resistance and could reverse to the 1st support.
Pivot: 57.45
1st Support: 55.20
1st Resistance: 58.51
Disclaimer:
The opinions given above constitute general market commentary and do not constitute the opinion or advice of IC Markets or any form of personal or investment advice.
Any opinions, news, research, analyses, prices, other information, or links to third-party sites contained on this website are provided on an "as-is" basis, are intended to be informative only, and are not advice, a recommendation, research, a record of our trading prices, an offer of, or solicitation for, a transaction in any financial instrument and thus should not be treated as such. The information provided does not involve any specific investment objectives, financial situation, or needs of any specific person who may receive it. Please be aware that past performance is not a reliable indicator of future performance and/or results. Past performance or forward-looking scenarios based upon the reasonable beliefs of the third-party provider are not a guarantee of future performance. Actual results may differ materially from those anticipated in forward-looking or past performance statements. IC Markets makes no representation or warranty and assumes no liability as to the accuracy or completeness of the information provided, nor any loss arising from any investment based on a recommendation, forecast, or any information supplied by any third party

Bearish Scenario - USOILHello traders,
the USOIL has reached the support level (56.802 – 56.332).
Let’s look for a bearish scenario :
If the market breaks and closes below this support ,
we could see a bearish continuation.
🎯 TARGET: 54.000

USOIL Is Very Bullish! Buy!
Here is our detailed technical review for USOIL.
Time Frame: 1h
Current Trend: Bullish
Sentiment: Oversold (based on 7-period RSI)
Forecast: Bullish
The market is approaching a significant support area 57.360.
The underlined horizontal cluster clearly indicates a highly probable bullish movement with target 58.090 level.
P.S
Overbought describes a period of time where there has been a significant and consistent upward move in price over a period of time without much pullback.
Like and subscribe and comment my ideas if you enjoy them!

WTI OIL Time to buy the 8-month Support.Last week (December 9, see chart below), we gave a strong Sell Signal on WTI Oil (USOIL) as the 1-month Channel Down topped and started its new Bearish Leg, which eventually hit our $56.20 Target:
This time we move back to the 1D time-frame as the longer term dynamics are coming into place again. The key development now is that the price hit yesterday the 55.20 8-month Support (holding since April 09 2025) and today bounced.
This rebound has high probabilities of being a sustainable one, especially since the 1D RSI also bounced from inside its own Support Zone.
Based on the 6-month Channel Down, the immediate Resistance level, thus our short-term Target is the 1D MA50 (blue trend-line). We estimate that the price can make contact with it at $58.50.
---
** Please LIKE 👍, FOLLOW ✅, SHARE 🙌 and COMMENT ✍ if you enjoy this idea! Also share your ideas and charts in the comments section below! This is best way to keep it relevant, support us, keep the content here free and allow the idea to reach as many people as possible. **
---
💸💸💸💸💸💸
👇 👇 👇 👇 👇 👇

WTI Oil: Bulls vs Bears – The Next Major Move Is LoadingHello and best wishes to all my TradingView followers 👋🌹
Hope you’re doing great and trading safely 💪📊
Today, we are going to analyze WTI Crude Oil in the short-term perspective, focusing mainly on the 4H and Daily timeframes.
Based on the chart, price is currently moving within a range structure with a bearish bias and is reacting to several key technical levels.
🔻 Market Structure Overview
Price is trading below the descending Dynamic Resistance (trendline)
The highlighted Daily Resistance Zone acts as a strong supply area
Price is currently inside a decision zone, where volatility is expected ⏳
🟥 Bearish Scenario 📉
If price breaks and closes below the marked support zone on the Daily timeframe:
🔻 Bearish continuation becomes valid
📌 A potential pullback to the broken zone may occur before continuation
🎯 Targets can be activated step by step at lower demand levels (as shown by the gray projections on the chart)
This scenario aligns with the lower high & lower low structure and weak bullish momentum
📉 As long as price remains below the dynamic resistance, the bearish scenario remains dominant.
🟩 Bullish Scenario 📈
If price manages to:
✅ Break the descending trendline (Dynamic Resistance)
✅ Close a valid 4H candle above the resistance
Then we may expect:
🔁 A pullback to the broken trendline
🚀 A bullish continuation toward higher resistance levels
🎯 Targets located at previous highs and key supply zones
📌 This scenario requires confirmation. Without a valid breakout, it remains only a possibility.
🧠 Final Thoughts
Price is at a very critical level
📉 Support break = continuation to the downside
📈 Trendline breakout = potential trend reversal
⏳ Best approach here is waiting for confirmation before entering trades
⚠️ Disclaimer:
This analysis is for educational purposes only and does not constitute financial or investment advice. All trading decisions are your own responsibility. Please always follow proper risk and money management ⚠️
If you found this analysis helpful ❤️
🔔 Don’t forget to like, comment, and follow
Wishing you green trades and consistent profits 🌱📈

USOIL BULLISH BIAS RIGHT NOW| LONG
USOIL SIGNAL
Trade Direction: long
Entry Level: 57.53
Target Level: 59.96
Stop Loss: 55.93
RISK PROFILE
Risk level: medium
Suggested risk: 1%
Timeframe: 1D
Disclosure: I am part of Trade Nation's Influencer program and receive a monthly fee for using their TradingView charts in my analysis.
✅LIKE AND COMMENT MY IDEAS✅

Crude Oil - Daily outlook WTI CRUDE OIL – Major Base Formation & Reversal Setup
Market Context & Structure
WTI has been in a prolonged corrective / bearish phase for several months. The recent price action shows clear base-building behavior, indicating selling pressure is getting exhausted.
Key observation:
Price has stopped making lower lows
Volatility has compressed near the base
Multiple rejections from below have failed to break support
This is typical behavior before a trend reversal.
Summary View
WTI is no longer bearish
Market is in accumulation phase
Inverse Head & Shoulders suggests trend reversal
Risk is clearly defined and limited
Reward potential is large and asymmetric
Bias remains bullish unless the base fails.
Disclaimer
This analysis is for educational and informational purposes only. It does not constitute financial advice or a recommendation to trade. Commodity markets are highly volatile. Please perform your own analysis and use proper risk management before taking any positions.

OIL (WTI) | Bearish Below 57.41 Amid Oversupply RisksOIL (WTI) – Technical Overview
Oil prices are inching higher, but upside remains limited as markets weigh Ukraine peace negotiations and growing oversupply concerns.
Diplomatic pressure from the U.S. to secure a Russia–Ukraine peace agreement by year-end could lead to a future easing of sanctions, a development that would likely increase global supply.
At the same time, OPEC+ and non-OPEC producers continue to raise output despite weak demand growth, keeping both major benchmarks near their lowest levels since late October.
Technical Analysis
WTI crude maintains a bearish momentum while trading below 57.41, with downside targets at:
→ 56.38 → 54.40 (continuation if 56.38 breaks)
A deeper decline becomes likely if sellers push below the 56.38 support zone.
Bullish recovery requires stability above 57.41, with confirmation coming from a 4H candle close.
If this happens, price may extend upward toward: → 58.05 → 58.70
The 57.41 level remains the key pivot separating bearish continuation from bullish correction.
Pivot Line: 57.41
Support: 56.40 · 54.40
Resistance: 58.05 · 58.70

USOIL Price Analysis & Bearish Trade Execution🛢️ Asset: WTI “USOIL” – Energies Market Trade Opportunity Guide (Day/Swing Trade)
📉 Plan: Bearish Plan Confirmed
Momentum is weakening, liquidity pockets are exposed at the lower ranges, and the structure favors downside continuation. Price remains vulnerable to deeper drawdowns as volatility compresses.
🎯 Entry:
ANY PRICE LEVEL ENTRY
(Execute based on your personal confirmation rules, premium/discount zones, or volatility triggers.)
🛡️ Stop Loss (Risk Guide):
This is the Thief SL @ 58.500 🛑
Dear Ladies & Gentlemen (Thief OG’s), kindly adjust your SL based on your own strategy, volatility preference, and personal risk model.
Note: I am not recommending that you use only my SL. You can make money and take money at your own risk.
💰 Target:
Strong support + oversold conditions + liquidity trap identified below, so kindly aim to escape with profits.
🎯 Our Target: 55.500
Note: Dear Ladies & Gentlemen (Thief OG’s), I am not recommending using only my TP. It is your own choice—you can make money and take money at your own risk.
🌍 Related Pairs to Watch (Correlation Insights)
1️⃣ Brent Crude – “UKOIL”
Often moves in the same direction as WTI due to shared global demand/supply themes.
If UKOIL breaks structure first, USOIL usually follows shortly after.
2️⃣ Natural Gas – “NATGAS”
Not directly correlated but reacts to energy-sector sentiment.
A sharp move in NATGAS can shift commodity-flow risk appetite.
3️⃣ Canadian Dollar – “USD/CAD”
CAD strengthens when oil prices rise and weakens when oil drops.
For a bearish USOIL plan, watch for USD/CAD upward pressure.
4️⃣ S&P 500 Energy Sector – “XLE”
Tracks major oil companies.
Weakness in XLE often signals upcoming pressure on crude.
5️⃣ OPEC Headlines + API/EIA Reports
Sudden supply changes or inventory spikes can trigger fast volatility.
Keep monitoring these events closely during active trades.
✅ LIKE if you find this useful!
✅ FOLLOW for daily trade plans & market insights.
✅ COMMENT your entry or adjustments below!
#TradingView #USOIL #CrudeOil #SwingTrading #DayTrading #TradingIdeas #Forex #Commodities #Bearish #RiskManagement
Let’s grow together – trade smart, stay disciplined, and engage! 💼🔥

USOIL_WTIUS West Texas Intermediate is in a downtrend and in the ABC wave, the main range where barrels and tanks can be filled is $44, which after filling and loading can grow by 60% and reach the $74.00 range. This analysis is for the long term.

XTIUSD channel pattern ShortXTIUSD has rejected from the chanlle pattern resistance and price may go still down and Short it . let us see how it palys out

USOIL (WTI) | Moving Downtrend...USOIL | Technical Overview🕯
Bearish Setup:
USOIL continues to show bearish momentum as long as the price trades below 56.40 and 56.05, maintaining pressure toward the next target at 54.38.
Bullish Setup:
To shift into a bullish structure, the market must close a 4H candle above 56.40, which would support an upside move toward 57.40.
Key Levels
Pivot Zone: 56.00 – 56.40
Support: 55.00, 54.40
Resistance: 56.90, 57.40
Timeframe: 4H | Bias: Bearish Volatility | Current Price: 56.00
previous idea:

USOIL Will Go Up From Support! Long!
Please, check our technical outlook for USOIL.
Time Frame: 1h
Current Trend: Bullish
Sentiment: Oversold (based on 7-period RSI)
Forecast: Bullish
The market is approaching a key horizontal level 56.995.
Considering the today's price action, probabilities will be high to see a movement to 57.830.
P.S
We determine oversold/overbought condition with RSI indicator.
When it drops below 30 - the market is considered to be oversold.
When it bounces above 70 - the market is considered to be overbought.
Like and subscribe and comment my ideas if you enjoy them!

USOIL The Target Is UP! BUY!
My dear subscribers,
This is my opinion on the USOIL next move:
The instrument tests an important psychological level 57.52
Bias - Bullish
Technical Indicators: Supper Trend gives a precise Bullish signal, while Pivot Point HL predicts price changes and potential reversals in the market.
Target - 57.80
My Stop Loss - 57.35
About Used Indicators:
On the subsequent day, trading above the pivot point is thought to indicate ongoing bullish sentiment, while trading below the pivot point indicates bearish sentiment.
Disclosure: I am part of Trade Nation's Influencer program and receive a monthly fee for using their TradingView charts in my analysis.
———————————
WISH YOU ALL LUCK
USOil Long RollerMain idea is based on RSI on 75m TF peaking (technically) {Green Arrow} and trend levels are marked (observationally) for trade executables.
$57.25 is average entry, to be rolled on expiry.
Thank you.
Any comments are welcome :)
