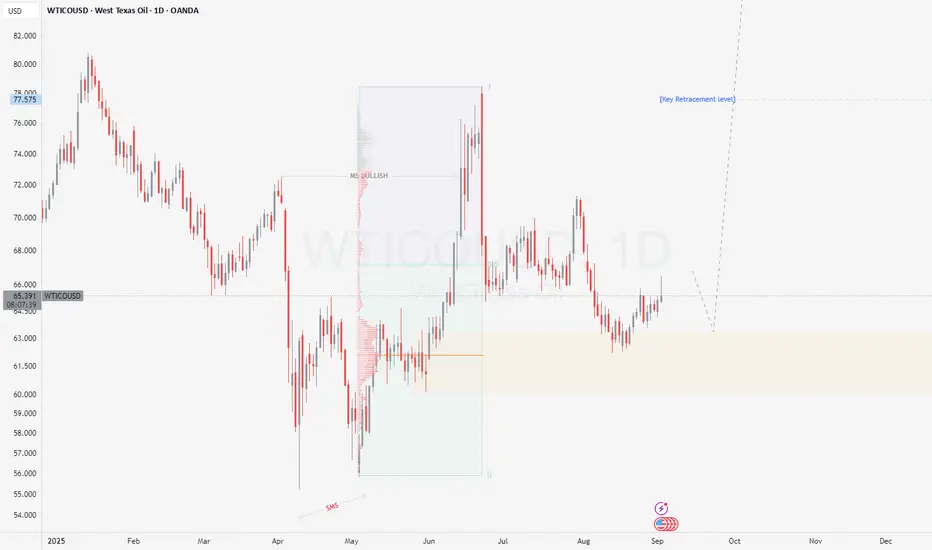
Crude Oil (XTI/USD) at Key Resistance: Breakout or Rejection ?Crude Oil (XTI/USD) has reached a major resistance level and now faces a critical decision point. If price breaks above this resistance, a long trade setup becomes attractive with upside targets at $70 and $71.
However, if rejection occurs at this level, downside momentum could build, with potential declines toward $60 and then $56. Traders should wait for price action confirmation before positioning, as the next move will likely define near-term market direction.
USOIL trade ideas

CRUDE OIL (WTI): Consolidation is OverFollowing a test of a significant daily support level, USOIL has been consolidating for an entire trading week.
Today's fundamental data has instilled a bullish sentiment in the market, and the price has successfully surpassed a major resistance point within its sideways movement.
It is anticipated that the market will continue to experience growth.
The next resistance level to watch is 66.72.

“WTI Crude Oil: Rebound Setup with $95 Target Ahead?”WTI Crude Oil Analysis 🛢️
Price is holding strong around the $59–62 support zone.
A breakout above the $70 trendline could open the way to $95–96.
🔹 Fundamentals: OPEC+ supply discipline, global demand recovery, and USD weakness could support the move.
⚠️ Risks: global slowdown, stronger USD, unexpected OPEC policy shifts.
👉 Setup looks bullish, but patience is key.
This is not financial advice.

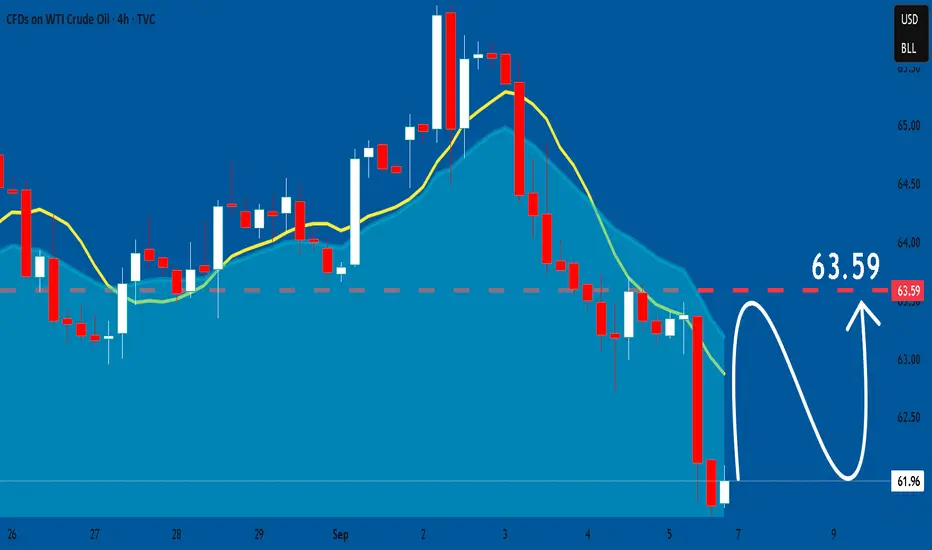
USOIL Will Explode! BUY!
My dear subscribers,
USOIL looks like it will make a good move, and here are the details:
The market is trading on 61.96 pivot level.
Bias - Bullish
Technical Indicators: Both Super Trend & Pivot HL indicate a highly probable Bullish continuation.
Target - 63.08
About Used Indicators:
The average true range (ATR) plays an important role in 'Supertrend' as the indicator uses ATR to calculate its value. The ATR indicator signals the degree of price volatility.
Disclosure: I am part of Trade Nation's Influencer program and receive a monthly fee for using their TradingView charts in my analysis.
———————————
WISH YOU ALL LUCK

Oil Crash | $33Price action making another leg down after retesting the breakout ~($68) from the descending triangle
Would like to see a move to $56 then another retest towards the breakout before any major selling.
Overall target for long term swing $33.

Pullback resistance holding – Bearish reversal in play?WTI Oil (XTI/USD) is reacting off the pivot, which has been identified as a pullback resistance that lines up with the 38.2% Fibonacci retracement and could drop to the 1st support.
Pivot: 65.81
1st Support: 62.17
1st Resistance: 68.85
Risk Warning:
Trading Forex and CFDs carries a high level of risk to your capital and you should only trade with money you can afford to lose. Trading Forex and CFDs may not be suitable for all investors, so please ensure that you fully understand the risks involved and seek independent advice if necessary.
Disclaimer:
The above opinions given constitute general market commentary, and do not constitute the opinion or advice of IC Markets or any form of personal or investment advice.
Any opinions, news, research, analyses, prices, other information, or links to third-party sites contained on this website are provided on an "as-is" basis, are intended only to be informative, is not an advice nor a recommendation, nor research, or a record of our trading prices, or an offer of, or solicitation for a transaction in any financial instrument and thus should not be treated as such. The information provided does not involve any specific investment objectives, financial situation and needs of any specific person who may receive it. Please be aware, that past performance is not a reliable indicator of future performance and/or results. Past Performance or Forward-looking scenarios based upon the reasonable beliefs of the third-party provider are not a guarantee of future performance. Actual results may differ materially from those anticipated in forward-looking or past performance statements. IC Markets makes no representation or warranty and assumes no liability as to the accuracy or completeness of the information provided, nor any loss arising from any investment based on a recommendation, forecast or any information supplied by any third-party.

WTI OIL Short-term Channel Up 4H MA50 buy opportunity.Last week (August 26, see chart below) we caught the absolute low with our WTI Oil (USOIL) buy signal, hitting our $66.30 Target shortly after:
This time we have another buy signal on the short-term as the Channel Up that emerged has pulled-back all the way to its 4H MA50 (blue trend-line).
The last 3 times it did so, it was a buy opportunity. Assuming this is another Higher Low bottom, the new Bullish Leg that is about to be initiated, should aim for the 1.382 Fibonacci extension, similar to what the previous two did.
This gives us a $66.75 Target for the short-term.
-------------------------------------------------------------------------------
** Please LIKE 👍, FOLLOW ✅, SHARE 🙌 and COMMENT ✍ if you enjoy this idea! Also share your ideas and charts in the comments section below! This is best way to keep it relevant, support us, keep the content here free and allow the idea to reach as many people as possible. **
-------------------------------------------------------------------------------
💸💸💸💸💸💸
👇 👇 👇 👇 👇 👇

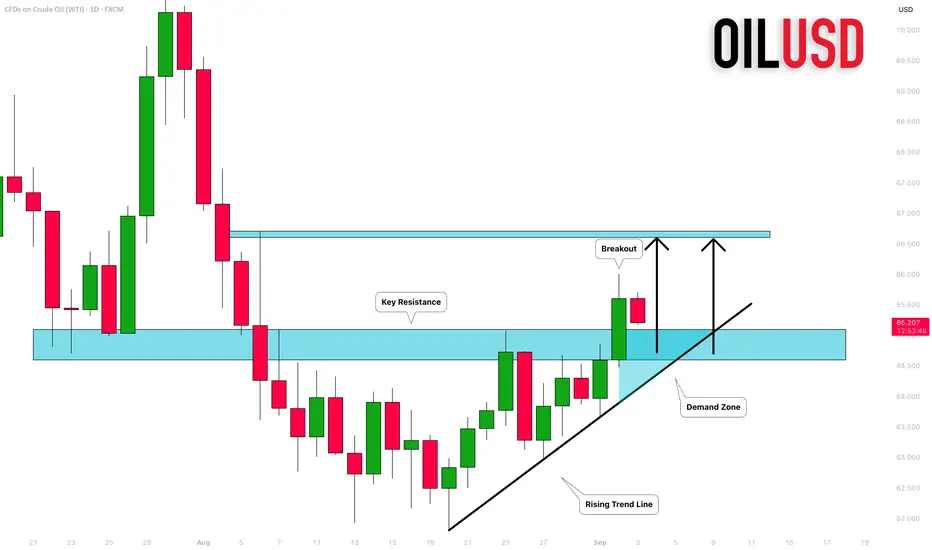
CRUDE OIL (WTI): Important Breakout!
With a strong bullish rally, WTI Crude Oil violated a significant
daily resistance cluster yesterday.
The broken structure and a rising trend line compose an important
demand zone now.
I will expect a bullish continuation from that.
Next resistance - 66.6
❤️Please, support my work with like, thank you!❤️
Bearish reversal forming at key resistance?WTI Oil (XTI/USD) is rising towards the pivot, which is an overlap resistance and could reverse to the 1st support.
Pivot: 65.82
1st Resistance: 66.80
1st Support: 63.79
Risk Warning:
Trading Forex and CFDs carries a high level of risk to your capital and you should only trade with money you can afford to lose. Trading Forex and CFDs may not be suitable for all investors, so please ensure that you fully understand the risks involved and seek independent advice if necessary.
Disclaimer:
The above opinions given constitute general market commentary, and do not constitute the opinion or advice of IC Markets or any form of personal or investment advice.
Any opinions, news, research, analyses, prices, other information, or links to third-party sites contained on this website are provided on an "as-is" basis, are intended only to be informative, is not an advice nor a recommendation, nor research, or a record of our trading prices, or an offer of, or solicitation for a transaction in any financial instrument and thus should not be treated as such. The information provided does not involve any specific investment objectives, financial situation and needs of any specific person who may receive it. Please be aware, that past performance is not a reliable indicator of future performance and/or results. Past Performance or Forward-looking scenarios based upon the reasonable beliefs of the third-party provider are not a guarantee of future performance. Actual results may differ materially from those anticipated in forward-looking or past performance statements. IC Markets makes no representation or warranty and assumes no liability as to the accuracy or completeness of the information provided, nor any loss arising from any investment based on a recommendation, forecast or any information supplied by any third-party.

WTI BUY OPPORTUNITY Price rebound at a support level of 62.5 technically we anticipate some bullish price action to develop away from that level. Also, there’s a decrease in oil production according to report from EIA therefore there’s an increase in demand which shows that buyers are likely to take the price higher from the current price. Target profit is 64.5

USOIL: Bullish Forecast & Outlook
Balance of buyers and sellers on the USOIL pair, that is best felt when all the timeframes are analyzed properly is shifting in favor of the buyers, therefore is it only natural that we go long on the pair.
Disclosure: I am part of Trade Nation's Influencer program and receive a monthly fee for using their TradingView charts in my analysis.
❤️ Please, support our work with like & comment! ❤️
USOIL BUY BIASBUY bias on us oil. We have multiple confluences such as
1) Demand Level
2) Pivot Level
3) Buying pressure in form of candlesticks signals

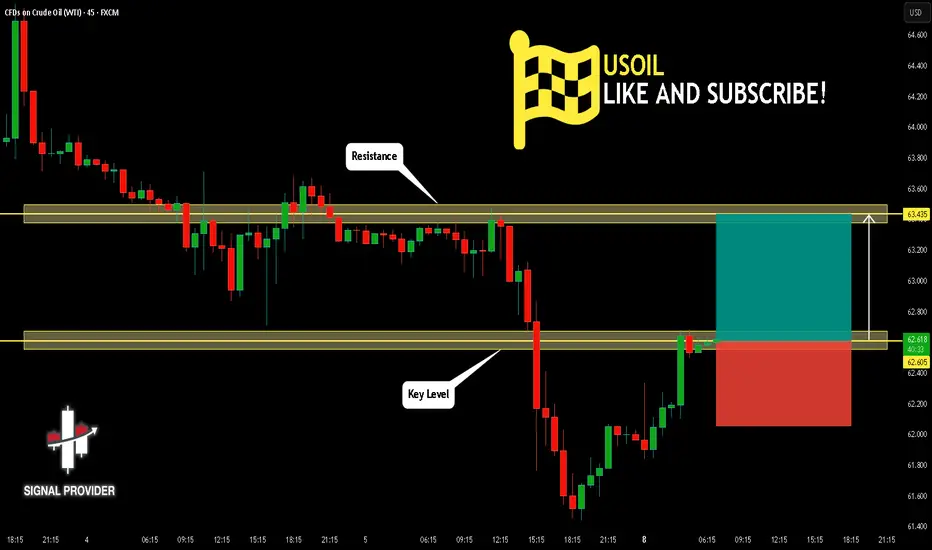
USOIL Is Going Up! Long!
Take a look at our analysis for USOIL.
Time Frame: 45m
Current Trend: Bullish
Sentiment: Oversold (based on 7-period RSI)
Forecast: Bullish
The market is approaching a key horizontal level 62.605.
Considering the today's price action, probabilities will be high to see a movement to 63.435.
P.S
Overbought describes a period of time where there has been a significant and consistent upward move in price over a period of time without much pullback.
Disclosure: I am part of Trade Nation's Influencer program and receive a monthly fee for using their TradingView charts in my analysis.
Like and subscribe and comment my ideas if you enjoy them!
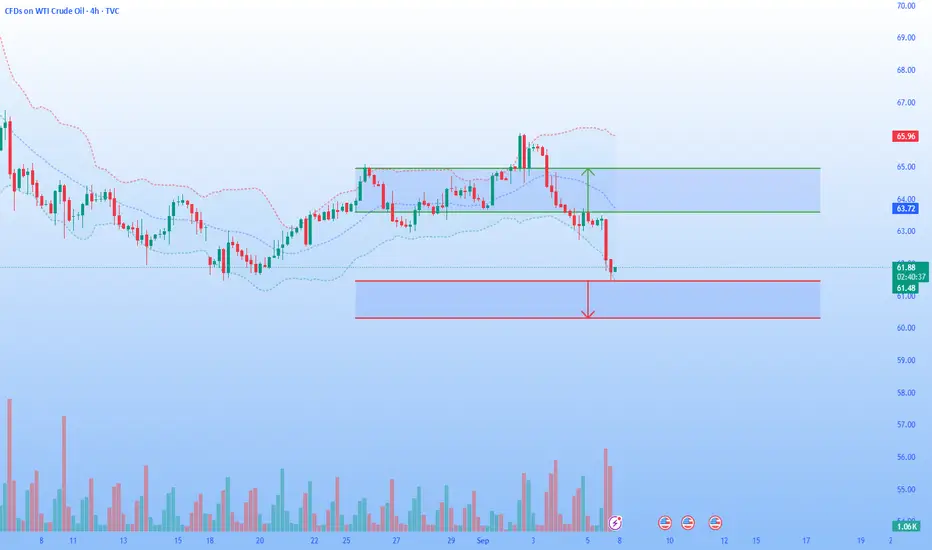
USOIL Latest Analysis and Precise Trading SignalsUSOIL News Analysis: US crude oil inventories unexpectedly increased by 2.4 million barrels last week. Market expectations suggest OPEC+ may consider further production increases at its meeting this weekend, heightening oversupply concerns. International crude oil prices fell to a two-week low during Thursday's trading session. Market research indicates that OPEC+ will hold a meeting this Sunday, with eight member countries and major oil-producing nations such as Russia discussing whether to increase production further in October. If this decision is made, OPEC+ will lift its production cuts of approximately 1.65 million barrels per day, representing 1.6% of global demand, more than a year ahead of schedule.
Technical Analysis: Yesterday, international oil prices saw a slight rebound after breaking the bottom in volatile trading. They quickly retreated in the evening, breaking through the 62.8 mark before quickly rebounding. The daily candlestick chart closed with a small bearish candlestick pattern. Oil prices are showing signs of breaking below the 14-day moving average, but technically haven't broken below the support level. Short-term focus is on the upper resistance level of 64.7 and the lower support level of 62.2. USOIL watershed is $63.7
USOIL Latest Trading Recommendations:
1. Buy Support Zone: $61.3-60.6, Target: $62.2-62.8
2. Sell Resistance Zone: $63.7-64.5, Target: $62.8-62.3
Trading involves risk; manage your position appropriately.
WTI - Moscow's Discounts Keep Russian Oil Flowing to IndiaIndian refineries are still incentivized to buy Russian Urals oil, says Commerzbank Research's Carsten Fritsch. President Trump inflicted stiff tariffs on New Delhi--including a 25% levy for its purchases of Russian oil--but Indian Prime Minister Narendra Modi appears unwilling to bow to U.S. pressure. Meanwhile, the Kremlin cut the price of its oil in order to keep Indian customers. "This oil is being offered at a discount of $3-$4 per barrel compared to Brent for cargoes loaded at the end of September and in October," Fritsch says, citing unnamed sources. "By comparison, Indian refineries recently had to pay a premium of $3 over Brent for U.S. oil."
WTI Surges Above 65$ ResistanceCrude oil is currently supported by a combination of energy sanctions, geopolitical tensions, and rate cut expectations — with price action eyeing the $70 barrier as long as it holds above $65.20.
WTI maintained its rebound above the 61.80–62.00 support zone — aligning with the neckline of the previous inverted head and shoulders formation — and has broken above the 65 resistance level, signaling a potential continuation of bullish momentum. Daily RSI has also moved above the neutral 50 level, further confirming upside momentum.
• A clean hold above 65.20 may extend the rally toward 68.00, 69.40, and 70.40 — the next major resistance levels.
• On the downside, 62.00 and 61.80 remain key support levels. A break below them could expose oil to deeper losses toward 59.40 and 57.90.

USOIL Is Bullish! Long!
Here is our detailed technical review for USOIL.
Time Frame: 12h
Current Trend: Bullish
Sentiment: Oversold (based on 7-period RSI)
Forecast: Bullish
The market is on a crucial zone of demand 63.116.
The oversold market condition in a combination with key structure gives us a relatively strong bullish signal with goal 65.546 level.
P.S
Please, note that an oversold/overbought condition can last for a long time, and therefore being oversold/overbought doesn't mean a price rally will come soon, or at all.
Disclosure: I am part of Trade Nation's Influencer program and receive a monthly fee for using their TradingView charts in my analysis.
Like and subscribe and comment my ideas if you enjoy them!

WTI OIL 4H BUY SIGNAL WTI OIL 4H Buy Signal 🟢
After catching last week’s low and hitting $66.30 target, WTI now pulled back to the 4H MA50 inside the short-term Channel Up.
The last 3 touches = buy opportunities ✅.
If this Higher Low holds, a new bullish leg should target the 1.382 Fib extension → $66.75 🎯.
Kaizo precision. Next move loading… 🥷🔥

USOIL BEARS WILL DOMINATE THE MARKET|SHORT
USOIL SIGNAL
Trade Direction: short
Entry Level: 65.90
Target Level: 59.95
Stop Loss: 69.84
RISK PROFILE
Risk level: medium
Suggested risk: 1%
Timeframe: 1D
Disclosure: I am part of Trade Nation's Influencer program and receive a monthly fee for using their TradingView charts in my analysis.
✅LIKE AND COMMENT MY IDEAS✅

USOIL: Bears Are Winning! Short!
My dear friends,
Today we will analyse USOIL together☺️
The in-trend continuation seems likely as the current long-term trend appears to be strong, and price is holding below a key level of 61.933 So a bearish continuation seems plausible, targeting the next low. We should enter on confirmation, and place a stop-loss beyond the recent swing level.
❤️Sending you lots of Love and Hugs❤️

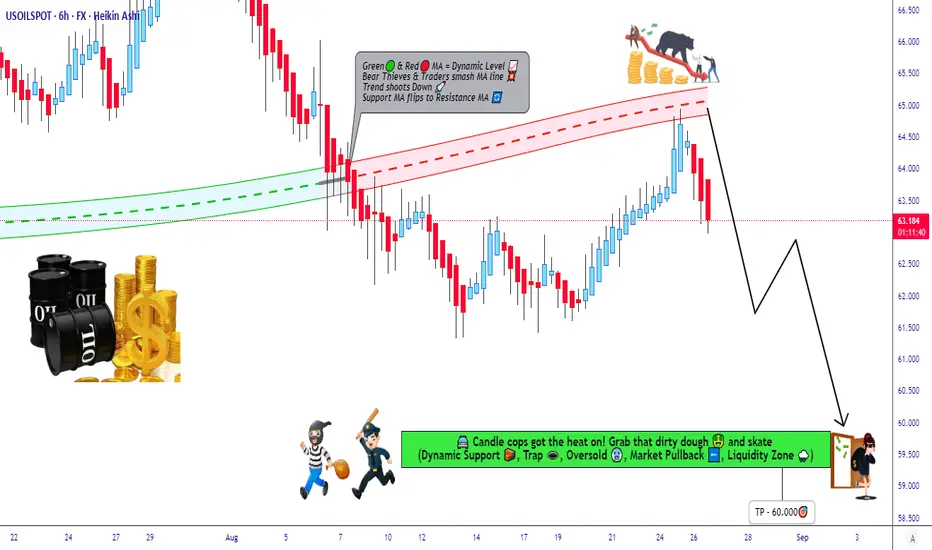
USOil Bear Trap Set: Ready For The Downside Raid?🛢️ WTI Oil Bearish Heist Plan 💣 | Thief Trader Layers Activated 🔐
💥 Welcome to the vault raid, Thief OG’s! 💥
We’re targeting US Oil Spot / WTI (XTIUSD) — and this time, the plan is pure Bearish robbery.
🚨 The Robbery Setup:
This isn’t just a sell — it’s a layered ambush. We place traps, let bulls walk in, and then we rob clean.
📌 Thief Entry Plan (Limit Layers):
Sell Limit @63.000
Sell Limit @63.500
Sell Limit @64.000
Sell Limit @64.500
👉 You can stack more layers if the vault door keeps opening.
🛑 Thief Stop Loss:
SL locked @65.500 🔒
⚠️ Adjust your SL like a true Thief — according to your risk + number of layers.
🎯 Escape Plan (Target):
🚔 Police barricade spotted around 59.000.
📌 Official Heist Exit: 60.000 — grab the loot before the cops arrive.
🧠 Thief Strategy Logic:
Multi-layer sell ambush 🏴☠️
Bearish pressure from supply + demand shifts 📊
Technical rejection zones aligning with macro weakness 📉
⚠️ Risk Management Note:
Thieves don’t rush!
👉 Place alerts before the raid.
👉 Don’t dump blind orders — wait for price to approach layers.
👉 Manage your position like a stealth operation, not a casino gamble.
💬 Thief Community Code:
Smash ❤️ & Boost if you’re with the robbery crew.
Drop your charts + sniper entries below.
We rob together. We win together. 🏆
🔔 Stay locked in — more heist plans dropping soon.
💰 Rob Smart. Trade Sharp. Exit Clean.
Brent Crude Futures Remember when Oil was $100 a barrel??? Looks like we are headed right back there.
Every 90 weeks we get a "change in trend" for Brent. This week Brent is 180 weeks down from high and 90 weeks from low. It is time for a turn. Brent was up 1.4% August 26. It is turning higher in sync with this 90-week cycle. And when you see a close above 72.65, be ready for "panic buying" and an oil shock.
But we all can use a little exercise. Time to either ride bikes, car share or SAVE and MANAGE money for Gas!!

USOIL H4 | Bullish reversal setup formingUSOIL is reacting off the buy entry which is a swing low support and could potentially rise from this level to the upside.
Buy entry is at 61.66, which is a swing low support that aligns with the 138.2% Fibonacci extension.
Stop loss is at 60.88, which is a pullback support that aligns with the 161.8% Fibonaci extension.
Take profit is at 63.43, whichis a pullback resistance that aligns with the 50% Fibonacci retracement.
High Risk Investment Warning
Trading Forex/CFDs on margin carries a high level of risk and may not be suitable for all investors. Leverage can work against you.
Stratos Markets Limited (tradu.com ):
CFDs are complex instruments and come with a high risk of losing money rapidly due to leverage. 65% of retail investor accounts lose money when trading CFDs with this provider. You should consider whether you understand how CFDs work and whether you can afford to take the high risk of losing your money.
Stratos Europe Ltd (tradu.com ):
CFDs are complex instruments and come with a high risk of losing money rapidly due to leverage. 66% of retail investor accounts lose money when trading CFDs with this provider. You should consider whether you understand how CFDs work and whether you can afford to take the high risk of losing your money.
Stratos Global LLC (tradu.com ):
Losses can exceed deposits.
Please be advised that the information presented on TradingView is provided to Tradu (‘Company’, ‘we’) by a third-party provider (‘TFA Global Pte Ltd’). Please be reminded that you are solely responsible for the trading decisions on your account. There is a very high degree of risk involved in trading. Any information and/or content is intended entirely for research, educational and informational purposes only and does not constitute investment or consultation advice or investment strategy. The information is not tailored to the investment needs of any specific person and therefore does not involve a consideration of any of the investment objectives, financial situation or needs of any viewer that may receive it. Kindly also note that past performance is not a reliable indicator of future results. Actual results may differ materially from those anticipated in forward-looking or past performance statements. We assume no liability as to the accuracy or completeness of any of the information and/or content provided herein and the Company cannot be held responsible for any omission, mistake nor for any loss or damage including without limitation to any loss of profit which may arise from reliance on any information supplied by TFA Global Pte Ltd.
The speaker(s) is neither an employee, agent nor representative of Tradu and is therefore acting independently. The opinions given are their own, constitute general market commentary, and do not constitute the opinion or advice of Tradu or any form of personal or investment advice. Tradu neither endorses nor guarantees offerings of third-party speakers, nor is Tradu responsible for the content, veracity or opinions of third-party speakers, presenters or participants.
